
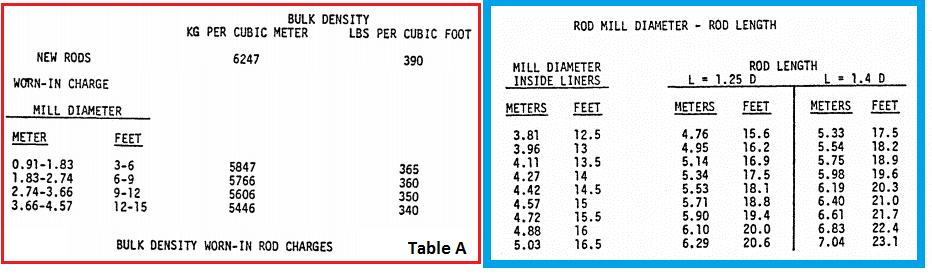
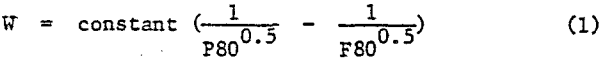
The following equation is used to determine the power that a rod mill should draw. The Bottom Table lists many of the common size rod mills giving speed, loading and power data. The rod mill motor power is in horsepower at the mill pinion-shaft. For different length rod mills power varies directly as rod length. For difference between new and worn liners increase power draw by 6%, and adjust for bulk density per Table A.
Wet grinding rod mills are normally used in minerals processing plants. Experience with dry grinding generally indicates many difficult problems and should be avoided except where absolutely necessary; in which case the problem should be referred to the mill manufacturers for recommendations.
The various rod mill manufacturers have different equations for determining the power rod mills draw, but all come close to the same calculated power draw.
Rod and Ball Mills by C.A. Rowland and D.M. Kjos @ Allis-Chalmers
Using the Bond Operating Work Index for Circuit Performance Assessment
Grinding circuit efficiency determination must account for variations in;
(a) feed rate;
(b) power consumption;
(c) feed and product sizes; and,
(d) material grindability.
The relative efficiency for size reduction of a given material from a constant feed size to a constant product size can readily be seen as linearly proportional to the tonnage treated (directly) or the power consumed (inversely). Bond (1961) observed that material size distributions as naturally produced through stages of comminution were highly consistent, and therefore could be represented by a single value such as the 80% passing size. Secondly, from numerous observations, he derived the following approximate relationship between the per unit work applied by the comminution device and the amount of size reduction achieved, commonly referred to as the “Bond Law of Comminution”.
W = work per unit mass
F80 = passing feed size
P80 = 80% passing product size
The constant in this equation is tensed the Bond Operating Work Index, Wio. Assuming Wio does not change as a function of the feed or product sire, and the ore itself has not changed, it is a direct measure of circuit efficiency, variations in circuit feed and product size taken into account.
Bond Laboratory Work Index determinations (one for each type of comminution machine) are widely used for mill sizing, but may also be used to monitor ore grindability characteristics in circuit evaluation work. In the latter case, correction factors needed for reasonably accurate scale-up to industrial size mills under various design conditions may be factored out of the basic Bond Operating Work Index, to derive the “Corrected” Operating Work Index, for direct comparison with the Laboratory Work Index for the same ore.
Note, however, that this “corrected” figure is much less meaningful than the basic Bond Operating Work Index for circuit performance evaluation purposes because it no longer pertains to the actual power efficiency that the circuit, as designed and operated, is providing. Within the limitations of the accuracy of the assumptions previously mentioned, the uncorrected Bond Operating Work Index is the true indicator of basic relative circuit efficiency, and is therefore used throughout this paper.
Precise descriptions of procedures for data acquisition are not generally included in reports on plant operating experiences, and neither is ore grindability normally monitored during plant testwork. However, it is nevertheless reasonable to reach clear conclusions about changes in relative circuit efficiency, as defined by the Bond Operating Work Index, by sensible interpretation of consistently, if not accurately, collected and reported operating data.
Basics of Rod Mill Power Draw
A table of estimates of rod mill power draw is published in Rowland’s work (1982). Figures in this table are generally slightly low compared to some reported plant data or other manufacturers’ estimates, and are based on an empirical formula initially proposed by Bond (1961) designed to cover a wide range of mill dimensions, and the normal operating range of mill load (Vp = .35 to .50) and speed (Cs = .50 to .80). Please see the reference article for S.I. equivalents.
KWr = 1.07 D.34 (6.3-5.4 Vp)Cs………………………………………………………..(2)
KWr = kilowatts per short ton of rods.
D = mill diameter indise liners, in feet.
Vp = fraction of mill volume rod load (ground out mill).
Cs = fraction of critical speed.
The power draw of the mill is then obtained by multiplying KWr by the tons of rods in the mill, which yields:
KW = (πD²/4 L V pρ)(1.07 D.34 (6.3-5.4 Vp ))Cs………………………………………………….(3)
KW = mill power draw at the pinion shaft, kilowatts.
p = rod charge bulk density, tons per cubic foot.
L = mill effective working length, feet.
Note that different manufacturers’ nominal mill dimensions may vary, but are normally inside shell diameter, by effective length inside end liners at the shell.
Of general note are the following observations :
- Power draw is related directly to mill length, and, empirically to the diameter to the power 2.34. Theoretically, this exponent should be 2.5 (Bond, 1961).
- Power draw is directly related to mill speed (in r.p.m., or, fraction of critical speed) over the normal operating range.
- Differentiation of KW with respect to V in equation (2) shows that power draw increases with charge level to peak at about Vp = .58. For rod, ball, or pebble mills the peak is usually near Vp = .50, while actual observations as low as V= .42 have bean made in some ball mills (Rowland, 1973). See Figure 2.
- Power draw is not significantly affected by the presence of the slurry in the mill. While the presence of the slurry will effect the charge density, the charge swelling (moving the centre of gravity of the mass near the mill centre line) and added lubricity are offsetting factors, so the net effect of initially adding feed to the mill can only be determined by observation.
- The bulk density of a new or freshly culled (i.e., broken rods removed), graded rod charge is 390 lbs. per cubic foot (5.0 kg/m³) Due to lack of culling and the greater tendency for rods to break as mills increase in size, the estimated bulk density of the rod charge must be reduced accordingly (Rowland, 1982).
Note that the above equation (3), was derived to empirically relate power consumption over a wide range of mill sizes, on various slurries, as well as over a fairly broad range of mill speed and load levels, all combined into a single expression. Effects such as slurry density, media size, liner condition, and trunnion opening size are ignored. Although it still provides a close approximation, the limits of accuracy, easily plus or minus 5 to 10%, should be recognized. As well, interpretation of the concise effect of any single variable taken out of the context of the complete equation may be misleading.