Table of Contents
Commercial pressure leaching autoclaves have been in operation since mid 1950s. Historical production data suggest that these early autoclaves were originally designed with excess capacity (Berezowsky, Collins, Kerfoot, and Torres, 1991). Process development initially consisted of tests in batch autoclaves. While in some cases this stage had been followed by continuous pilot plant tests in multi-compartment autoclaves, in many cases the batch test residence times were extended to the continuous commercial stage.using some factor, resulting in an over estimation of the required autoclave volume. In some other instances the continuous stage of testing had not been performed or its results could not be interpreted as a continuation of batch tests due to differences in ore composition, grind size and reactor conditions. In such cases, it would be important to be able to scale-up the batch test data to a multi-compartment continuous mode using a sound approach that takes into account both the physical and chemical aspects of the leaching reaction as well as the reactor configuration.
Today, the fraction of capital cost of a hydrometallurgical plant associated with the pressure autoclaves could be as high as 30% of the total capital expenditure. Moderate over-estimation of volume requirements can significantly drive-up such costs, either through buying larger autoclaves or (since transporting such units can be difficult) unneeded extra units. This can be avoided by a thorough understanding of the effects of autoclave configurations on scale-up to the commercial-scale units. While it is important to avoid over-design and its associated costs, the engineer must also ensure that possible variations in ore grade and quantities will not lead to shortfalls in extraction efficiency for the design residence time.
Factors Affecting Autoclave Size
In a recent paper on design of autoclaves for pressure leaching of nickel laterites (King, 1996), the following have been listed as the determining factors in the pressure autoclave size:
- solids throughput and size distribution
- selected autoclave circuit
- slurry density
- retention time
- temperature
- number of operating trains
- shipping restrictions.
Retention time is independent of throughput as long as all of the other aforementioned factors are kept constant. Assuming that reaction condition and feed properties are uniform, several approaches have been followed to arrive at scale-up factors to predict continuous retention times from batch laboratory tests. While most of these methods are based on assumptions that include the shrinking of solids particles that are dissolving by reaction with an aqueous reagent, the earliest method considered was an extension of homogeneous scale-up calculations.
Scale-Up Assuming Homogenous System
The simplest approach for sizing of autoclaves was that used by O’Kane (1963) in his paper on “Pressure Leach Autoclave Design”. The method used was based on an earlier work (Caddell and Hurt, 1951). It consisted of taking a leach curve (mineral conversion versus time) from the batch test results and using it graphically to determine each continuous autoclave compartment residence time. Hence the overall autoclave size for a given target conversion could be calculated. This method assumes that the solubilization reaction is so fast that the heterogeneous leaching reaction approaches a homogeneous one, and the reaction rate can be represented merely in the units of time -1.
In developing their method, the authors assumed that the composition of the reacting species is constant within the autoclave compartment. In a laboratory batch test, however the reaction rate is initially high due to the high reactant concentration. They proceeded to assume that in an autoclave compartment, the reaction rate is equal to the minimum that prevails at the end of a corresponding batch cycle resulting in the same concentration and can be represented by the slope of the leach curve at that point. The graphical method comprises drawing a tangent to the leach curve at the designated exit composition point for the final compartment. This is done by starting at the end compartment and extending the tangent until an assumed residence time was reached. The point on the curve horizontally across from where the tangent ends, is where one should continue the process by drawing the tangent for the penultimate compartment unit and so on.
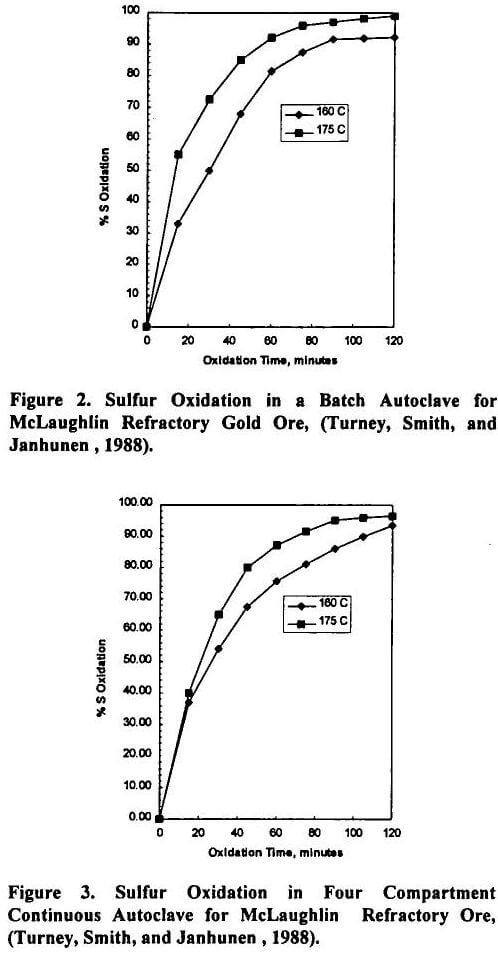
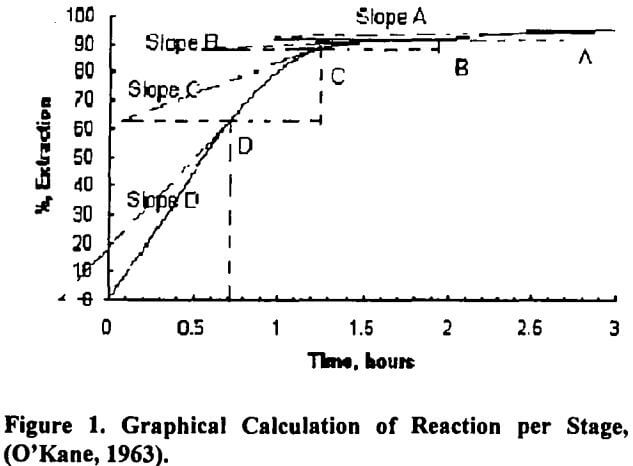
Figure 1 shows this approach for a four-compartment autoclave, where a 95% conversion has to be achieved. If after repeating this procedure four times for a pre-assumed compartment residence time, the horizontal projection of the tangent drawn for compartment one does not intersect the origin, then the process would have to be repeated, with a new assumption for the unit residence time.
In addition to obvious short comings of using a method intended for liquid-liquid reactions for mineral solubilization, to apply this method graphically would render a rather subjective result. It is possible to use spreadsheets and apply computer programming to this method so as to arrive at an accurate implementation of the method. In such an approach, the engineer faces the challenge of developing a true quantitative representation of the leach curve and the corresponding tangents (reaction rates).
Sample Test Data
The sample test data used as an example in this paper is that reported by Turney, Smith, and Janhunen (1988) on the McLaughlin refractory gold ore. The test work reported consisted of both batch and continuous pilot scale. The batch test is not described in any detail. It is assumed that the batch tests were performed in Parr batch autoclaves with the same feed and reactor conditions as the reported continuous tests. The continuous tests were conducted in a four compartment laboratory autoclave at a feed rate of 6.6 lb./hr with a retention time of about 1½ hours at 160 and 175 °C and pressure of 175 psig. The oxygen over-pressure was reported to be 30 psi. Each compartment was equipped with a thermowell, an oxygen sparge tube and a sample dip tube. Adequate agitation was achieved by axial flow impellers and baffles. The useful volume of each compartment was slightly short of 2½ gallons. Heating was provided to each compartment by a direct gas burner.
Figures 2 and 3 show the batch and continuous leach curves for the pressure oxidation tests. Figur
e 2 illustrates the rate of sulfur oxidation for the batch test at 165 and 175 °C. It was shown that in a similar fashion to first order shrinking core reactions under surface reaction control, the reaction rate while increasing with temperature, decreases with % sulfur converted.
Figure 3 shows the same trends for changes in reaction rate with temperature and %sulfur converted. However, in this case, where the testing was continuous, more residence time is required to achieve a target conversion. The main focus of the current paper is the accurate prediction of this scale-up in residence time.