Tools of a Metallurgist

Compare Flotation Test Results

Grade vs Recovery Curve

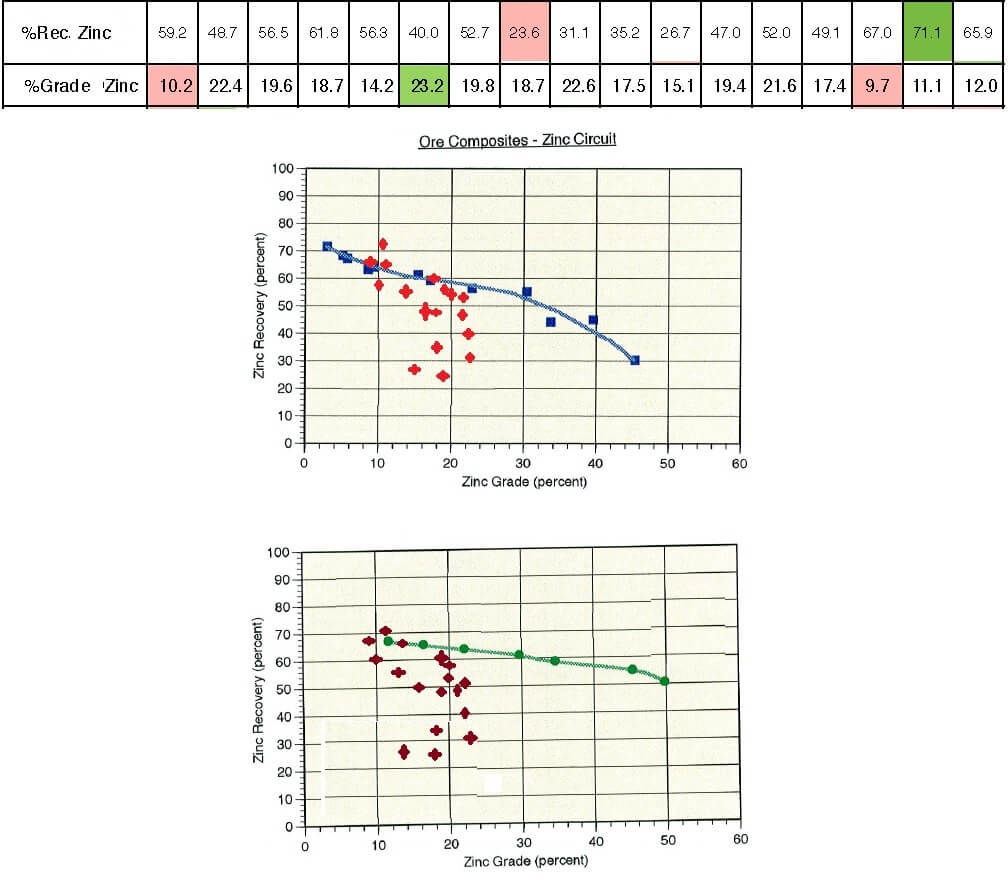
Learning how to compare flotation test results made easy:  One set of test from Lab A is displayed by the red dots and compare to the blue and/or green data set from Lab B. Lab B is red inferior. Here are the comparative Grade VS Recovery Curves. Metallurgical Efficiency: One of the most important and basic … Read more

Remove Trash from Flotation Circuit via Screen-Box in Grinding Circuit

Flotation Feed Trash Screen

An on-stream analyzer and small regrind cyclones (their small 1/2″ Apexes) were being plugged by trash coming from the underground mine in the form of wood and plastic.  A simple solution was to install a homemade screen box on the cyclone overflow prior to feeding flotation.  The operator cleans it daily, thanks to the overhead … Read more

Schuhmann Plot

Schuhman Plot

A Schuhmann Plot help smooth out particle size data. I attach a graph created for a settling test of flotation concentrates. You draw/create a Schuhmann Plot using the details found in  http://technology.infomine.com/enviromine/ard/mineralogy/Size%20&%20Liberation.htm and http://www.chem.mtu.edu/chem_eng/faculty/kawatra/CM2200_2009_HW_3_sizedist.pdf