The flocculation process involving fine particles and organic polymers can be depicted by the following sequence:
- adsorption of the polymeric species on particles,
- conformational changes in the adsorbed polymer molecules, and
- collisions between particles to form flocs through bridging.
Flocculation is the result of mixing the polymer with the particle slurry in some device, e.g., tank equipped with stirrer, static mixers, or in-line mixing. This mixing can also cause the flocs formed to break apart. The flocculation of fine particles happens rapidly and is very complex since the above-mentioned steps can occur simultaneously. To obtain insight into how the flocculation process occurs, considerable research has been conducted on how polymers adsorb and their subsequent effect on colloid stability. Other aspects of the flocculation process such as floc size, shape, density, and strength have also been reported.
Another method to study the flocculation sequence is the use of rheological techniques. When torque is applied to flocculated slurries, the rate of floc degradation can be measured. This paper presents rheological data previously reported by the Bureau of Mines; these data are discussed in terms of the flocculation mechanism.
Previous Research
The thixotropic behavior of cement has been previously described by Tattersall.
T – Tc + (To – Te) exp (-3t)…………………………………………………(1)
where To is the torque at time zero, Te is the torque at the end of the treatment, and 5 is the breakdown kinetic constant. The following terms from equation 1 were defined in the original Tattersall derivation as follows:
To – Te = ΔT = K(ω – ω1)……………………………………………………(2)
a = (2πK/no∅) ω(ω – ω1)…………………………………………………..(3)
where K is a constant of proportionality, ω and ω1, are the rotation rates, and no∅ is the breakdown energy density. The relationship was further modified by Lapasin, et al., as shown in equation 4:
no∅ = ω ΔT/B……………………………………………………….(4)
where no is the number of links that must be broken pass from the state represented by To to that of TB, ∅ is the energy of one link, B is the Breakdown kinetics constant, and ω is the rotation rate of the viscometer.
In previous research conducted by the Bureau of Mines, calcium montmorillonite was flocculated with various amounts of polyethylene oxide (PEO), and the rheology of the slurry was studied using a Rotovisco, model RV12, fitted with a stainless steel NV rotor. The rotor and cup had a double-gap, covette-type geometry.
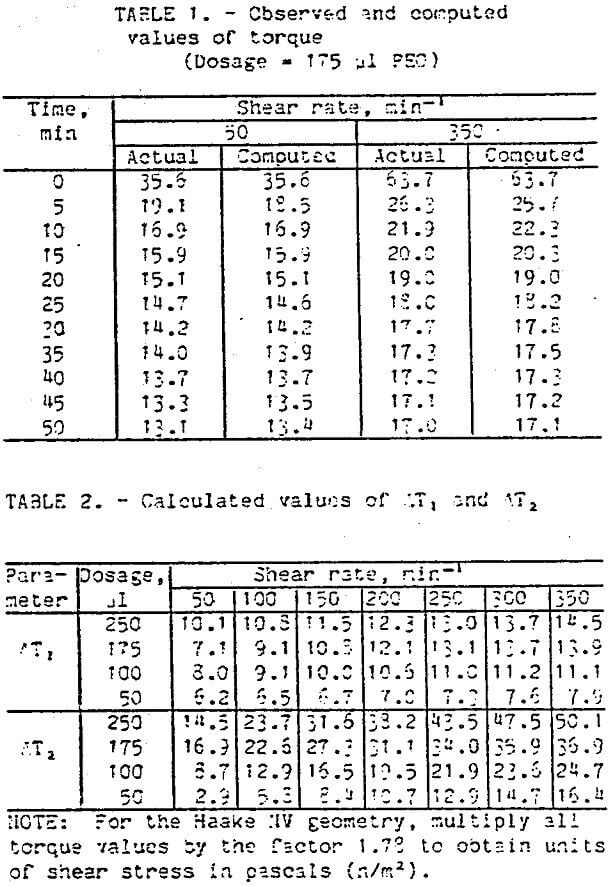
The results obtained were analyzed using the Lapasin approach; for the data, a semilogarithmic plot of the T-Te versus time should give a straight line if equation 1 is valid for the system. Figure 1 is a plot for the calcium montmorlllonito-PEC system. As can be seen, there is a sharp departure from linearity at times loss than 5 min.
Further testing of the PEO-montmorillonite system led to the conclusion that this phenomenon was not the result of some random event, but rather the thixotropic breakdown of an entirely different flow unit possessing its own unique breakdown kinetics rate constant. To explain this phenomenon, the Tattersall equation was modified as follows:
T = Te + ΔTi exp (-B1t) + ΔT2 exp (-B2t)………………………………………………………….(5)
where ΔT1 and ΔT2 represent the change in torque (analogous to the original To -Te) for each flow system considered separately, and B1 and B2 represent the individual flow unit breakdown kinetics rate constants. As is indicated by equation 5, the effects of these flow units were assumed to be additive.
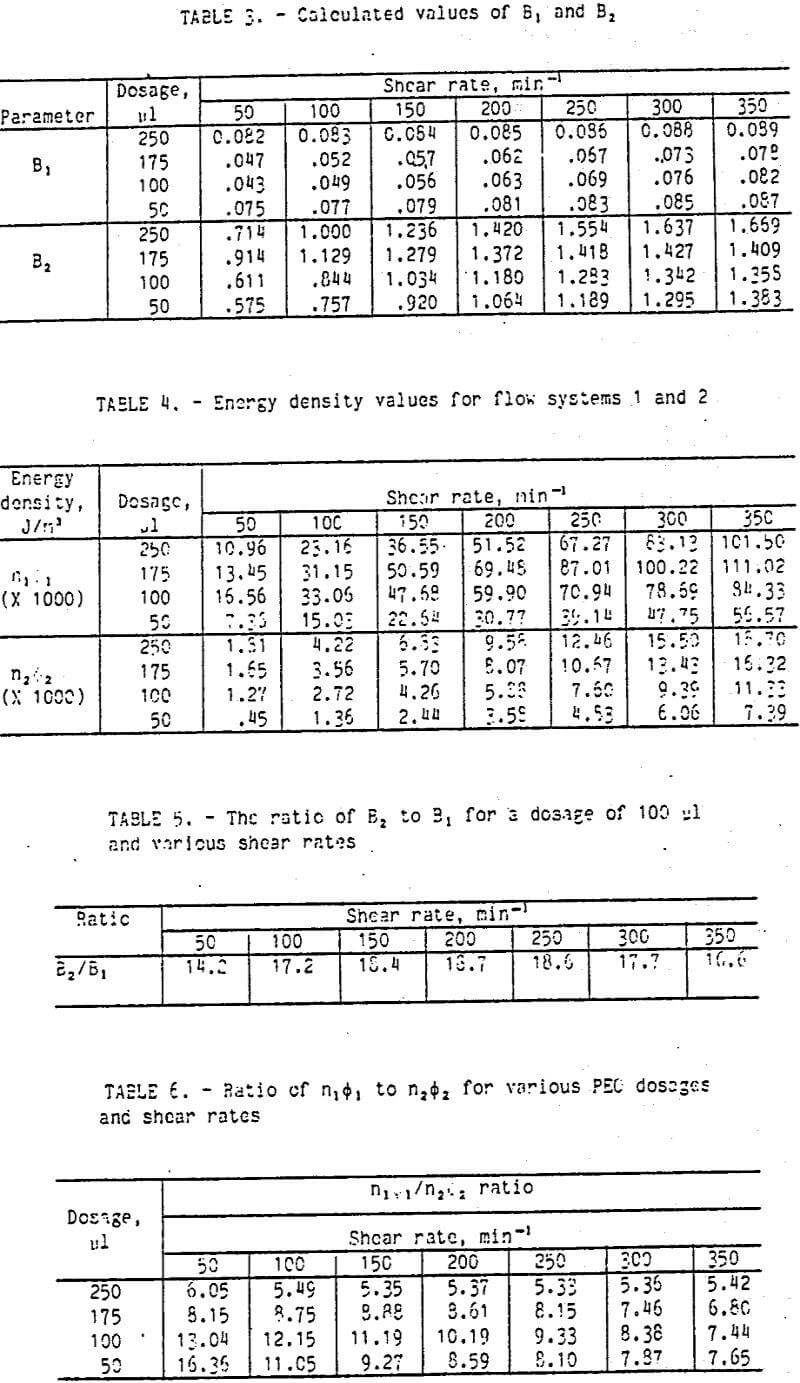
To determine if equation 5 was representative of the calcium montmorillonite system, the data were analyzed in the following manner. From figure 1, it should be apparent that a straight line can be drawn through the data, intersecting the y-axis at a value of 0.3. At this point, t = 0 and the quantity ΔT1, exp (-5,t) reduces to ΔT, (in this case ΔT1, = 8.3]). By next selecting an arbitrary point from the line drawn through the point (0, 8.3), outside the region of flow system 2 influence (t>5 min), and using the value of ΔT, previously determined, the value of B1, can be determined. In like fashion, the values of ΔT2 and B2 can be determined by using the largest value of the T-Te sum at t = 0 and an arbitrary point within the influence of the second flow system. The data from figure 2 would give ΔT2 = (T-Te ) – ΔT1 = 15.1 – 8.3 = 6.8.
The results of a calculation as previously described are graphically presented as figure 2. On this semi logarithmic plot, each of the flow systems is identified. The summation of each of these flow systems would produce a plot similar to that shown in figure 1 when graphed on a normal scale. Table 1 gives the correlation between the observed and calculated values of torque.
The energy density function was previously defined as
no = ωΔT/B…………………………………………………………..(4)
In accordance with modifications made to the Tattersall equation, the energy density function for the PEO-montmorillonite system now becomes
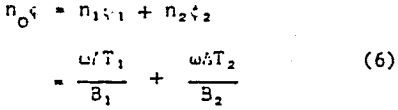
where no1, and no2, represent the contribution to the total energy density of the system by each of the two flow systems. Once more they are considered to be additive in nature. Using equation 6, the values of ΔT1, and ΔT2, (table 2), B1, and B2 (table 3), and no1 and no2 (table 4) were calculated.
Discussion of Results
From the data shown in tables , several points relative to the flocculation sequence can be made. In table 3, the breakdown rate constant for the two flow units is considerably different. The breakdown rate constant for flow unit 2 is considerably larger than for flow unit 1. For example, at a PEC dosage of 100 µl the ratio of B2 to B1, is shown in table 5.
For the series of shear rates tested, the average ratio of B2/B1, was 17.3. This means that B1, and B2, represent different types of bonds being effected. For the flocculation sequence, the first step is the adsorption of polymer on the particle. The adsorption produces loops, tails, and trains. The loops and tails extend into the bulk solution and can adsorb on another particle, thus forming a bridge between two particles. This process was repeated many times as the floc grew in size. At some point in the flocculation sequence, large flocs were brought together under hydrodynamic forces to form even larger aggregates. Several mathematic models have been developed to describe the growth of flocs. One explanation of the data found in table 4 is to assign B2 as being representative of bridge formation of large flocs into agglomerates, while B1 would represent the bridging of fine particles into small flocs. Based on the ratio of B2/B1 attachment of large flocs to each other by loops and tails was approximately 17 times more likely to be broken than attachment of small flocs to each other for the system studied.
In table 4, the energy density (ni∅i) values for flow systems 1 and 2 are shown. From this data, a ratio of n1∅1, to n2∅2 was calculated and is depicted in table 6. The data show that for flow unit 1, n1∅1 the energy required for structural degradation of the floc was much higher than for flow unit 2, n2∅2. The energy density for each system was the product of the number of links, n1, times the energy of each individual link. Because of the interactions between particles to form, flocs and between flocs to form agglomerates are both thought to be by loop and tails, it was assumed that the energy, ∅1, for both flow system 1 and flow system 2 is similar. Given this assumption, the number of particle attachments was much larger for flow system 1 than for flow system 2. Recently the floc strength for the Interaction of PEO with kaollnite was shown to be 4.7 dynes/cm² c.s. area. This was a small floc strength when compared to a non-ionic polyacrylamide where the floc strength was 19.0 dynes/cm² c.s. area for the same system of polymer and kaolinite. This explains why flocs formed with PEO degrade more readily than flocs formed with polyacrylamide.
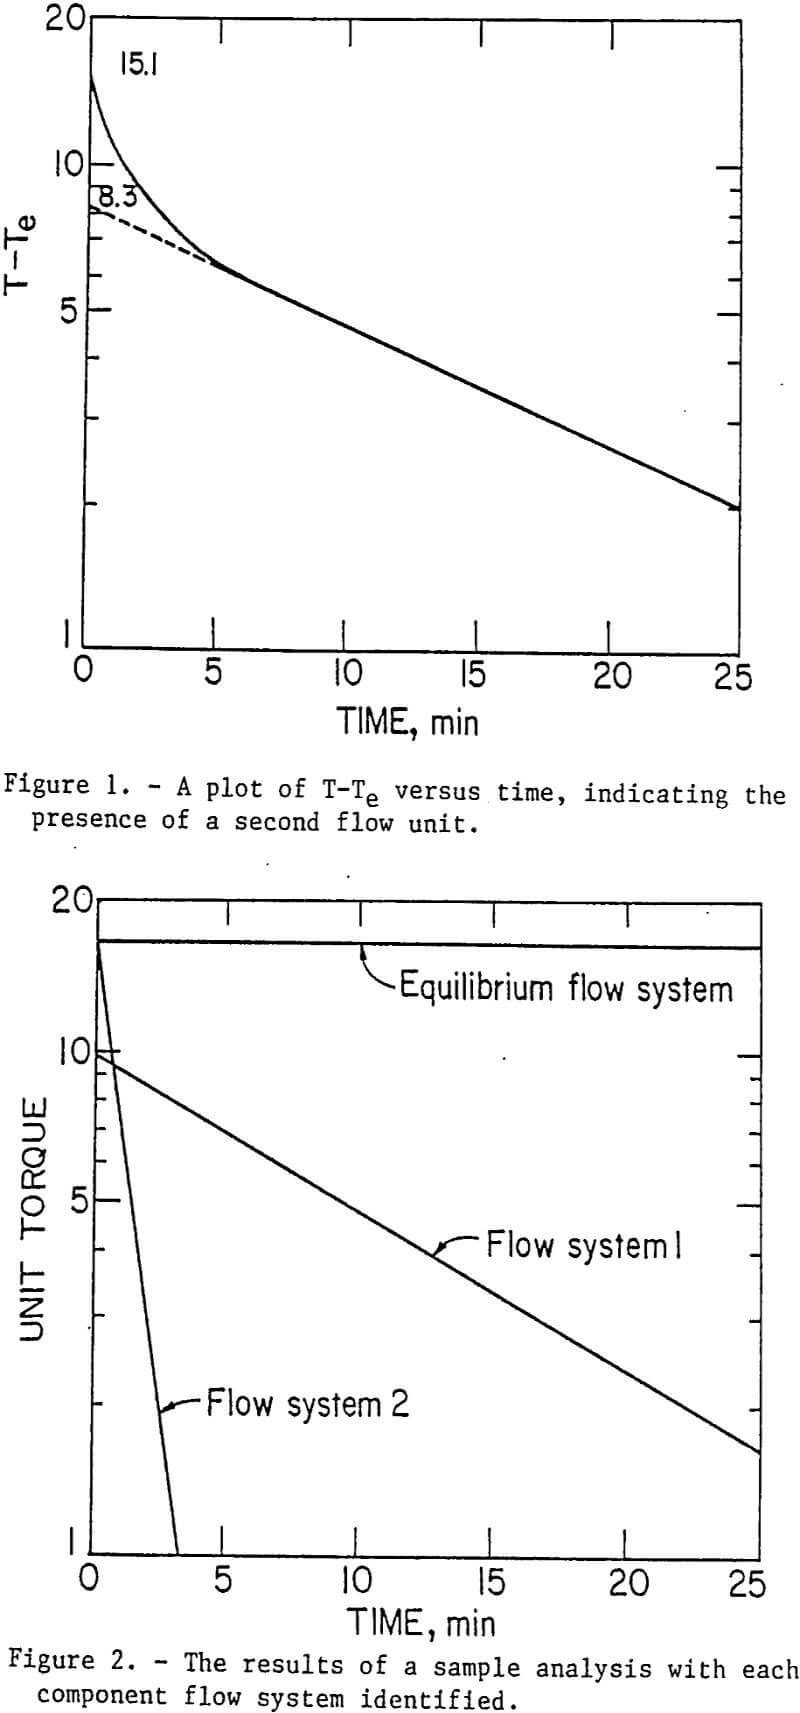
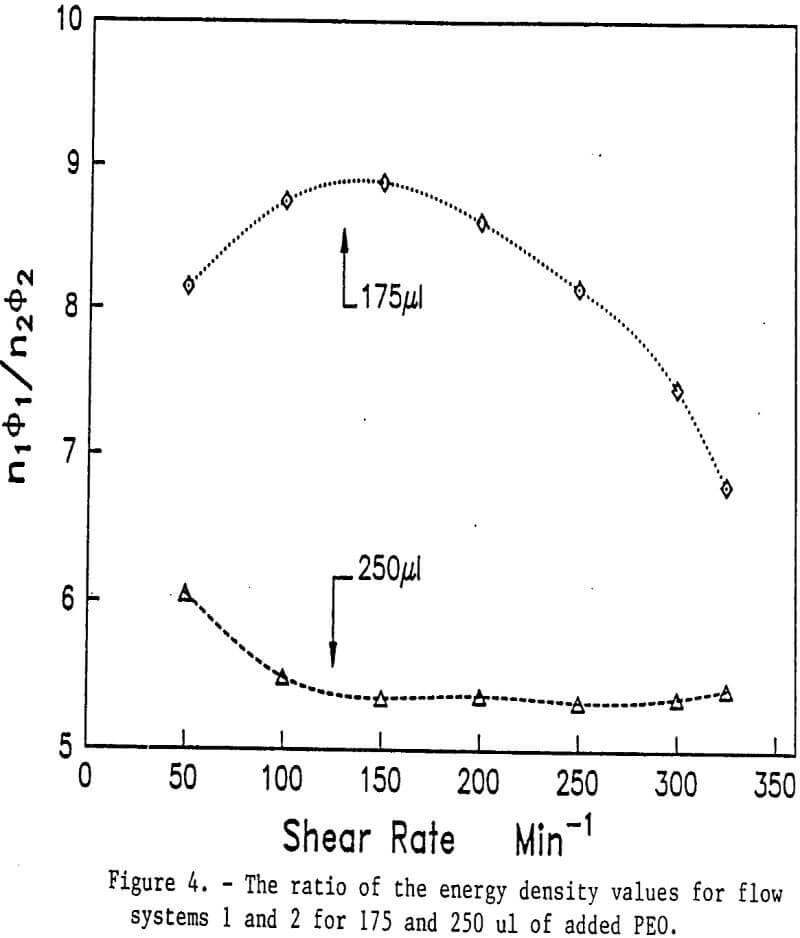
The effect of turbulent forces (shear) or the flocculation and dewatering of calcium montmorillonite has been studied. Results indicated that optimum flocculation was dependent on the energy input in the form of agitation to the system, the amount of polymer used, and the concentration of polymer added. The breakage of flocs also shows similar characteristics. Figures 3 and 4 show the ratio of n1∅1, to n2∅2 plotted versus the shear rate for various dosages of PEO.
The data show that as the PEO dosage was increased the general trend was for the ratio of n1∅1, to n2∅2 to decrease, which meant that the term was increasing relative to the term n2∅2. Physically this meant that there were more bonds formed that bridge large flocs- together in agglomerates; therefore, the large agglomerates required more energy to be broken into smaller flocs. Other observations showed that as the PEO dosage goes from 50 to 200 µl, other effects were also taking place. For example, at a dosage of 100 µl, the ratio of n1∅1 to n2∅2 decreased linearly as the shear increased. This indicated that the energy density n2∅2 was increasing with increased shear within the range measured. If we assume that ∅1, and ∅2 are similar as previously discussed, then the number of links n2 was increasing. This observed behavior would be similar to what was observed during shear flocculation. A similar argument can be made for the series where 50 µl of PEO are used.
When the PEO dosage was increased to 250 µl, the ratio of to remained constant at shear rates from 100 to 350 min-¹. At this higher dosage the system in terms of bond breaking and bond formation appears to be in equilibrium. A similar phenomenon has been reported for polyacrylamides. In the series where the dosage of PEO was 175 µl, the observed behavior falls between shear flocculation and the equilibrium situation found at the highest dosage of 200 µl of PEO.
Concluding Comments from The Bureau of Mines, U.S. Department of the Interior
The use of rheology is a powerful tool in obtaining insight into the flocculation mechanism. The modified Tattersall equation has been used to confirm that in the flocculation of calcium montmorillonite with PEO, two types of bond systems were operating: (1) the formation of small flocs and (2) the agglomeration of small flocs into larger ones. The use of the equation has also allowed interpretation of the data in terms of the number of attachments involved in the bridging of particles and flocs together. The data also show that the flocculation sequence is complex, and depending on the shear and amount of polymer added, the mechanism by which flocculation takes place may change, with one type taking precedence over the other, as can be seen by differences shown in figures 3 and 4.