
Table of Contents
The relationship between the grinding power consumption and the product size distribution has been widely studied since it is a subject of major interest for plant design and optimization.
The conventional approaches, generally of empirical nature, have led to the formation of equations such as Bond’s, which has been used in sizing most of the rod and ball mills currently in operation.
Modern approaches, of a phenomenological nature, treat the subject on the basis of mathematical modeling of the process. They have not yet received wide application in plant design because of their complexity.
A common characteristic of the conventional approaches is the representation of feed and product size distributions by a single parameter, normally the D80 passing size.
Without intending to treat the subject exhaustively, it is suggested that rather than the D80, which provides information about the coarser part of the size distribution curve, the grinding power consumption is more closely related with the amount of ultrafine particles produced (probably in the order of a few microns in size).
These ultrafine particles are represented as the percent passing the finest screen using conventional sieve analysis.
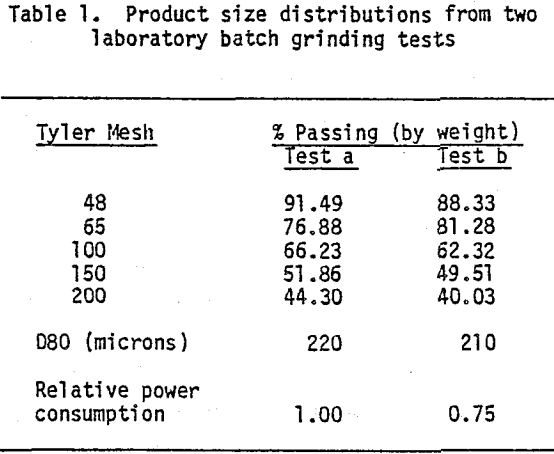
The data given in Tables 1 and 2 support the previous hypothesis.
Table 1 presents the results of two laboratory batch grinding tests, both performed at the same conditions (mill type, ball charge, pulp percent solids, feed size, etc.) except for the total grinding times.
It can be observed that, in spite of the lower power consumption, the product D80 of test b is slightly finer than that of test a.
The difference is to be found in the ultrafines production. The content of minus 200 mesh material is higher in test a.
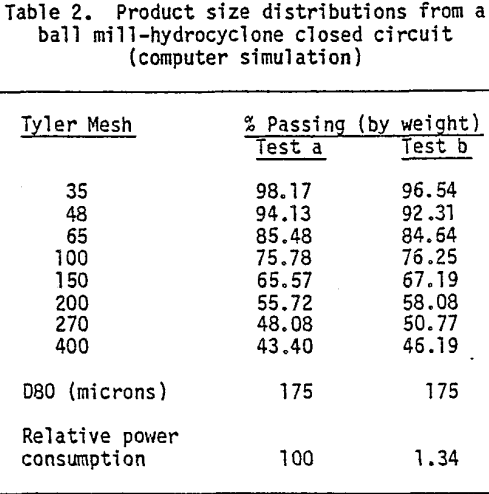
Table 2 presents two grinding product size distributions with the same D80 passing sizes, obtained through mathematical modeling and computer simulation of a ball mill hydrocyclone closed circuit operated at very different percent solids in cyclone overflow.
This method has proven to accurately predict the performance of the secondary ball mill circuit at the plant, under normal operating conditions (Figure 1).
As in Table 1 a small difference in the amount of ultrafines produced leads to a strong effect in grinding power consumption.
An indirect consequence of this analysis is the observation that Bond‘s approach, based on feed and product D80 passing sizes, is probably a good estimate for grinding power consumption only in the particular cases. For example, when a rod mill is operated in open circuit or a ball mill is operated in closed circuit with classifier (under normal conditions of circulating load) in which the shape of the feed and products size distribution curves are similar.
Ultrafines Production and Size Reduction Mechanisms in Autogenous Grinding
The main causes of overgrinding and, as a consequence, high power consumption are the following:
- a) Classification inefficiencies (short-circuiting of fines).
This phenomenon is the same as that which produced the differences between tests a and b in Table 1. - b) High residence time of the pulp inside the mill and its relationship with the feed rate and circulating load.
- c) Grinding mechanisms themselves.
In autogenous grinding, size reduction is produced by the combined effect of at least three different mechanisms, each of which is associated with specific product characteristics and hence specific power consumptions:
Fracture – Fracture is produced when the kinetic energy of a particle is transformed by impact into fracturing of itself and/or other particles. This effect occurs mainly in coarse material and does not produce too many fine particles.
Attrition – Attrition is the breakage of particles through pressure exerted by others. This effect can also be assumed as “efficient” in terms of resulting product size distributions and power consumptions. Attrition occurs in medium to small size particles.
Abrasion or Surface Wear – Abrasion or surface wear is produced by the superficial rubbing of particles, leading to an extremely fine product and consequently high power consumption and low grinding capacity.
Abrasive overgrinding, a frequent problem in fully autogenous mills, can be easily recognized by the build-up of coarse material (2 to 6 inch) with rounded shapes and smooth surfaces in the mill.
Two methods have been tried to solve the problem of critical size material build-up:
- a) Addition of small amounts of steel balls to the mill.
Due to obtaining a coarser product and a higher weight of the mill charge, the semi-autogenous grinding usually results in lower power consumption and, if the mill structure and the drive system make it possible, a higher power draw.
As an example, in the plant the power consumption dropped from 25 to 13 kw- hr/mt and the power draw increased from about 5500 to the mill design figure of 7000 hp. The mill throughput also increased significantly.
- b) Installation of a crusher in the fully autogenous grinding circuit.
The critical size pebbles, taken out of the mill through openings in the discharge grate, are crushed and recycled to the circuit.
Ultrafines production and power consumption decrease while power drawn by the mill remains constant.
Although the normal practice is to recycle the crushed pebbles to the autogenous mill, it can be anticipated that the effect would be similar if they were sent to another grinding circuit.
Pebble Crusher in Semi Autogenous Grinding
As previously mentioned, the addition of balls to the cascade mill strongly improved the performance of the grinding circuit. However, simple visual inspection of the mill charge indicated that the critical size problem did not disappear. It was only partially controlled.
Over-grinding persisted, the result being that the total grinding power consumption was 20% higher than that of the old conventional grinding plant.
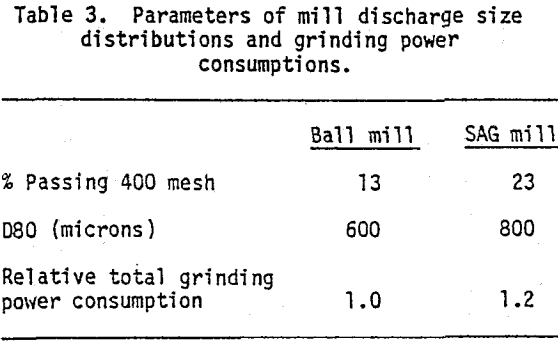
Table 3 presents typical operating data showing the main differences (as far as the grinding performance is concerned) between the two plants.
The minus 400 mesh fraction is significantly higher in the SAG mill discharge and, since the classification efficiency was similar in both grinding plants, it has to be attributed to abrasive overgrinding.
Semi autogenous Grinding with Pebble Crusher
Given those circumstances it was proposed to study the installation of a pebble crusher in order to increase SAG plant capacity by improving the control of ultrafines production and simultaneously taking advantage of an operation at high power draw.
A pilot and industrial test program, the main results of which are shown below, was undertaken with ore currently being mined.
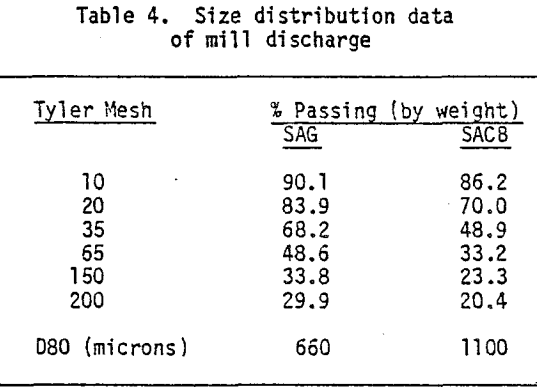
Table 4 presents typical size distributions of the minus ½ in. fraction of the mill discharge (corresponding to the trommel undersize) obtained in pilot tests for two different cases:
- a) Semi autogenous grinding in closed circuit with cyclones. No pebble ports in the grates (SAG circuit).
- b) Semi autogenous grinding in which the pebble fraction of mill discharge (+½ in.) is taken out through pebble ports for separate crushing and ball milling. The minus ½ in. fraction of mill discharge is recycled to the SAG mill through a classifier. The circuit is called SACB: Semi autogenous/ Crusher/Ball mill.
In both cases a 7% ball charge volume was used in the mill.
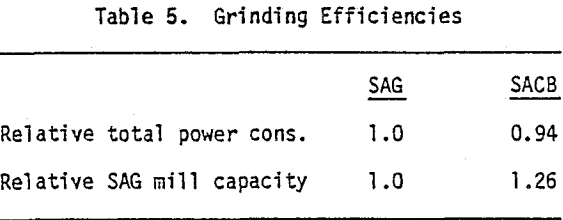
Table 5 shows the total relative power consumption and the relative capacity of the SAG mill itself for the same tests referred to in Table 4.
The first figure includes a conservative estimate of crushing and ball milling power consumption in SACB circuit.
Pebble removal decreases the abrasive over-grinding as reflected in the mill discharge size distributions (Table 4). Total grinding power consumption decreases and SAG mill capacity increases significantly.
Later tests, with other types of ore, have shown lesser differences between those size distributions. However, the effects on power consumption and mill capacity have been the same, confirming the strong effect of small variations in the ultrafines production.
An interesting trend observed in the pilot test results, is that from a power consumption point of view, the optimum circuit for the ore probably is fully autogenous grinding with pebble crushing. However, due to the different power drawn by the mill, grinding capacity is higher in semi autogenous operation.
It is clear that the effect of pebble removal depends on the amount of pebbles taken out of the SAG mill and that this amount depends on how many pebble ports are opened in the discharge grates. The best result is achieved by maximizing the number of pebble ports which at the same time maximizes the pebble flow rate.
Testing has shown that, if the pebble flow rate is expressed as a fraction of the fresh feed to circuit one, the largest amount of pebbles that can be produced in the mill is accurately simulated with four to five pebble ports in the pilot unit. Consequently, four openings were used in the latter.
Finally, several industrial tests were carried out rejecting pebbles from the grinding circuit.
Since the number of pebble ports was variable and lower than the maximum, the results could not be directly compared with those presented in Tables 4 and 5.
A parameter, R, which relates the SAG mill throughput increase and the pebble flow rate was defined to make possible this comparison. Throughput increase is defined as the difference between SACB and SAB circuit throughputs.
R = throughput increase/pebble flow rate
This factor, ranging from 1.1 to 1.2 in the pilot tests and from 1.0 to 1.5 in the industrial tests, shows that the results of the first tests can be directly applied to the full scale plant with acceptable accuracy.
Design of the Pebble Crusher Installation
Operation of the original semi autogenous grinding circuit at the plant (Figure 1) has shown that the two small ball mills were not being used efficiently.
Totaling 1300 installed hp, they increased the capacity of the basic SAG single stage circuit by only 40 mtph, thus leading to an incremental power consumption of almost 25 kw-hr/mt, which compares unfavorably with the 13 kw-hr/mt average figure.
Under those circumstances, the installation of a pebble crusher also presented the possibility of solving the above mentioned problem. That was the reason why in the testing program the crushed pebbles were supposed to feed separate ball mills instead of being recycled to the SAG.
The main problem to be solved in the design of a pebble crusher for a semi autogenous grinding circuit is the steel removal from the crusher feed.
The worn-out and broken steel balls, broken steel liners, etc. which are continuously discharged by the mill have to be removed with 100% efficiency prior to the crusher.
The problem was analyzed by a leading company in magnetic separation equipment which reported that this target was attainable by installing the magnetic separation system described below.
The magnetic separation system consists of the existing self-cleaning electromagnet installed above conveyor belt No. 5, a magnetic head pulley for conveyor No. 5, self-cleaning electromagnet over conveyor No. 6 and a permanent magnet above the vibrating screen located just upstream to the crusher feed.
This vibrating screen, made of stainless steel to prevent interference with the magnet installed above it, has the following functions:
- a) Decreases the content of fines and moisture in the crusher feed to avoid packing and crusher jams.
- b) Spreads the material in a thin layer which, combined with the vibrating effect, maximizes the efficiency of the last stage of magnetic separation.
The screen undersize is returned to the primary mill to avoid mud spills inside the plant, especially on electric equipment such as the SAG mill motors.
This design allows for addition of extra magnetic separators and eventually metal detector systems electrically interlocked with the movable feed gate to the screen (or crusher). In case metal objects are detected, they can be diverted directly back to the SAG mill.
The designed grinding circuit, including the pebble crusher, is shown in Figure 2.
Conveyor belt No. 6 (second section of the existing coarse material recycling conveying system) was extended to reach sufficient height to feed the pebble crusher, (a 5½ ft. Symons short head available from an old crushing plant).
Crusher product is sent to the existing ball mills by means of conveyor belt A but, as an alternative, it can be fed to the SAG mill. In that case the ball mills are fed with a fraction of the SAG mill discharge, as in the original circuit (Figure 1).
The designed grinding circuit was provided with flexibility by means of a series of movable gates to allow diversion and control of material flow rates:
- Vibrating screen feed – On/off gate to make possible a direct bypass to the SAG mill.
- Screen discharge (crusher feed) – Continuous regulation capability gate to allow control of crusher feed flow rate.
- Crusher discharge – On/off gate to allow sending the crusher discharge to either the secondary mills or the SAG mill.
- Secondary mill feed – Continuous regulation capability gate to allow controlled distribution of feed between the two ball mills.
Finally, if the amount of critical size material removed from the mill is less than the crusher and secondary mills capacities, those mills can also be fed with a small fraction of the SAG mill trommel undersize in order to take full advantage of their installed power.
 |
 |
 |
 |
 |
|
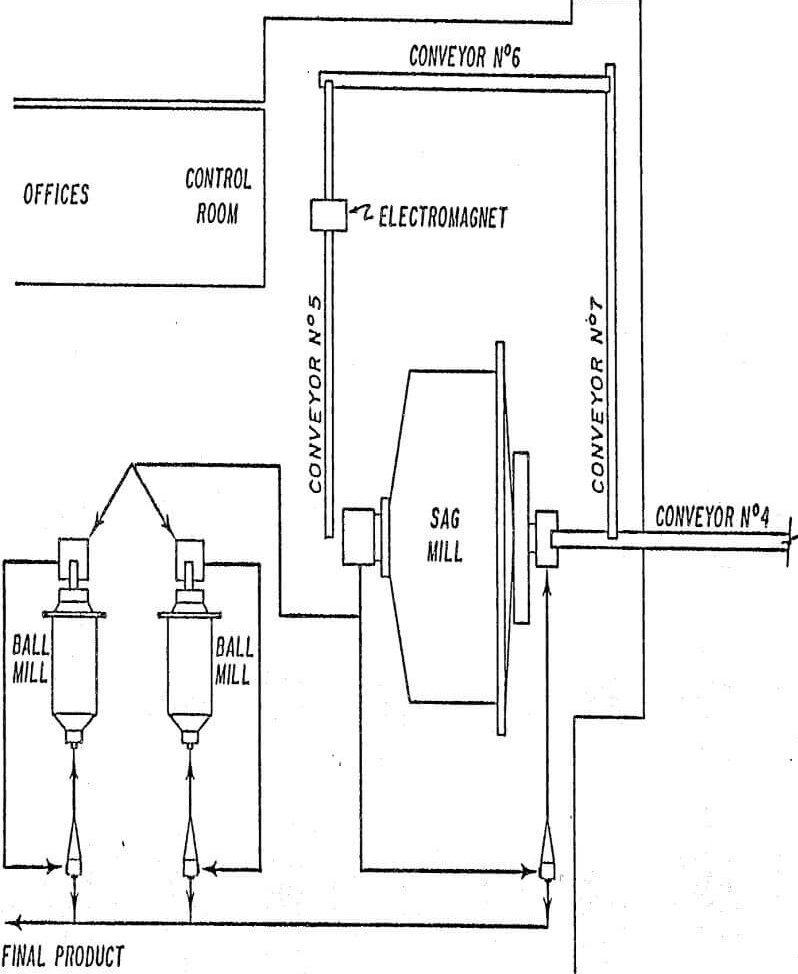
FIG 1 |
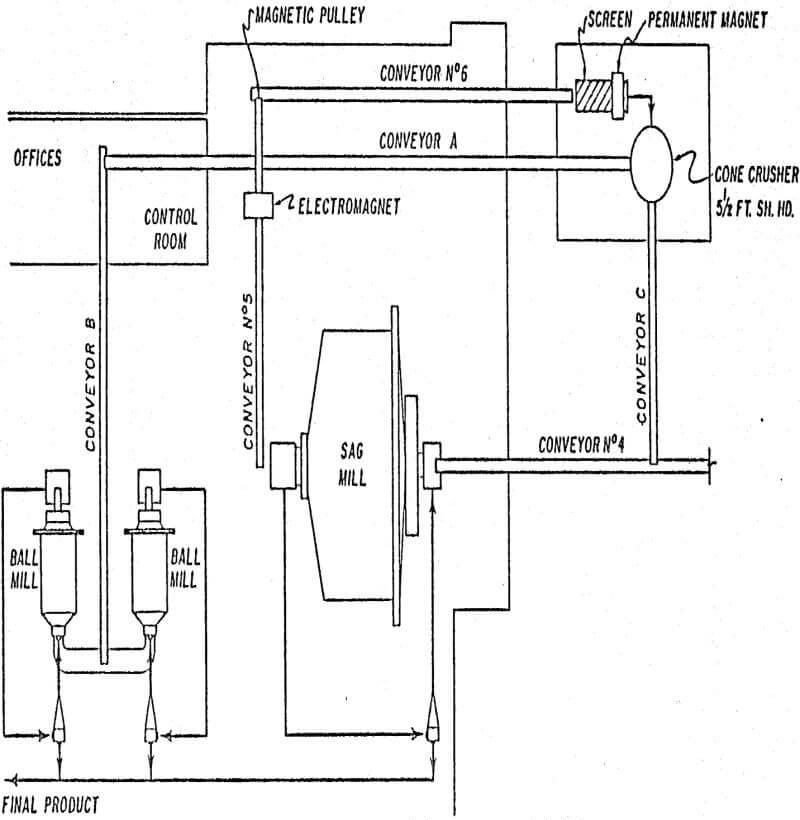
FIG 2 |