Table of Contents
Researchers at the Bureau of Mines, U.S. Department of the Interior, developed and tested equipment to measure corrosion rates on a commercial-scale mill. Bench-scale experiments were also designed for duplicating ore grinding conditions closely enough that realistic rate determinations can be made in laboratory tests. Rates measured in a laboratory system compared favorably with those measured in the field. Cast steel was found to have corrosion rates in a copper mill and laboratory test cell of 22 and 21 mpy, respectively. Corrosion was found to account for less than 5 pct of the total grinding media wear in the operations studied.
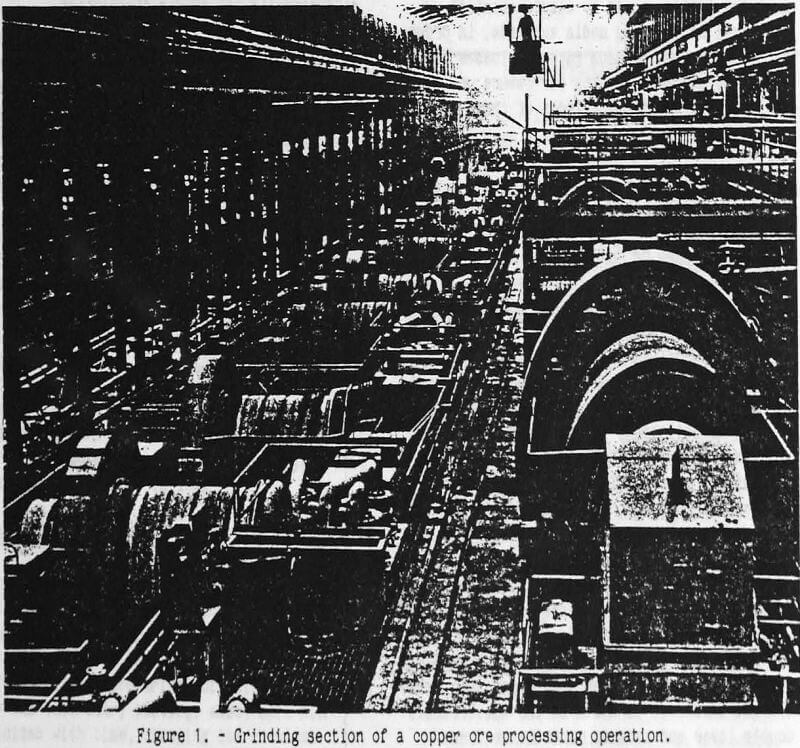
Ore grinding is a major cost operation for the mineral processing Industry. Dodd and Dunn (1983) reported that the U.S. mining industry consumes more than 400,000 tons of grinding rods, balls, and mill liners in wet grinding operations at an annual cost of $300 million, a significant portion of the milling cost. A section of a commercial ore grinding operation is shown in Figure 1. This section consists of 13 rod mills and 26 ball mills, which are on the left of the picture. Each ball mill weighs more than 150 tons and processes 35 tons of ore per hour, containing approximately 1,000 lb of copper, consuming approximately 95 lb of grinding balls during that time.
Several wear mechanisms act upon the grinding media. Including corrosion, abrasion, and impact. The interactions between these wear mechanisms are poorly understood, and much disagreement exists in the technical literature. To determine the extent to which corrosion contributes to total wear in Industrial grinding mills, the Bureau entered into cooperative agreements with two mining companies to install Bureau-designed electrochemical instrumentation on ore grinding mills to make corrosion rate measurements. Knowledge of the importance of corrosion in grinding media may allow for changes in mill operation. For example, if corrosion rates are low, conditions of increased salt concentrations and decreased pH may be used. If corrosion rates are high, the use of corrosion-resistant alloy may be cost effective.
A second objective of this research effort was to design a laboratory test cell that simulates the conditions inside an operating ball mill. Use of this type of cell would allow the effects of changes in milling conditions such as pulp pH, oxygen content, minerals, and salt content to be quickly evaluated and would eliminate the need for expensive and time-consuming corrosion testing in production mills.
Results of laboratory studies made by different investigators have not led to consistent conclusions regarding the relative importance of corrosion in grinding media losses. Hoey, Dingley, and Freeman used corrosion inhibitors to reduce total ball wear in a laboratory-size ball up to 49 pct while grinding sulfide ore. Remark and Wick (1975) used theoretical electrochemical considerations to conclude that corrosion accounts for 40 to 90 pct of total wear in sulfide ore grinding and that galvanic couples between grinding media and minerals present. In the ore account for a major portion of the corrosive wear. On the other hand, Tolley used laboratory electrochemical testing to measure corrosion rates of grinding media and concluded that corrosion accounts for less than 5 pct of total wear. Dodd, Hulatt, and Norman compared laboratory corrosion rates and wear rates from Industrial mills and concluded that corrosion plays a small role in wear at basic pH values.
Dodd and Dunn (1983) stated that mechanical wear is higher in production mills than in laboratory mills, while corrosive wear remains constant, resulting in corrosion being a larger component of wear in laboratory mills than in production mills. Nass reported that doubling the hardness of grinding rods cuts the total wear by about 50 pct while grinding magnetic taconite ore. Moroz used marked-ball wear tests to conclude that grinding media microstructure is the dominant factor in controlling wear resistance and that when comparing tempered martensite microstructures, hardness is a good indicator of wear resistance.
Pitt and Chang and Singleton reported that the total wear rate of grinding media is greater than the sum of the abrasive wear rates and the corrosive wear rate. Postlewaite, Tinker, and Hawrylak found a similar phenomenon in slurry pipelines and attributed it to erosion-corrosion. Moroz suggested a synergistic effect by which corrosion pitting weakens the surrounding matrix of the grinding media, increasing the amount of spalling that occurs.
In view of the above findings, Bureau researchers investigated methods to determine material losses caused by electrochemical reactions at grinding media surfaces, in order to determine the minimum rates of losses due to corrosion and provide data for future use in evaluating synergistic effects of chemical and mechanical phenomena.
Corrosion Rate Determinations by Laboratory Tests
Electrochemistry Of Corrosion
Metallic corrosion reactions in aqueous solutions are electrochemical in nature. Corrosion reactions can be expressed as a sum of two half reactions, one representing a cathodic, or reduction, reaction, and one representing an anodic, or oxidation, reaction. When a metal specimen and the electrolyte with which it is in contact are electrically isolated from any external circuit, no net current will flow between the two media, and the currents associated with the anodic and cathodic half reactions must be equal in magnitude and opposite in direction. If the driving force for one reaction to occur is greater than that for the other at an electrically neutral surface, a charge will accumulate at the interface. This charged interface is known as the electrical double layer and acts to inhibit the first reaction and enhance the second so that the rates become equal. The electrical double layer is equivalent to a potential, known as the open circuit potential, applied to the specimen.
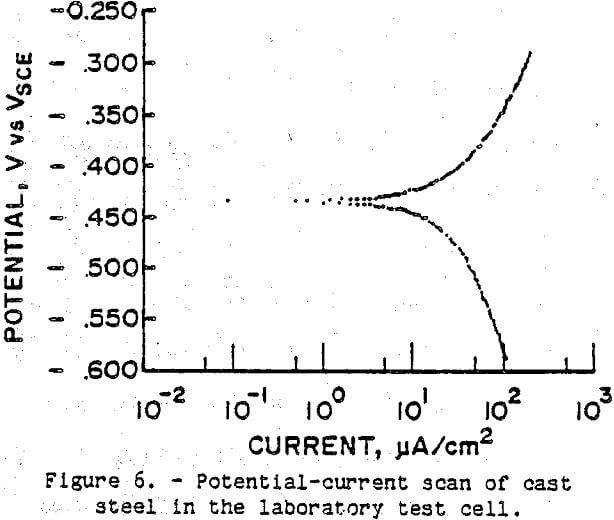
Information regarding the nature of the reaction occurring at the metal surface can be obtained by applying a potential different from the open circuit potential and measuring the resulting current. Through use of a device known as a potentiostat, the surface potential of the specimen can be varied by applying a potential between the specimen and a current-carrying inert electrode that is suspended in the same electrolyte as the specimen. When the potential of a metal specimen is forced to a value more positive than that of the open circuit potential, the anodic reaction rate is increased, giving a positive current. A negative current results when the applied potential is less positive than the open circuit potential. The results are plotted as potential versus logarithm of current. Figure 2 is an Idealized plot. The lower, or cathodic, portion of the curve represents the reduction reactions, the reduction of elemental oxygen or hydrogen ions, for example. A low slope and a linear relationship in this portion of the curve indicate activation or chemical reaction control of the cathodic reaction rate; whereas a high slope and nonlinear relationship indicate that the reduction reaction is being controlled and retarded by another type of phenomenon, usually diffusion. The upper, or anodic, portion of the curve represents the oxidation reaction, primarily the dissolution of metal. A low slope in this portion of the curve indicates that the anodic reaction is activation controlled, whereas a vertical slope in this portion of the curve indicates that another phenomenon is controlling the anodic reaction rate, usually passivation or formation of a surface film or a diffusion-limited anodic dissolution.
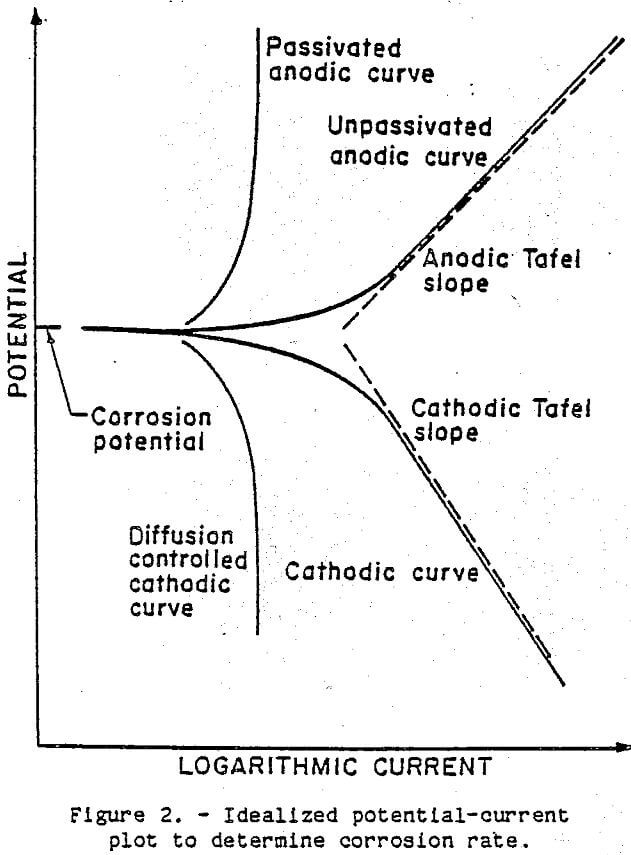
The slopes of the linear portions of the anodic and cathodic curves are known as the anodic and cathodic Tafel constants, respectively. The point at which the two slopes intersect is the point at which the anodic and cathodic currents are equal; their common value is the corrosion current. The corrosion current is converted to a corrosion rate, using Faraday’s constant and the density and equivalent weight of iron, assuming that iron oxidizes to the ferrous state.
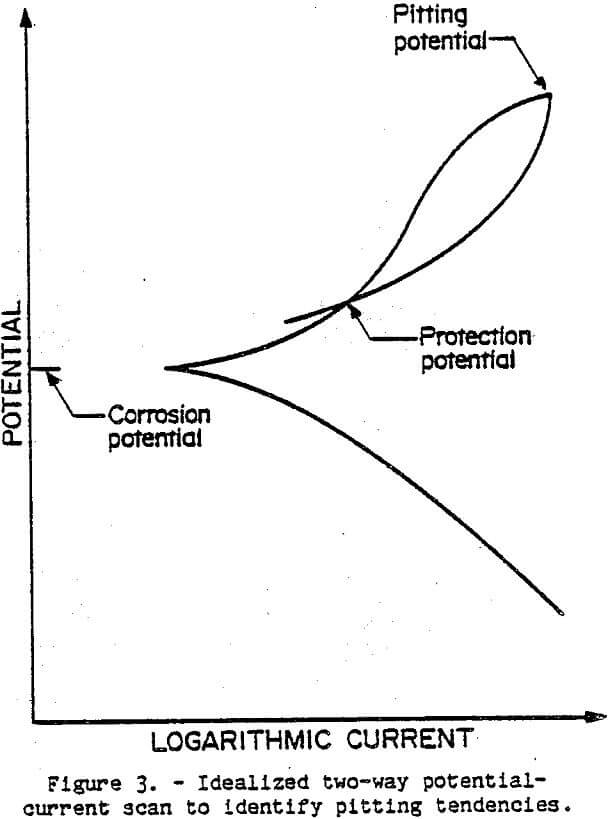
A phenomenon known as pitting corrosion takes place when an extremely high reaction rate occurs at highly localized places on the metal surface because of nonuniformity in the environment or microstructure of the alloy at those points. Corrosion pitting results in a higher rate of metal loss than would occur if surface conditions were uniform. The tendency of materials to undergo corrosion pitting can be evaluated electrochemically by scanning in the forward direction until pitting takes place, and then reversing the scan until the reverse scan crosses the forward scan. The point where the reverse scan crosses the forward scan is known as the protection potential. Figure 3 is an idealized scan that results when pitting occurs. Babion and ASTM stated that the protection potential (Eprot) is more positive than the corrosion potential (Ecorr), then pitting is not likely to occur. The pitting potential (Ec), also referred to as critical potential, has been used as a criterion to indicate pitting, but the protection potential is more reproducible and is now considered a more reliable indicator. The pitting potential is defined as the potential at which the current rapidly increases and above which pits will initiate and grow. Kruger conducted research that, indicates that protection potential is equal to pitting potential when pit initiation time is considered.
Classifications of pitting tendency have been developed (Tilman, et. al., 1985) baaed on the difference of the corrosion potential and the protection potential. The classifications follow: (1) If the protection potential is below the corrosion potential, the pitting tendency is high, (2) if the protection potential is above the corrosion potential, but within 100 mV of it, the pitting tendency is moderate, and (3) if the protection potential is more than 100 mV above the corrosion potential, the pitting tendency is low.
Laboratory Test Methods
Synthesis of Ore Slurry: Laboratory corrosion rate determinations were made using a slurry of simulated mill water and ground rod mill feed. Artificial slurry was used because of difficulties in procuring sufficient mill slurry for the laboratory testing; also, mill slurry oxidizes with time, changing its chemical composition.
A sample of the mill water from Magma Copper contained, in grams per liter, 034 Ca²+, 0.085 Cl-, 0.07 K+, 0.22 Na+, and 1.22 SO4²-. The pH of the sample was 8.45, and the conductivity was 2.45 mmho/cm. This mill water was simulated with a solution of, in grams per liter, 0.134 KCl, 0.04 NaCl, 0.6364 Na2SO4, and 0.5427 CaSO4·½H2O. The pH was adjusted to 8.45 with NaOH. The simulated mill water had a conductivity of 2.3 mmho/cm. Electrochemical corrosion rate tests made using the two waters gave virtually identical results.
A microscopic examination of the Magma Copper rod mill feed revealed that quartz, feldspar, clay minerals, chlorite, iron oxides, pyrite, and chalcopyrite were present. Hiskey and Shirts determined that various metals. Including iron, can act as reductants for chalcopyrite, and Isaacson (1985) determined that pyrite and magnetite are capable of increasing corrosion rates of grinding media. The chemical analysis indicated, in percent, 0.84 Cu, 2.80 Fe, 1.63 S, and 70.2 SiO2.
A sample of mill water from Pea Ridge contained, in grams per liter, 0.28 Ca²+, 0.25 Na+, 0.09 Mg²+, 0.02 K+, 0.88 SO4²-, 0-59 Cl-, and 0.014 F-. The sample had a pH of 7.0 and a conductivity of 2.8 mmho/cm. This mill water was simulated with a solution of, in grams per liter, 1.02 CaSO4·½H2O, 0.75 MgCl2 · 6H2O, 0.54 NaCl, 0.31 Na2SO4, and 0.07 KF-2H2O. The pH of the simulated mill water was adjusted to 7.0 with NaOH and H2SO4 and the conductivity was 2.8 mmho/cm.
A microscopic examination of an ore sample from Pea Ridge revealed magnetite, hematite, quartz, feldspar, diopside, hornblende, apatite, calcite, plagioclase, pyrite, and molybdenite. Isaacson (1985) showed that magnetite is capable of increasing the corrosion rate of grinding media at acidic pH values. The chemical analysis indicated, in percent, 60.0 Fe, 15.9 SiO2, and 0.73 S.
Simulation of Abrasive Conditions: A laboratory test cell (Fig. 1) was designed to simulate the chemical and mechanical conditions inside an operating mill. An ultrasonic probe was used to provide energy to actively abrade the metal surface by Increasing the force of particle impact on the metal surface. Alumina powder, which is electrochemically inert, was added to the stirred ore slurry to provide additional abrasive action. The ultrasonic probe was chosen because it provides equal abrasive action over the surface of the test specimen and has no mechanical parts, simplifying test operations. Testing in this cell showed an increase in corrosion rate as the ultrasonic power input was increased (Isaacson, 1985). Indicating that a protective layer of corrosion product was being abraded away from the test specimen.
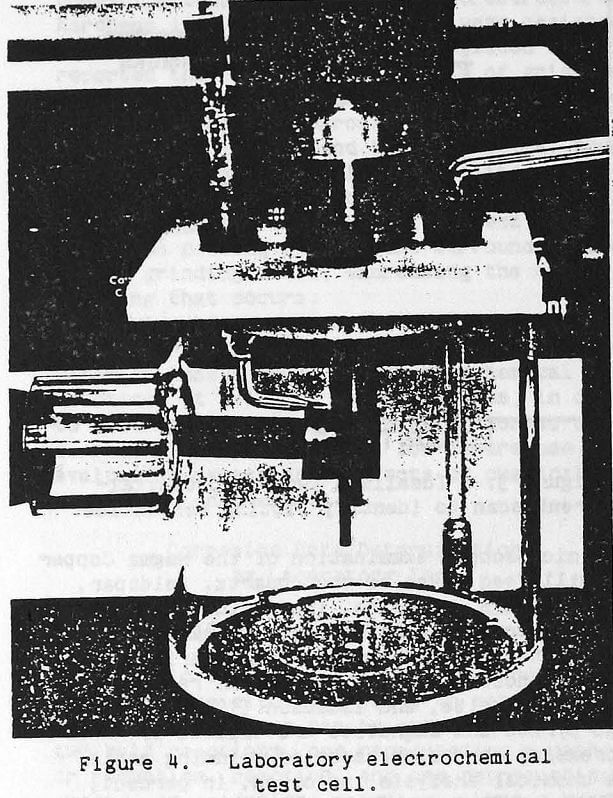
The test vessel (Fig. 4) consisted of a plastic cylinder 13 cm high and 13 cm in diameter. The test specimen, mounted on a stainless steel rod, was inserted in the side of the vessel. The stainless steel rod was insulated from the test solution by a length of latex tubing. A tapered glass tube containing a salt solution and the reference electrode was inserted through the top of the test vessel immediately above the test specimen. A graphite counter electrode was inserted on either side of the test specimen, and an air bubbler was placed immediately in front of it. A 300-W ultrasonic probe was mounted above the test vessel, with the tip of the probe above the test specimen.
The test specimens were provided by ARMCO Research and Technology. Five different alloys were provided in the form of 0.488-cm-diam rod. The alloys were (1) a cast steel containing 1 pct C and 0.5 pct Cr, (2) a wrought steel containing 0.85 pct C and 0.3 pct Cr, (3) a Ni-hard iron containing 3.5 pct C, 2 pct Cr, and 4 pct Ni, (4) a white cast iron containing 3 pct C and 12 pct Cr, and (5) a white cast iron containing 2.6 pct C and 27 pct Cr.
Working electrodes for the laboratory testing were out from the samples provided by ARMCO. A ¾-in long length of the electrode material was mounted in epoxy with one end exposed. Prior to testing, the test specimen was polished with 600-grlt emery cloth and lapped with 0.05 µm alumina.
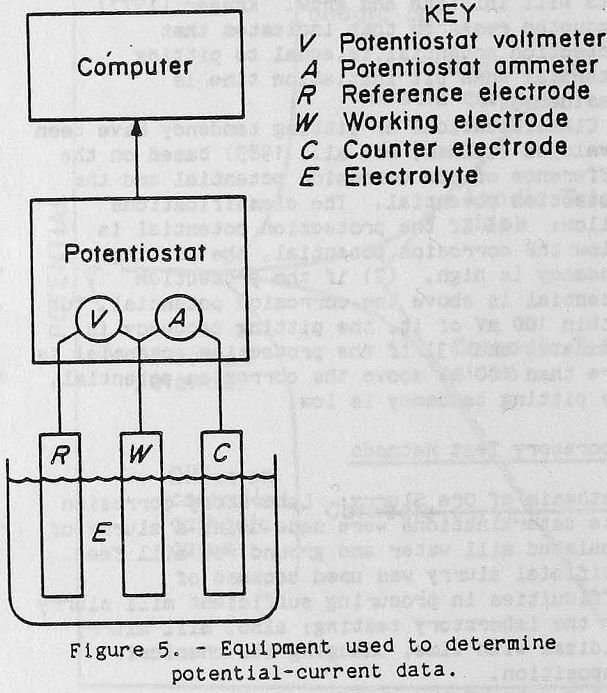
Determination of Potential-Current Data: Potential-current data were obtained in laboratory tests with use of a Princeton Applied Research (PAR) Model 350A Corrosion Measuring Console, which is a microprocessor-controlled scanning potentiostat that was designed specifically for use in corrosion research to make measurements of the type required for our investigations. Other equipment used was an Apple II+ personal computer, software developed by the Bureau, and the three-eleotrode system described previously. A simplified illustration of this equipment is shown in Figure 5. The potentiostat section of the PAR system applies a sequence of potential values between the metal specimen working electrode and the reference electrode and measures the voltage between those electrodes and also the resulting current flowing between the working electrode and the graphite counter electrode. A voltmeter and ammeter, as shown in Figure 5, are thus part of the potentiostat. The potential and current data are stored and processed by the computer.
Laboratory tests to determine corrosion rates were made in a 5-pct-solids slurry of rod mill feed in synthetic mill water. Air was bubbled through the test solution to maintain a constant oxygen concentration.
The testing to determine corrosion rates was performed by scanning from 150 mV below the open circuit potential to 150 mV above it at 0.5 mV/s. This is the same voltage range and scan rate used in the mill testing.
Pitting evaluation was also performed in a 5-pct-solids slurry of ground Magma rod mill feed, but the scan range was different for each material evaluated. In general, the material was scanned in the anodic direction from below the open circuit potential to a point above the critical potential .and then in the cathodic direction until the current again became cathodic. The difference between the corrosion potential and the protection potential was used to determine the pitting tendency, as explained, previously. The test specimen was microscopically examined, after testing to ensure that pitting took place.
Laboratory Teat Results
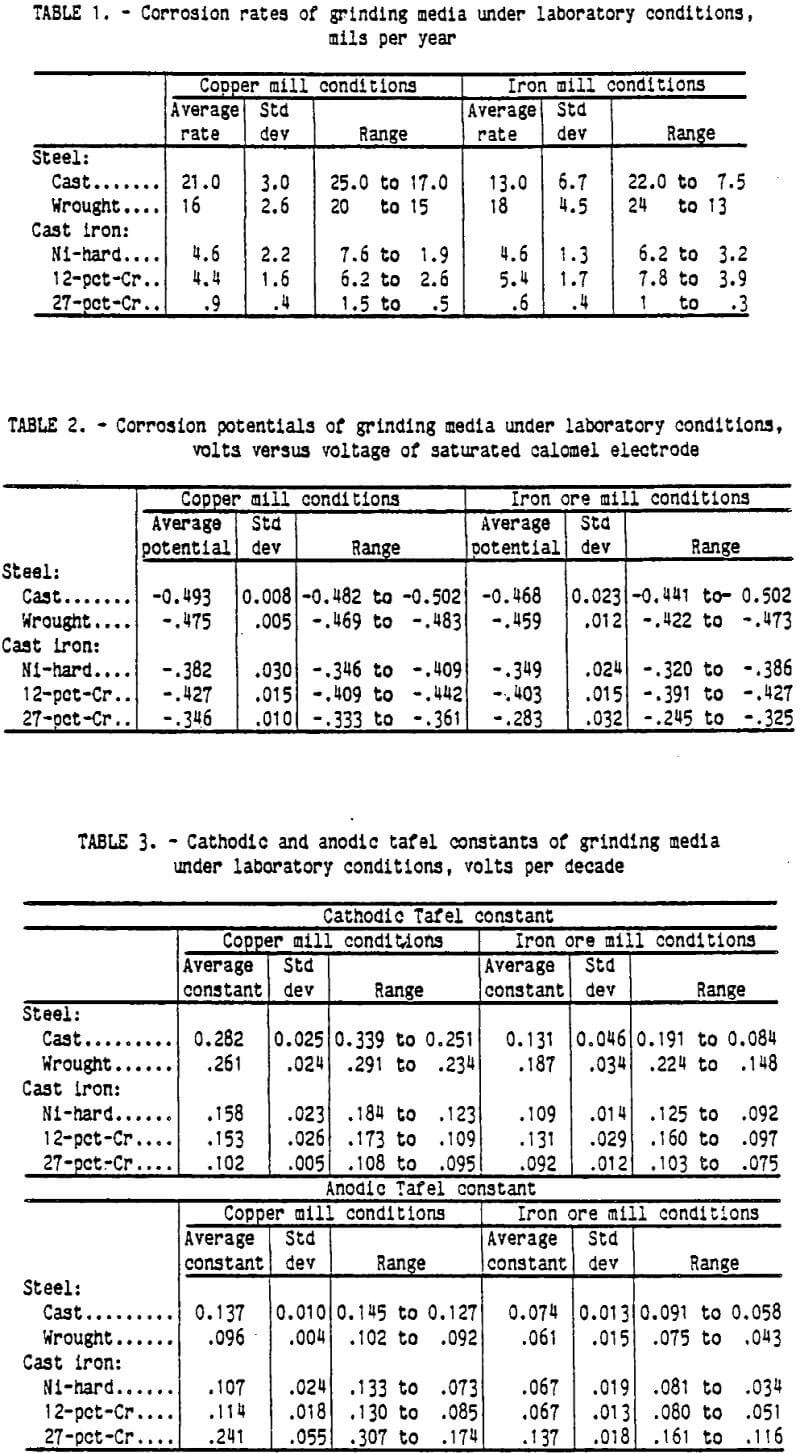
Corrosion rates obtained in the laboratory testing are given in Table 1. Figure 6 is a typical scan for the cast steel. The highest corrosion rate found was 25 mpy for cast steel in, conditions simulating those in a copper mill; the lowest was 0.3 mpy,for 27-pct-Cr white cast iron in conditions simulating those in an iron ore mill. The type of mill environment did not significantly change the corrosion rate of a particular type of grinding medium. For example, in conditions simulating those in a copper mill, the cast steel had an average corrosion rate and standard deviation of 21 and 3.0 mpy, respectively, with a high rate of 25 mpy and a low of 17 mpy; in conditions simulating those in an iron ore mill, the cast steel had an average rate and standard deviation of .13 and 6.7 mpy, respectively, with a high rate of 22 mpy and a low of 7.5 mpy.
The corrosion rate did have a significant dependency on the type of grinding medium being tested. In conditions simulating those in a copper mill, the cast steel had a corrosion rate and standard deviation of 21 and 3.0 mpy, respectively, compared with 0.9 and 0.4 mpy, respectively, for 27-pct-Cr cast iron.
The corrosion potentials of the test specimens followed the same pattern under conditions simulating copper, and iron milling. The cast steel had the most active potential in both instances, with the 27-pct-Cr alloy being the most noble. The average potentials and standard deviations are given in Table 2.
The cast steel, wrought steel, Ni-Hard cast iron, and 12-pct-Cr cast iron all had cathodic Tafel constants greater than the anodic Tafel constants, indicating that the reaction rate is controlled by the cathodic half reaction, which is probably the reduction of oxygen under the test conditions. The 27-pct-Cr cast iron had an anodic Tafel constant greater than the cathodic Tafel constant under both conditions, indicating that the corrosion reaction is controlled by the anodic half reaction or the dissolution of metal. The cathodic Tafel constants were slightly higher in the testing simulating a copper mill than in the testing simulating an iron ore mill, indicating that the cathodic reaction proceeds more slowly in the conditions simulating a copper mill. The anodic Tafel constants were also higher in the testing simulating a copper mill, indicating a more tenacious surface film formed- at the higher pH values found in the copper mill. The cathodlc and anodic Tafel constants for this testing are given in Table 3.
Corrosion Rate Measurements in a Copper Ore Mill
Magma Copper Co. operates an underground mine approximately 50 miles north of Tucson, AZ. The mine has 221 million tons of proven reserves of 0.72 pot Cu. The ore is milled using conventional grinding and flotation. Reverberatory furnaces and Pierce-Smith converters are used to smelt the concentrate, and electrolytic refining is used. Byproducts of the mine are molybdenite from the flotation circuit, gold and silver from electrolytic slimes, and sulfuric acid from smelter offgases (McGraw-Hill, 1985) The deposit and processing are typical of large Southwestern U.S. copper operations.
Equipment Design
Testing was done in a nominally 10-ft by 10-ft Marcy Mine and Smelter Supply ball mill (Fig. 7) rotated at a speed of 18.7 rpm. The cast iron liner is held inside the mill with a system of bolts with flared ends. The bolts are 9 in long and 1½ in in diameter. The ends of the bolts are flared to 3 in in one direction. The flared ends fit inside the liner, and the threaded ends extend outside the mill, where they are secured with nuts. The face liners are secured with two circles of 16 bolts each at radii of 2 ft 10 in and 4 ft 8 in.
Electrode Assemblies: The electrodes were mounted in the ends of the mill liner bolts (Fig. 8) on the outer circle of bolts holding the face liner In place. One bolt was used per electrode system, for a total of five bolts. The end of the bolt was extended so it would be flush with the Inside of the mill. The flared end was hollowed out on a milling machine, and a hole was drilled the length of the bolt to run electrical connections.
Figure 9 is a schematic of the electrodes mounted in the hollow bolt. The test specimens provided by ARMCO were used as working electrodes, 1/8-in-diam graphite rods were used as counter electrodes, and a calomel cell with a salt bridge was used as a reference electrode. One end of the working and counter electrodes was plated with copper, and wires were soldered onto the electrodes for electrical contact. The wires were run up the hole drilled the length of
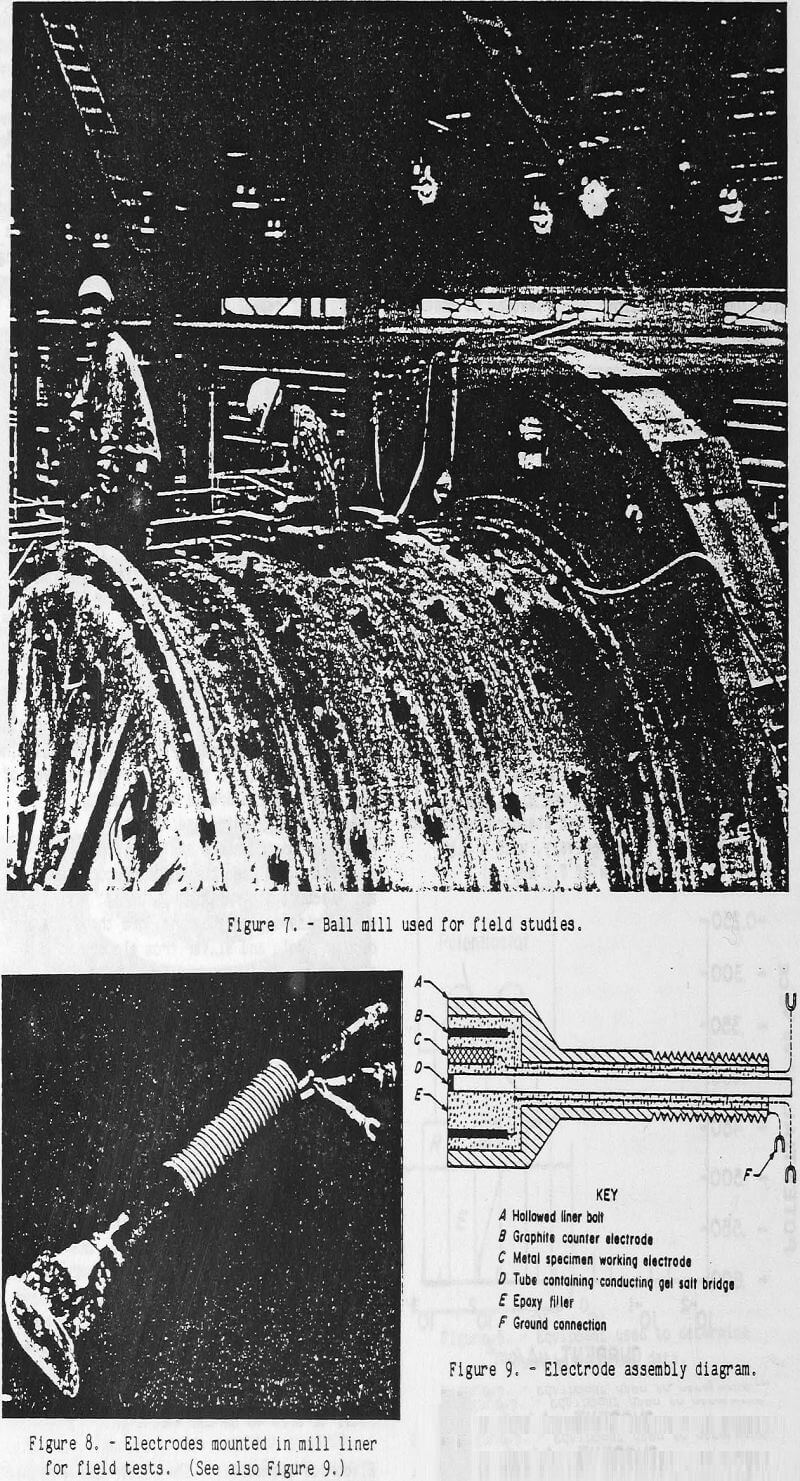
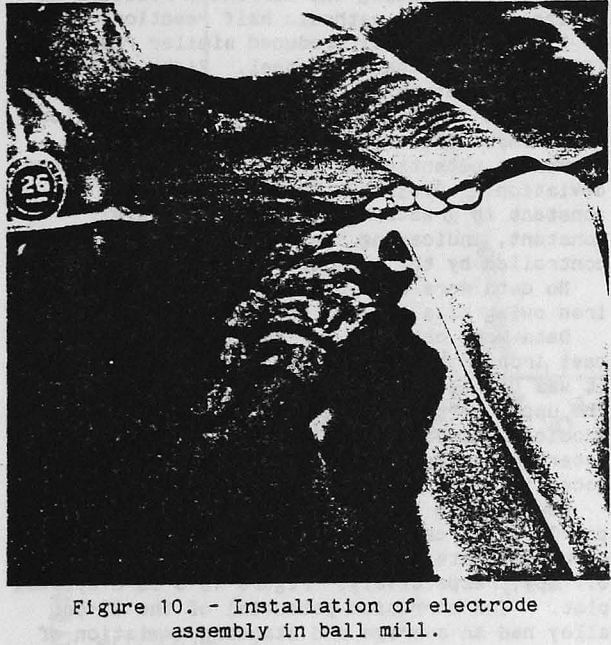
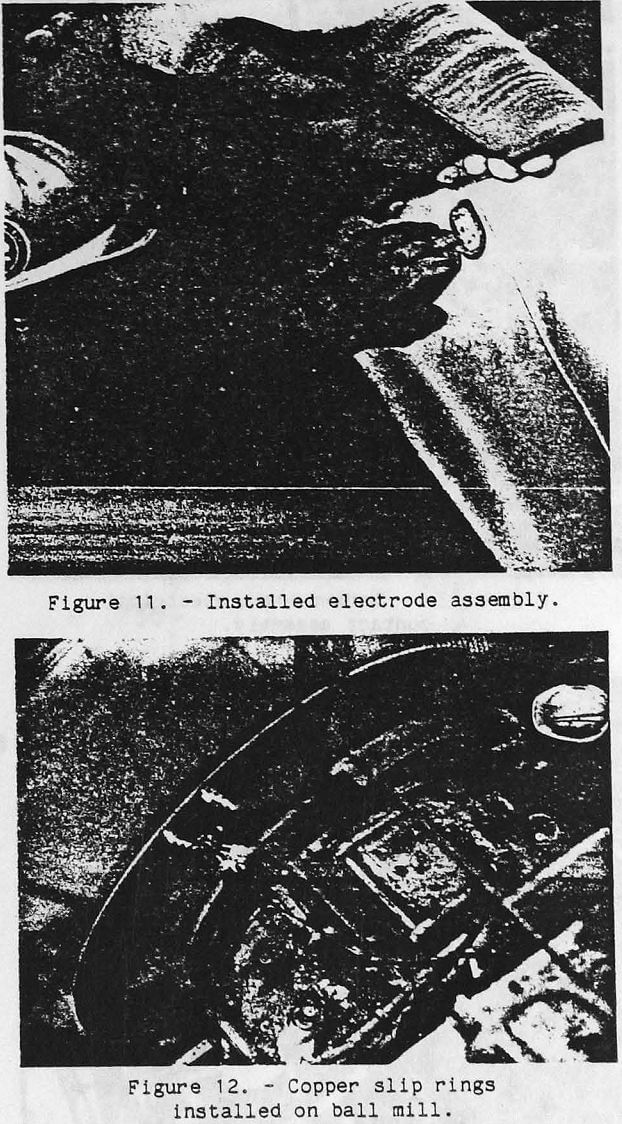
the bolt. The calomel reference electrode was mounted on the outside of the mill, and a length of latex tubing, which contained a salt bridge, was run down the center of the bolt. The salt bridge consisted of 4 pct Agar gelled with a 3.5M solution of KCl. A wick was also run the length of the latex tubing to aid in maintaining conductivity. A piece of fritted glass was fitted in the end of the latex tubing to prevent loss of the salt bridge and to reduce contamination from the mill solution. The working electrode and the end of the salt bridge were mounted in the center of the flared end of the bolt, with a counter electrode on either side of the working electrode. The electrodes were sealed in the bolt with epoxy. The electrode systems were mounted in the mill from the inside (Fig. 10) so they were flush with the inside of the mill surface (Fig. 11).
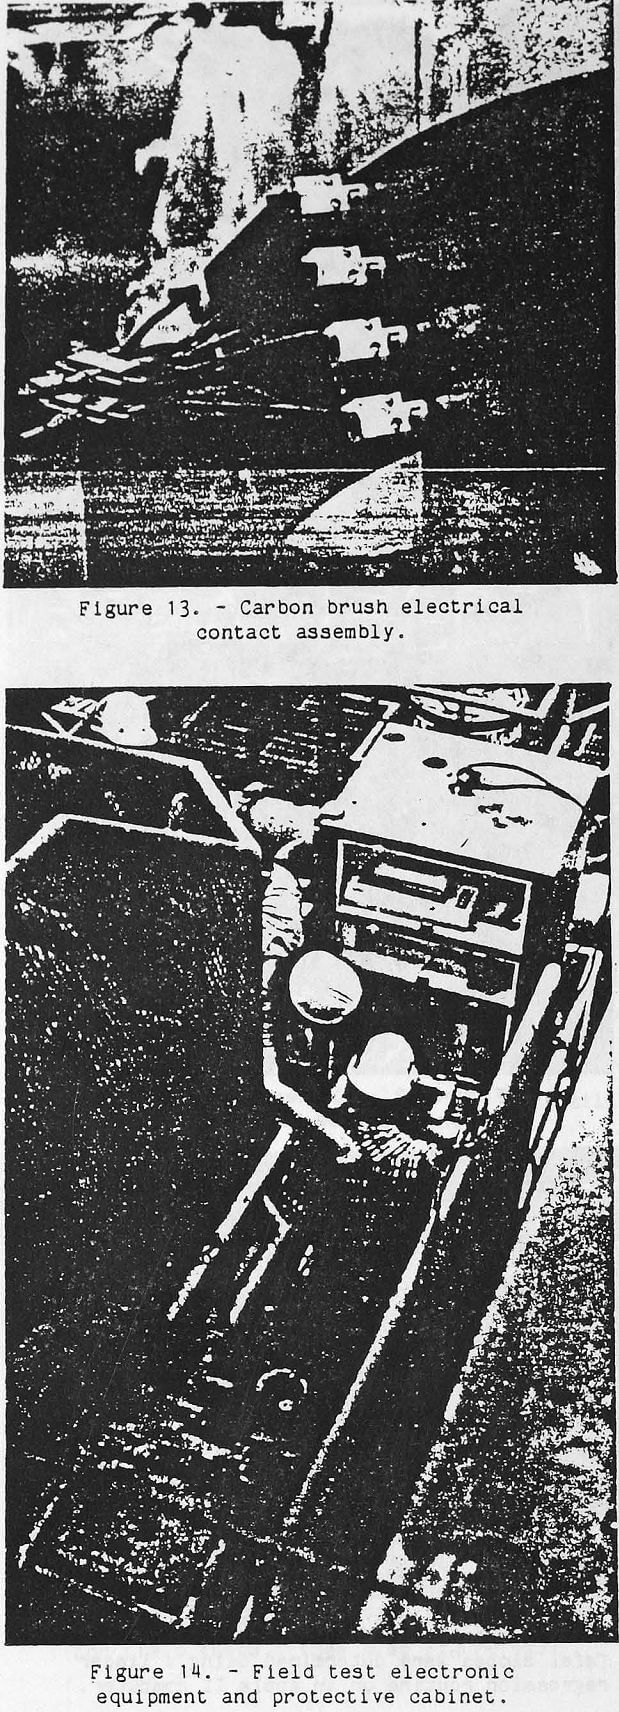
Wiring System: Electrical contact between the electrodes rotating In the mill and the stationary test equipment was made through a system of copper slip rings and electrical brushes (Fig. 12). Four 1½-in-wide concentric copper rings were laminated onto an aluminum backing plate, with ½ in of space between each of the copper rings. The backing plate had an inside diameter of 6 ft and an outside diameter of 7 ft 3 in. The copper rings were insulated from the aluminum by a 1/16-in- thick layer of fiber-reinforced phenolic resin. The aluminum ring had eight mounting brackets offset by 2 in; each mounting bracket had 1 in of adjustment. The mounting brackets fit over the inner circle of mill liner bolts and were secured by an additional nut. Each of the three electrodes used one of the copper rings for contact. The fourth ring was used to ground the equipment. Two brushes (Fig. 13), 7 in apart, were used on each ring to prevent loss of data due to the brushes skipping. The brushes were spring-loaded, silver-impregnated graphite and were manufactured by Pine Instrument. All electrical contacts other than the rings were made through shielded coaxial cable.
Potentiostat-Computer for Making Potential-Current Scans: Corrosion testing at Magma Copper Co. was performed with a Princeton model 273 potentiostat controlled by an Apple II computer via Princeton model 332 corrosion software. This allowed data to be stored on a computer disk for future processing. The equipment was housed in a cabinet next to the mill for protection from water and dust, as shown in Figure 14.
Testing was done by scanning from 150 mV below the open circuit potential to 150 mV above it at 0.5 mV/s.
The corrosion current was determined from the point of intersection of the cathodlc and anodic Tafel slopes. The exposed area of the working electrodes, used in determining the current density, was measured after the testing was completed. The data were smoothed by taking a running average of every 15 data points, and Tafel slopes were determined using a linear regression routine on an Apple II computer.
Copper Mill Test Results
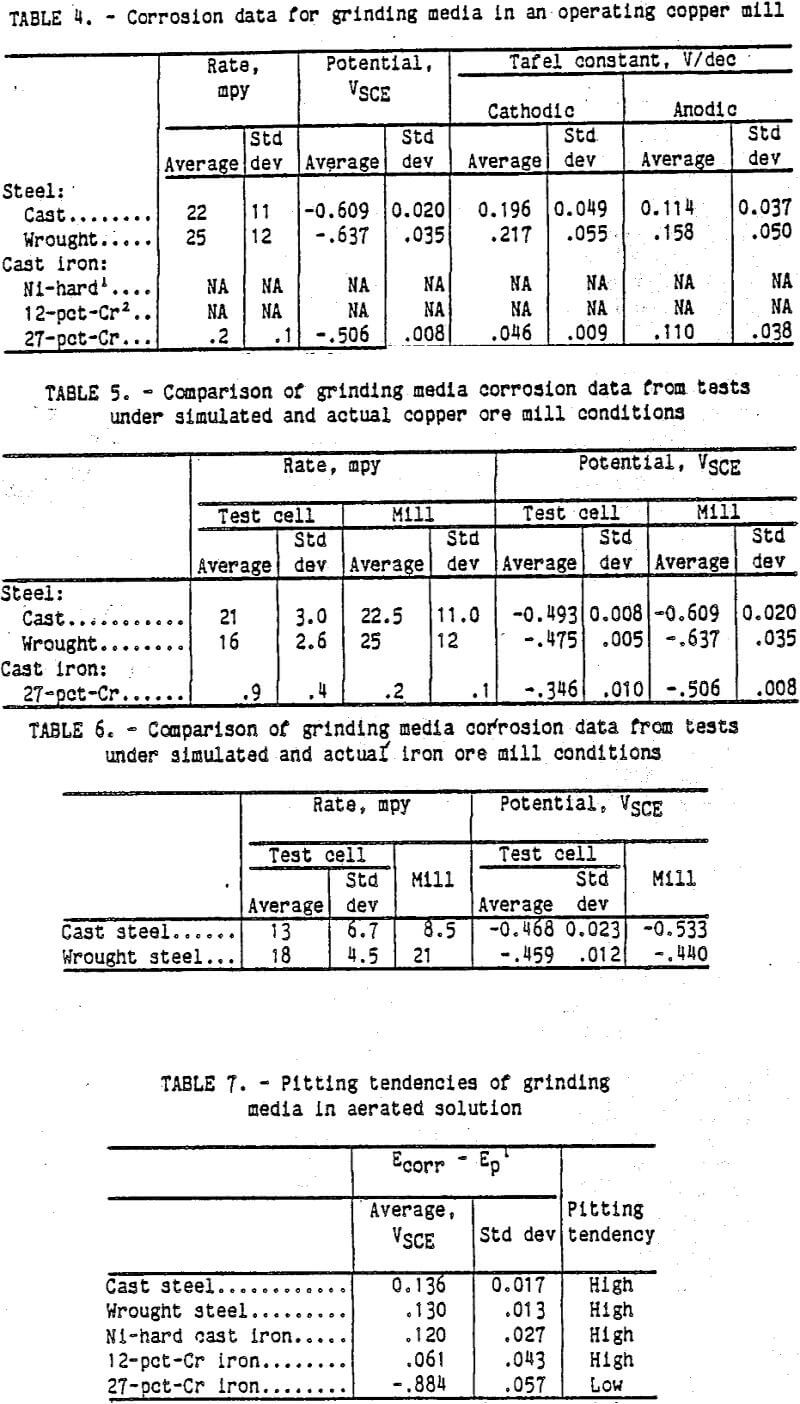
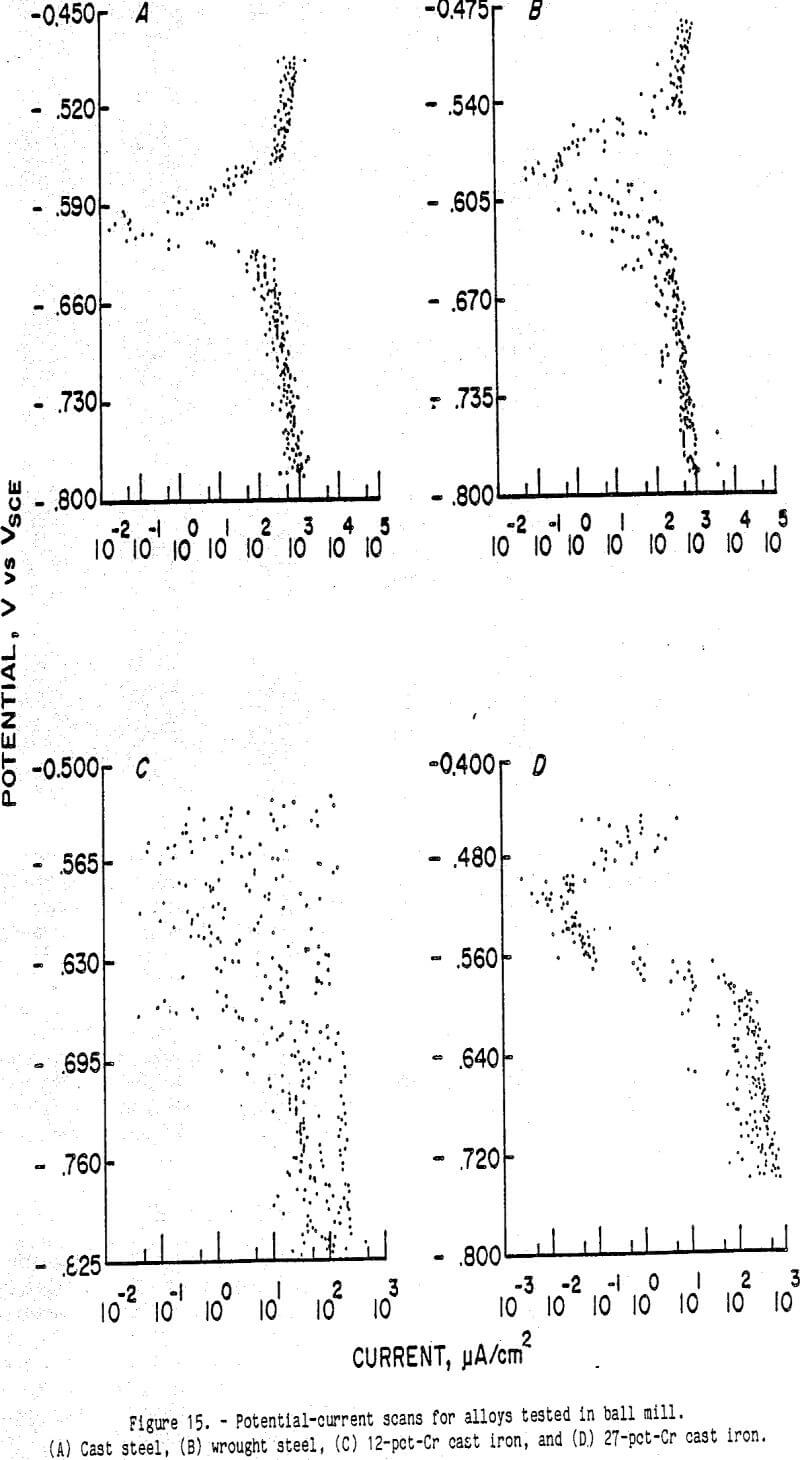
The corrosion data from measurements in a copper ere mill are given In Table 4. Figure 15-A is a typical scan on the cast steel. There is some scatter of about one order of magnitude of current density, but the shape is that of a typical corrosion curve. Ten usable tests were obtained using the cast steel electrode. The average corrosion rate is 22 mpy with a standard deviation of 11 mpy. The cast steel had an average corrosion potential of -0.609 V with a standard deviation of 0.020. The cathodic Tafel constant Is greater than the anodic Tafel constant, indicating the corrosion reaction is controlled by the cathodic half reaction.
The wrought steel produced similar results (Fig. 15-B) to the cast steel. Eight usable tests were obtained. These corrosion rates have an average of 25 mpy with a standard deviation of 12 mpy. The wrought steel had an average corrosion potential of -0.637 V with a standard deviation of 0.035 V. The cathodic Tafel constant is greater than the anodic Tafel constant, indicating the corrosion reaction is controlled by the cathodic half reaction.
No data were obtained for the Ni-Hard cast Iron owing to a circuit discontinuity.
Data were obtained for the 12-pct-Cr white cast iron; however, the plot was so erratic that it was unintelligible, as shown In Figure 15-C. The upper portion of the plot has many cathodic- anodic transitions, making it impossible to determine an anodic Tafel slope or a corrosion potential.
Four usable tests were obtained using the 27- pct-Cr white cast iron, which had an average corrosion rate and standard deviation of 0.2 and 0.1 mpy,, respectively. Figure 15-D is a typical plot. The corrosion potential of the 27-pct alloy had an average and standard deviation of -0.506 and 0.008, respectively. The anodic Tafel constant is greater than the cathodic Tafel constant, indicating that the corrosion reaction is controlled by the anodic half reaction.
Comparison of Laboratory and Copper Ore Mill Tests
A comparison of test results is shown in Table 5. The laboratory testing resulted in an average corrosion rate and standard deviation of 21 and 3.0 mpy, respectively, for the cast steel. This Is statistically equal to the corrosion rate of 22 mpy found in the mill.
The wrought steel had an average corrosion rate and a standard deviation of 16 and 2.6 mpy in the laboratory test cell, which is statistically equal to the corrosion rate of 25 mpy and standard deviation of 12 mpy found in the mill.
The 27-pct-Cr white iron had an average corrosion rate of 0.9 mpy with a standard deviation of 0.4 mpy in the laboratory test cell at 5 pct solids. This is not equal to the corrosion rate of 0.2 mpy found in the mill. The differing electrochemical characteristics of the 27-pct-Cr cast iron test specimen and the cast iron mill liners and carbon steel grinding balls produce a galvanic effect between the test specimen and the more active mill liner and grinding balls (Shirts, et. al., 1974). This lowers the corrosion rate of the 27-pct-Cr test specimen in the mill to a point where it is not equal to the corrosion rate found in the test cell.
The cathodic Tafel slope for the cast steel is greater than the anodic Tafel slope in the testing done in both the mill and the laboratory test cell, indicating that in both situations the corrosion reaction is controlled by the cathodic half reaction.
The wrought steel had a greater cathodic Tafel constant than anodic Tafel constant in both the copper mill testing and the laboratory
testing designed to simulate it. This indicates that the corrosion reaction is controlled by the cathodic half reaction under both conditions.
The 27-pct-Cr cast iron had a greater anodic Tafel constant than cathodic Tafel constant in both the laboratory and copper mill testing. This indicates that the corrosion reaction is controlled by the dissolution of the metal in both instances.
The corrosion potentials obtained in the mill testing at Magma Copper Co. were consistently lower than the corrosion potentials determined in the laboratory testing. For example, the corrosion potential of the cast steel in the mill was -0.609 V as compared to -0.493 V in the laboratory testing.
The lower corrosion potentials found in the mill can be explained by the stress caused by the grinding balls striking the electrodes. Endo and Komal (1972) demonstrated a correlation between stress and corrosion potential and showed that stressing carbon steel through several thousand stress cycles is capable of decreasing the corrosion potential of carbon steel from about -0.450 to about -0.600 V. Dunn and Martin (1973) measured stress rates in operating ball mills of up to 1.75 x 10 6 Mpa/s caused by the grinding media impacting the shell liner.
A comparison of potential-currant scans for cast steel made in the laboratory (Fig. 6) and in the Magma ball mill (Fig. 15-A) shows that a significant amount of electrical noise is present in the ball mill scan. Possible sources, of this noise are (1) noise generated by the graphite brushes skipping on the ring and brush system, (2) impact of grinding media causing potential change due to a piezoelectric effect, (3) noise generated in the reference electrode, (4) rotation of the mill generating areas of different slurry resistance, and (5) the potentiostat operating out of range.
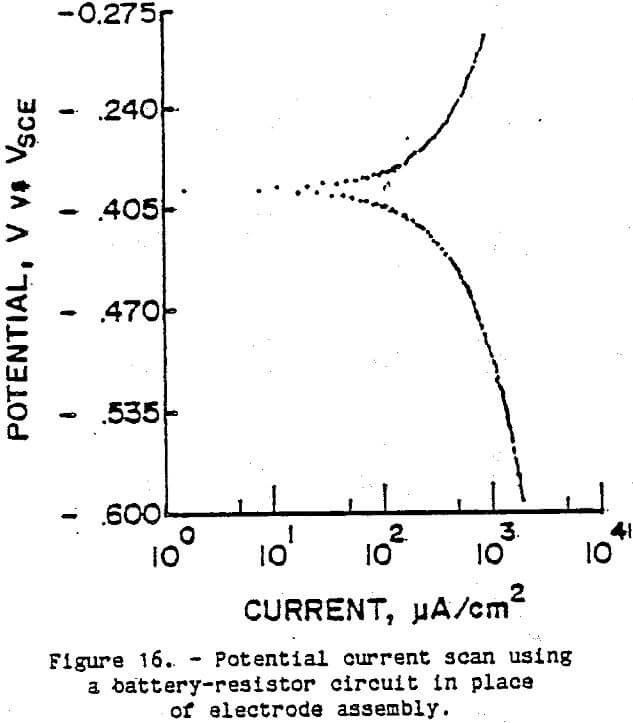
Figure 16 is a scan with the rings connected to a battery and resistor circuit instead of an electrode system. This supplies a steady signal and allows for examination for noise from the ring and brush system. The scan is smooth with no electrical noise, which indicates that the source of the noise is from the mill Itself as it rotates, and not from the ring and brush system.
The rotation of the electrodes with the mill causes them to pass through zones of differing slurry resistance and impact stress. At the top of the mill the coating of slurry may not be thick enough to supply sufficient electrical conductivity to allow testing. When this happens, the potentiostat increases the applied voltage in an attempt to drive current between the electrodes. When the electrodes again enter the more conductive slurry, the high voltage causes a current spike, resulting in electronic noise. Near the lower portion of Figure 15-B are several current spikes, indicating that this phenomenon was possibly occurring.
Advanced Field Test Equipment Design
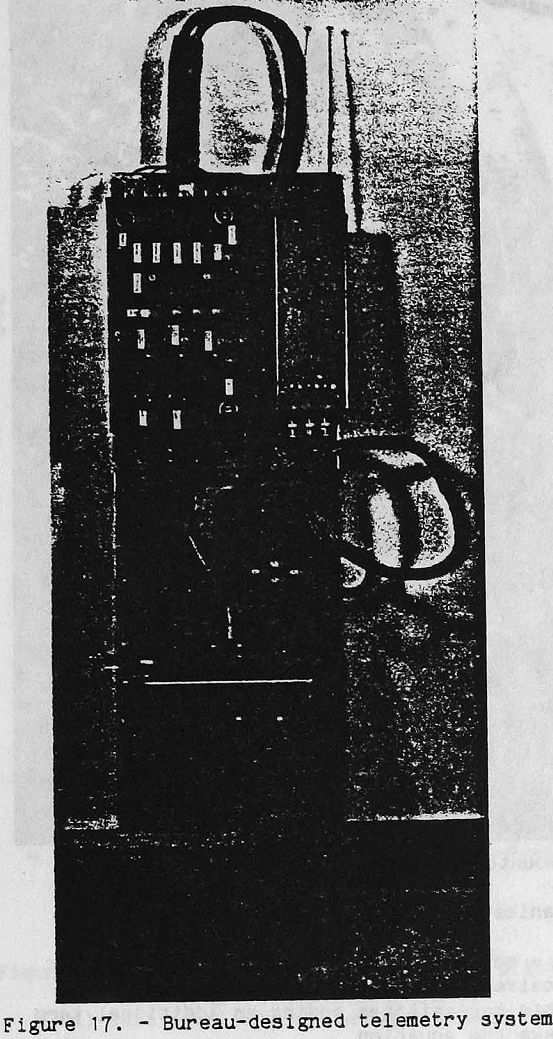
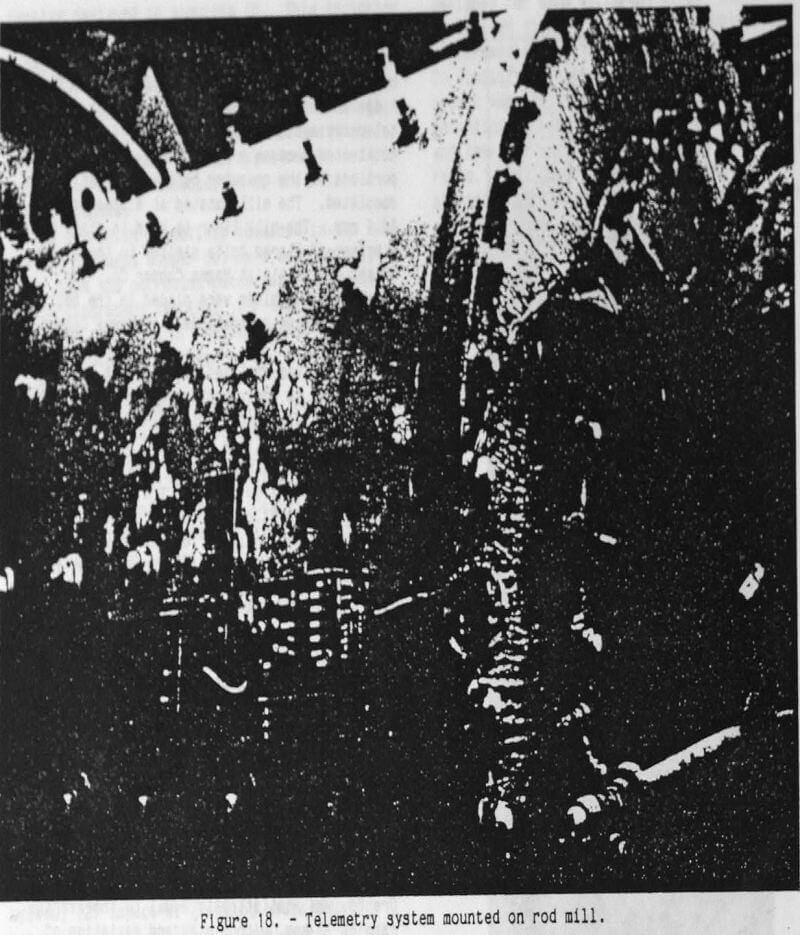
While providing adequate data, the copper ring system for mill testing requires several days to mount on a mill and must be custom designed for each different mill. The unshielded copper rings also are subject to electromagnetically induced electronic noise. To simplify in situ mill testing, a telemetry system was designed and built in which a potentiostat was mounted on the side of the mill and the data were transmitted to a receiver via radio. This paper briefly describes the operation of the system. More information is available (McDonough, 1988). Figure 17 is a photograph of the telemetry system.
Analog-Digital Conversion
The potentiostat associated with the telemetry system was mounted on the side of the mill (Fig. 18). The data obtained were transformed from analog to digital form prior to being transmitted. This technique eliminated electronic noise except for that induced in the wires from the electrode to the potentiostat, and this was greatly reduced by boosting the signal with an electrometer mounted next to the electrodes. The analog-to-digital conversion allowed a greater range of data values to be measured than would have been possible if analog data had been transmitted.
Radio Transmission of Data
The radio transmission of the data eliminated the need for copper contact rings and major portions of the wiring. Prior to transmission, the data were transformed from parallel to serial, or sequential, form. The data bits were then converted to radio frequencies and transmitted by FM radio to a receiver connected to a computer near the mill.
Data Reception and Processing
The received FM signal was relayed to an interface circuit, which translated the FM signal to digital form and made a serial-to-parallel conversion on the data. The data were then injected into the Apple computer in the form of an eight-bit word and then saved on floppy disk as machine language files.
Corrosion Rate Measurements in an Iron Ore Mill
Pea Ridge Iron Ore Co. is a subsidiary of St. Joe Minerals Corp. and operates the only U.S. underground iron ore mine, about 12 miles south of Sullivan, MO. The mine has 196 million tons of proved reserves of massive magnetite. The ore is concentrated using magnetic separation and flotation. The concentrate is agglomerated using vertical shaft furnaces. The final products are iron ore pellets, iron oxide powder, hematite, and pyrite (McGraw-Hill, 1985). The fluoride, 0.014 g/L, found in the mill water is not usually found in mill waters.
Corrosion rates of the cast steel and wrought steel alloys were measured in a nominally 9-ft by 14-ft Kennedy Van Saun rod mill at the Pea Ridge Iron Ore Co., using the Bureau-designed telemetry system. The other three alloys were not tested because a power surge damaged portions of the computer before the testing was completed. The mill rotated at a speed of 18.4 rpm. The mill liner is held in place with a system of flared bolts similar to those used in the ball mills at Magma Copper Co. The electrode assemblies were placed in the bolts in the same manner as those used at Magma Copper Co.
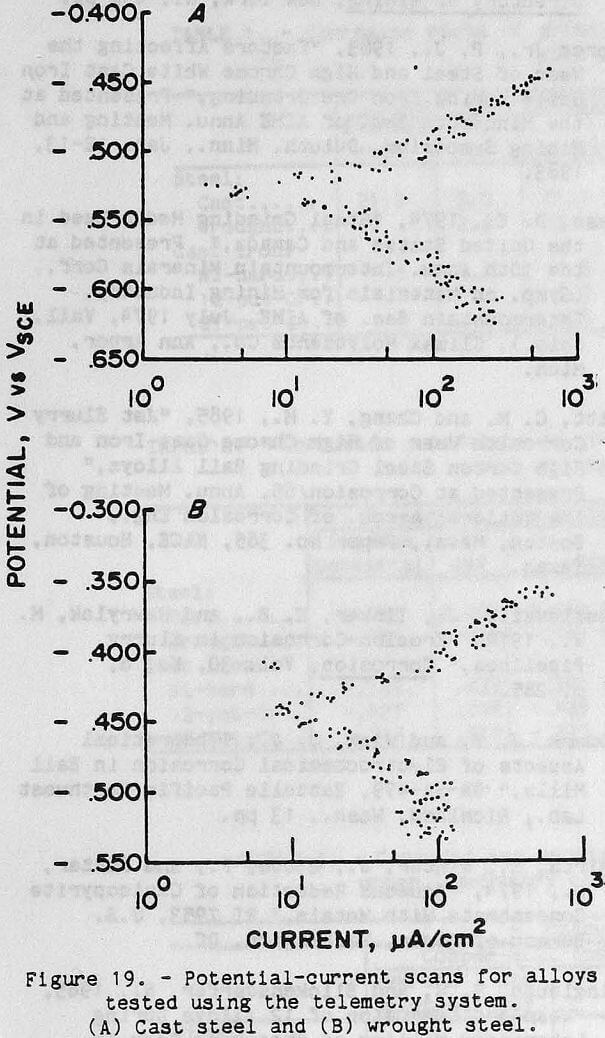
One test was analyzed for the cast steel. Figure 19-A is the potential-current plot from this test. The test resulted in a corrosion rate of 8.6 mpy with a corrosion potential of -0.533 V. The cathodic Tafel constant had a value of 0.066 V/decade, and the anodic Tafel constant had a value of 0.050 V/decade.
One test was analyzed for the wrought steel. Figure 19-B is the potential-current plot from this test. This test resulted in a corrosion rate of 21 mpy with a corrosion potential of -0.440 V. The cathodic Tafel constant had a value of 0.190 V/decade, and the anodic Tafel constant had a value of 0.067 V/decade.
Comparison of Laboratory and Iron Ore Mill Data
A comparison of the results in the iron ore mill and testing designed to simulate it is found in Table 6. The corrosion rate found for the cast steel in the rod mill at Pea Ridge Iron Ore Co. was statistically equal to the average rate of 13 mpy, with a standard deviation.of 6.7 mpy, which was found in the laboratory test cell.
The corrosion potential was significantly lower in the iron ore mill, -0.533 V versus -0.468 V, than in the laboratory testing. This is consistent with the results found In testing in the copper ore mill.
The cathodlc Tafel constant is greater than the anodic Tafel constant in both the mill testing and the laboratory testing, indicating that the corrosion reaction is controlled by the cathodic half reaction in both the mill and the laboratory test cell.
The corrosion rate found for the wrought steel in the rod mill at Pea Ridge Iron Ore Co. is statistically equal to the corrosion rate of 18 mpy, with a standard deviation of 4.5 mpy, which was found in the laboratory test cell. The corrosion potential of the wrought steel in the iron ore mill was statistically equal to the potential in the laboratory testing. The cathodic Tafel constant is higher than the anodic Tafel constant in both the laboratory and the mill testing, indicating that the corrosion reaction is controlled by the cathodic half reaction.
Discussion
The Magma Copper Co. initial ball charge is 50 pct 1.5-in-diam carbon steel balls and 50 pct 2.0-in-diam balls. The total grinding ball wear
rate is 1.13 lb/st of dry ore, and mill throughput is 85 st/h. This is equivalent to a linear penetration rate of about 2,600 mpy; therefore, corrosion is directly responsible for about 1 pct of the total grinding media wear at Magma Copper Co.
Pea Ridge Iron Ore Co. charges carbon steel grinding rods that are 3 in In diam and 13 ft in length. The total grinding rod wear rate is 0.9 lb/st of dry ore. This is equal to a linear penetration rate of 230 mpy; therefore, corrosion is directly responsible for about 4 pct of the total grinding media wear in the rod mills at Pea Ridge Iron Ore Co. The wear rates, in pounds per short ton, are not related to the linear penetration rates in the two mills in the same manner because the rods and balls have different volume-to-surface-area ratios, and the iron ore density is approximately twice that of the copper ore.
Although iron ore is abrasive, magnetite and hematite, the major components of the iron ore, are fairly brittle in nature, especially when compared to quartz, the major component in the copper ore (Dana, 1949).
Several investigators have stated that total wear in slurry systems is greater than the total of the corrosion and mechanical wear, or
Wt > C + M…………………………………………….(1)
where
Wt = total wear,
C = corrosive wear in the absence of mechanical wear,
and
M = mechanical wear in the absence of corrosive wear.
This necessitates adding an additional term to make the equation
Wt = C + M + Sy………………………………………………(2)
where Sy represents the synergistic effect between corrosion and mechanical wear. This synergistic effect can increase the total wear of ferrous alloys up to twice the sum of the individual wear rates (Tylczak, 1986).
The phenomenon of erosion-corrosion synergy is well documented (Fontana, 1978). Pitt (1985) and Isaacson (1985) showed that grinding media do exhibit higher corrosion rates under abrasive conditions than under nonabrasive conditions. Because the corrosion rate of ferrous material is greater under abrasive conditions, as in a grinding mill, the corrosion rates measured in this study include the term C In equation 2 and a portion of the term Sy.
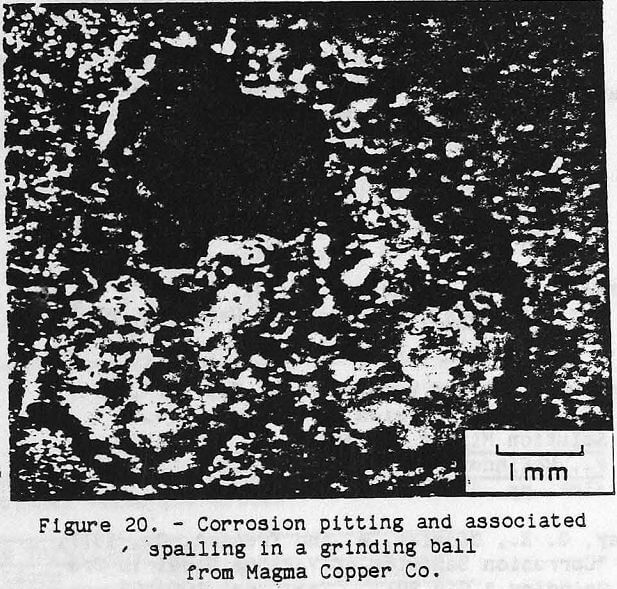
An effect of corrosion on mechanical wear also exists. Figure 20 is a photomicrograph (15X) of a corrosion pit in a grinding ball from Magma Copper Co. An increased amount of spalling is evident around the edges of the pit. Moroz (1983) determined that the corrosion pit weakens the surrounding material, increasing the amount of spalling.
The pitting tendencies of the materials tested were evaluated in the laboratory test
cell (Table 7) using simulated Magma mill slurry. The 27-pct-Cr cast iron had a low pitting tendency, and the other four materials had high pitting tendencies. Because of its much lower pitting tendencies and the fact that stainless steel, which makes up the metallic matrix of the 27-pct-Cr cast iron, is less susceptible to erosion-corrosion (Fontana, 1978), the high-Cr white cast iron should have a much lower synergistic effect between corrosion and mechanical wear than the lower alloyed materials.
Owing to the synergistic effect, decreasing the corrosion rate in a mill may decrease the total wear by a greater percentage than can be attributed directly to corrosion.
Conclusions
Three important conclusions were reached after completion of these studies:
- Material losses due to electrochemical surface reactions were only a small part of total media losses for the operations in which field tests were made.
- Total losses caused by corrosion effects can be significantly greater than those due to chemical reactions if frequent impact or continual abrasion on the media surfaces occurs in the mill, since many commonly used alloys are susceptible to pitting under milling conditions.
- Rates of grinding media loss from electrochemical reactions at the surface of the material can be determined from well-designed laboratory tests. Therefore, if corrosion is known to contribute to material loss in a particular operation, tests can be made to determine if changing milling conditions can significantly lower chemical reaction losses, which may result in substantial reduction in total losses.
Acknowledgments
The authors thank Dr. P. J. Moroz, Jr., of ARMCO Research and Technology, Middletown, OH, for providing grinding media alloy specimens suitable for testing in industrial environments, and the managements of Magma Copper Co., San Manuel, AZ, and Pea Ridge Iron Ore Co., Sullivan, MO, for allowing the field test work to be carried out at their facilities.