Table of Contents
Cost is a major criterion in decision making for selecting operational methods in mining. Knowledge of the operating cost, therefore, provides a sound basis for evaluating the feasibility of plans and for selecting alternative operational procedures. In production drilling, the choice of a drilling method is primarily based on several factors such as working condition, type of operation, specific production requirement, and equipment availability. Since drilling is a costly item in mining operation, the selection of drilling equipment is usually corroborated by the drilling cost. Predicting the penetration rate for a particular type of drill in a specific rock for the cost estimate therefore becomes a common practical problem in mining engineering.
The objective of this Bureau of Mines report is to present a method of penetration rate determination for percussion drills from a rock strength index. This index was adapted from the strength coefficient of rock developed by Protodyakonov. The background, approach, and modification of the Protodyakonov method to improve accuracy in the determination of the strength index are discussed. A penetration rate prediction equation is developed from the results of a laboratory test. Finally, the predicted rates and the penetration rates in the field are compared to show the significance of the reliability of the strength index.
Drilling Strength of Rock
Theoretically, the penetration rate of a drill is dependent upon its power output and the drilling strength of the rock. A basic equation for penetration rate for all types of drill is given by
R = P/SA…………………………………………………………………..(1)
where R = penetration rate,
P = power output,
A = cross-sectional area of drilled hole,
and S = specific energy in drilling.
The specific energy, S, is sometimes considered as a measure of the ability of rock to resist penetration or the drilling strength. Evidently, the penetration rate of a drill for a particular rock can be determined if the specific energy for the rock is known. The specific energy for a rock, however, is a derived quantity which can be only calculated from the power output of the drill and the measured penetration rate at a specific working condition.
The specific energy is a complicated quantity. It depends not only on the intrinsic strength of the rock, but also on the condition by which the rock is dislodged and removed. The type of bit, the size and depth of hole, and the method of cuttings removal are all influential factors that modify the specific energy.
Intuitively, the stronger the rock is, the harder it is to drill. Some mechanical properties of rock-for example, tensile strength, compressive strength, modulus of elasticity, indentation hardness, and rebound hardness-have been used for correlation with the penetration rate. Such properties allow prediction to a certain degree, but no single property has proved adequate to measure penetration rate of percussion drills. In actual drilling, some relatively low strength rocks are more difficult to drill than higher strength rocks.
In general, the strength of a material is referred to as the ability of that material to resist loads without yielding and fracturing. If a material is able to support high loads without appreciable plastic deformation or without breaking catastrophically, such a material is strong. The strength of a material is usually measured by the average stress value derived from the load at which the material yields or ruptures.
Rock has several characteristic values of strength. This is because rock can resist the loads in different ways, depending on the type of loading and the state of stress which affect the response of rock. Uncertainties of penetration rate prediction using the properties derived from conventional uniaxial tests such as tensile and compressive strength are due primarily to the complexities of the rock behavior and modes of rock failure in the drilling process. The specific energy in drilling is a collective measure of the energy dissipation for all modes of failure possibly occurring at the rock-bit interface. Such an energy dissipation process is far more complicated than that which occurs in the uniaxial tests in the laboratory.
A rough estimate of penetration rate of a drill sometimes was made by using an assigned number or relative drillability factor as a guide. One way to establish the drillability factor for rocks is a direct measurement of the penetration rate of rock selected as the base. The penetration rates of other rocks are then measured under the same drilling conditions and normalized with the base of the selected base. The factor obtained from the normalized value is developed as the relative drillability index. The shortcoming of this method is lack of generality.
Because it is impractical to run all drilling tests on all rocks to measure their penetration rates, a means for identifying the drilling strength of rocks is desirable. The problem encountered is to find a test method that is simple and gives a reliable result.
The penetration rate of percussion drills is basically attributed to crushing and chipping of rock at the bit rock interface. The volume of rock removed is, therefore, the volume dislodged by the bit under each blow of the striking hammer in the drill. In actual drilling a certain volume of rock initially dislodged by the primary cutting action of the bit is further reground; this regrinding is inferred by the size of cuttings ejected from the drilled hole. Such effect implies that a certain amount of applied energy is also consumed in a comminution process. Then the specific energy in drilling is essentially determined by the specific energies required for crushing, chipping, and grinding the rock. The energy consumption in each phase is, however, dependent on the volume fractions of the rock initially dislodged from the rock mass and the volume fraction subjected to grinding. It is surmised that any mechanical property that is directly related to the specific energies in crushing and grinding would be a good measure of the specific energy in drilling.
The Protodyakonov Number
To fully characterize the mechanical properties of rock related to their response to drill bits, Protodyakonov suggests use of the strength coefficient developed earlier by Protodyakonov, Sr., in 1912. Through use of a simple apparatus and test procedure, the strength of geologic materials ranging from quicksands to quartzite has been divided into scales varying from 0.3 to 20 according to the test results. These scales sometimes are called the Protodyakonov number.
The original test procedure is as follows. Each sample is broken up with a hammer. Five test specimens of 20 to 40 mm each are selected. The sample volume of 10,000 to 20,000 cu mm is used for each test. Each specimen is placed on the bottom of a hollow cylinder and is crushed by a drophammer weighing 2.4 kg falling from a height of 0.6 m. The number of drops ranges from 5 to 15, depending on the strength of the specimen; the stronger the rock, the greater number of drops required. The broken material of five specimens is then combined on a 0.5-mm screen. The volume of fines of the minus 0.5 mm is measured in a 23-mm-diameter cylindrical volume meter. The strength coefficient or the Protodyakonov number, f, is calculated from
f = 20n/l…………………………………………..(2)
where n = number of drops,
and l = column height of fines in the measuring cylinder.
The Protodyakonov number, f, was found to be directly proportional to the strain energy density of rock under uniaxial compression; the relationship is given by

where σc = compressive strength, kilograms per square centimeter,
and E = modulus of elasticity, kilograms per square centimeter.
In view of the simplicity of the test, this method received attention immediately. Nevertheless, accuracy and the limits of validity of the Protodyakonov numbers were of prime concern since it was noted that use of these numbers as the index of rock strength in some calculations led to inaccurate results.
An experimental program was set up at the Bureau’s Twin Cities Mining Research Center primarily to obtain the coefficient of rock strength according to the original test procedure previously described, and to investigate the potential of using the test results as a drillability index for percussion drills. In the early tests, it was found that some hard rocks were too strong to be fractured by the given falling weight even after several drops.
The volume of fines measured in the given measuring cylinder varied considerably with the degree of compaction. Moreover, the ratio between the number of drops and the volume of fines showed a wide variation with respect to the number of drops, It was noted later that other investigators encountered the same difficulties.
Lack of clear exposition in the source of information makes it difficult to trace the development of equation 2 and its continuity, leading to the relationship shown in equation 3. Basically, to establish any number as an index to represent rock strength, simplicity of the test method alone is not as important as reliability and reproducibility of the results. Hence, uncertainties involved during the test must be first overcome or reduced to a minimum.
One can surmise that small particles produced during the test come from the crushing of surface irregularities of the sample where they are in contact with the drophammer. A transverse tensile stress, which develops due to impact, causes major fractures in the sample and creates new irregular surfaces. The same mode may occur again under subsequent blows. In view of this, the relationship between the volume of fines and the applied energy is likely to follow the comminution law.
Analysis
The general comminution law usually quoted is expressed as follows (3):

where E = applied energy in size reduction,
x = mean size,
and C and n = constants.
Equation 4 may be interpreted by stating that in a continuous size-reduction process the decrease of energy gradient with respect to mean product size is inversely proportional to the size of material.
At the outset, it is considered that the volume of irregular solid, V, resembles a sphere which can be related to its mean size, x, by V = cx³, where c is a shape factor that in turn may be assumed to be a constant. Further, it is assumed that the size reduction in this test follows Kick’s law, from which the exponent n in equation 4 equals 1.
Hence, one can find dV = 3 cx²dx, and dE = -C dx/x.
By substituting dV for dx and V for x in equation 4 and integrating, the following relationship, which satisfies V = V0 for E = 0, is obtained:
v = Vo (l-e-αE)………………………………………………………….(5)
where V0 = original sample volume,
v = volume of fines,
and α = a constant.
Equation 5 implies that the volume of fines increases with the increase of energy. The rate of volume increase is dependent on the constant, α, which may be considered as a strength parameter of the material.
To determine the relationship between the volume of fines and the applied energy in the Protodyakonov test, the size reduction energy, E, in equation 5 has to be expressed in terms of the number of drops. Since the potential energy of the drophammer for each blow is the product of the weight and the height of drop which is constant, the size reduction energy, E, can be empirically related to n by
E = k (n – n0)………………………………………………………………….(6)
where n = number of drops,
n0 = threshold number of drops to produce fines,
and k = a proportionality constant.
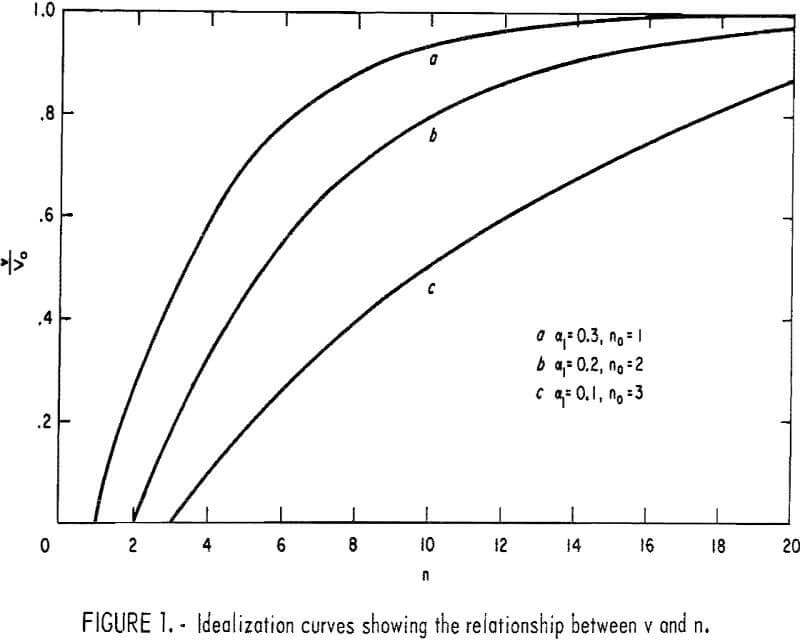
By substituting equation 6 in 5, one obtains
![]()
where αl = αk = constant.
To produce fines, the applied energy must exceed the strength of the rock. Mathematically, n must be greater than n0. Graphically, the relationship between v and n for some values of αl and n0 is shown in figure 1.
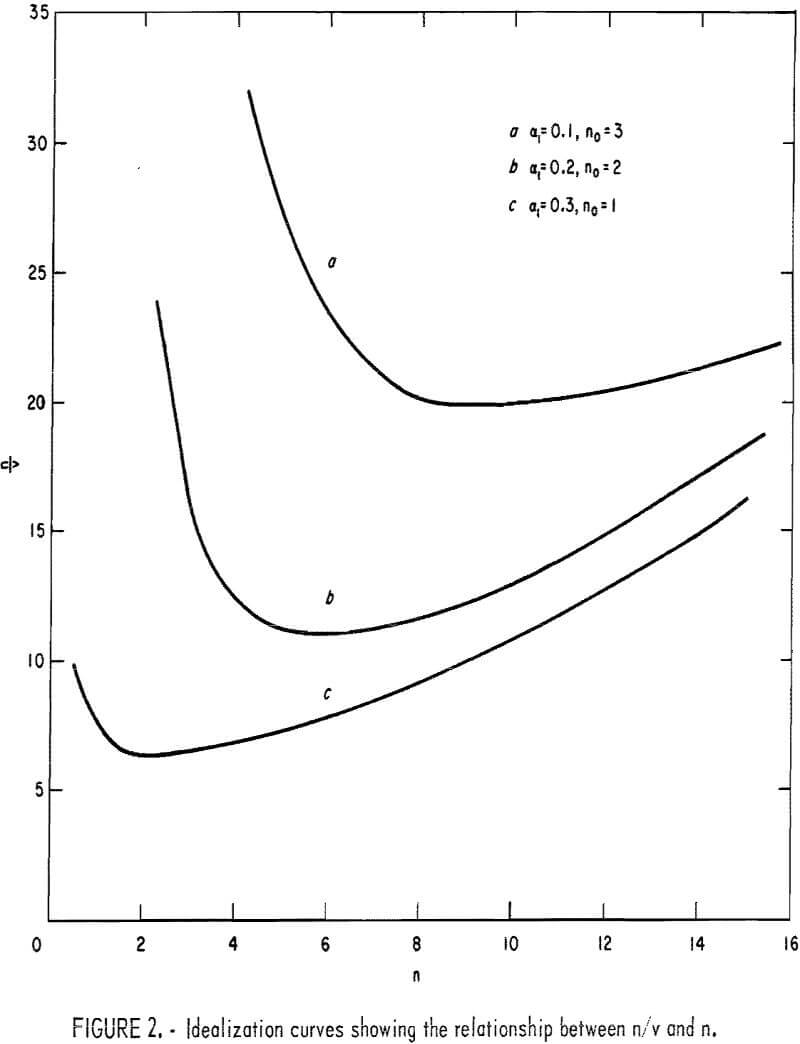
If two quantities, n/v and n, are considered as the variables, in this treatment, n/v can be expressed in terms of n by

Figure 2 shows the relationship between n/v and n, expressed by equation 8, for the same values of αl and n0 previously shown in figure 1.
Evidently each curve shows an inflection point where n/v is minimum. The significance of n/v at that condition is obtained by taking the derivative, d/dn (n/v), and equating to zero, which yields
![]()
To clarify, let n corresponding to the minimum condition be φ, and Vm be the volume of fines corresponding to φ; then solving φ/Vm one finds
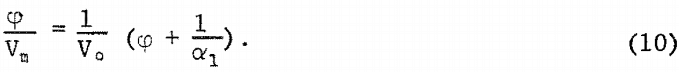
Obviously, the ratio of the number of drops to the volume of fines at the inflection point of the curves in figure 2 is unique. If φ/Vm is established as the coefficient of rock strength, it has only one value, which can be determined graphically. The foregoing analysis also suggests that for consistency of the results, the original volume of the test samples for each rock must be the same for all tests.
In obtaining the coefficient of rock strength described in the following section, the hints from the foregoing analysis are used as the basis. To avoid confusion with the Protodyakonov numbers, the coefficient of rock strength hereafter is called the CRS and denoted by f’.
Test Procedure for the CRS and Results
In the tests, 10 irregular-shaped rocks averaging 7,500 cu mm each are used. The specimens can be sorted by screening to select the minus 25.4-mm (1-in), plus 19.56 mm (¾-in) material. Obtaining representative samples of approximately 7,500 cu mm each is important. Since the shapes of the specimens were irregular, the volume of each specimen was obtained by weighing and dividing by its specific gravity. The total volume of the 10 specimens was
approximately 75,000 cu mm. The specimens were then divided into five groups of two specimens each.
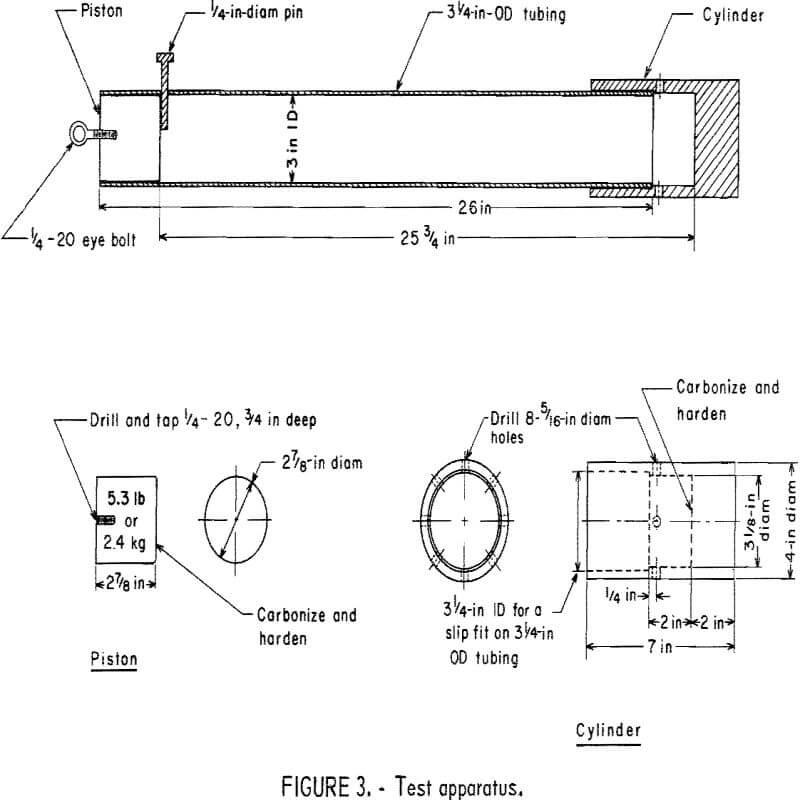
Each group of two specimens was placed in the bottom of the test cylinder, and the drop weight of 2.4 kg (5.3 lb) was dropped from the 0.60-m (25-3/16-in) height. The test apparatus (fig. 3) is the same as Protodyakonov’s apparatus.
The number of drops for each group ranged from 3 to 40, depending on the strength of the rock. The same number of drops was used for each group until the five groups were broken. The broken material for each group was combined on 0.5-mm screen (35-mesh) and hand shaken for 40 sec. Instead of using the measuring cylinder, the minus 0.5-mm. material was weighed in grams and divided by the specific gravity to determine the solid volume of the material.
The number of drops used for each group of specimens was divided by the volume of the minus 0.5-mm material from the five specimen groups. After the ratio of n/v was determined for one assay, a larger or smaller number of drops was selected to determine the minimum ratio of n/v, that is, φ/Vm. For the correct number of drops, it was found that the total volume of fines was approximately 12,000 cu mm for most rocks.
Typical curves showing the ratios of n/v plotting against the number of drops, n, are shown in figure 4.
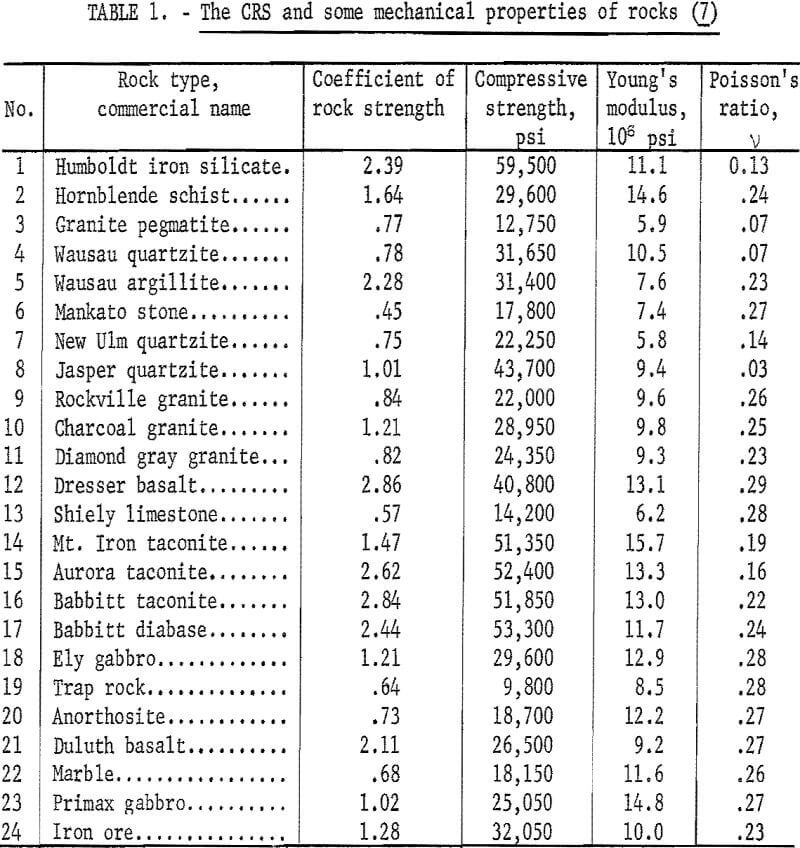
Apparently, the trend of the curves is similar to the shape of the idealized curve previously shown in figure 2. The minimum ratio of n/v on each curve was read from the curve and established empirically as the CRS. The values of the CRS are treated as dimensionless numbers as shown in table 1. Numerically, the values of f’ are not the same as the Protodyakonov numbers because of the modifications made in the procedure and in the derivation of the numbers.
The correlations of the CRS and the penetration rates of the percussion drills in the laboratory and in the field have been found.
Correlation of the CRS With Mechanical Properties
If the CRS of the 24 rocks shown in table 1 were plotted against their compressive strengths, poor correlation would appear. This is because rocks of the same CRS have different compressive strengths and vice versa. A better correlation, however, could be obtained if the strain energy density determined by σc²/2E4 was used in the plot instead of the compressive strength. The improvement indicates that the CRS is related to the toughness of rock rather than to its load carrying capability.
Toughness of a material usually is measured by the area under the stress-strain curve in the uniaxial tests. This quantity includes the elastic strain energy and plastic work dissipated when the material fails. As some rocks experience inelastic deformation before they fail, the toughness is more likely to give the best correlation.
Complete data on the toughness of those rocks in table 1, however, are not available. It is essential to assume that the brittleness and the toughness of rocks are determined by the strain at failure. Rocks that fail under

the same magnitude of strain, therefore, would have the same breaking characteristics.
The CRS were then plotted against the compressive strength as shown in figure 5. Each data point is numbered in accordance with the numbers listed in table 1. Three curves (a, b, and c in fig. 5) were drawn, each of which tentatively classifies the rocks of the same breaking characteristic. A relative characteristic of those rocks for each curve was assigned as tough, medium tough, and brittle, respectively. Hence, the relationships between the CRS and the compressive strength were obtained as follows:
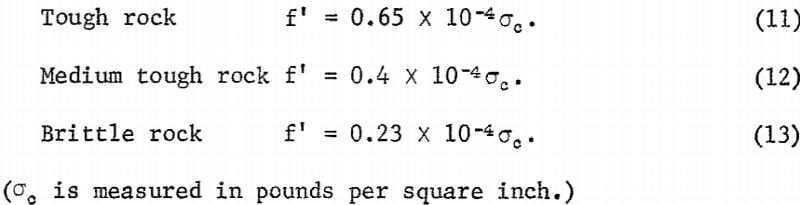
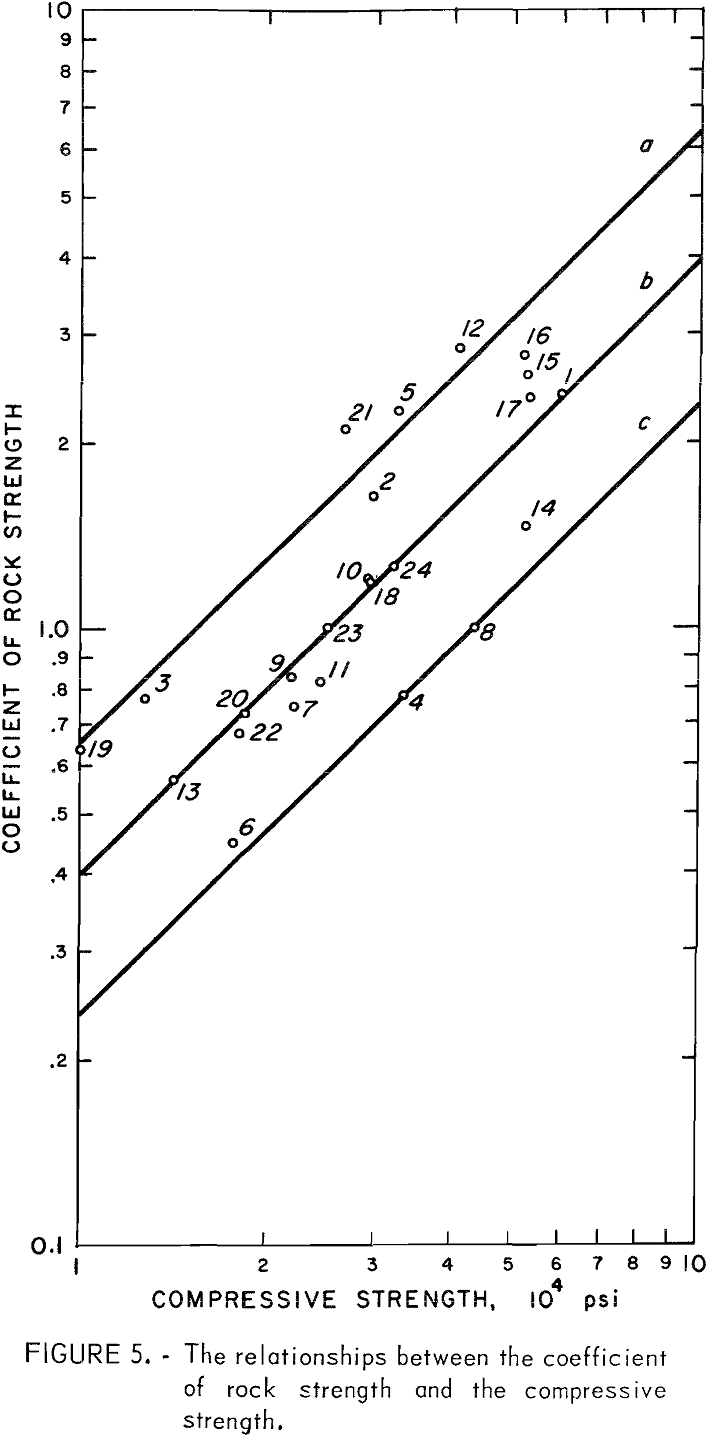
According to the foregoing characterization, trap rock, granite pegmatite, hornblende schist, Duluth gabbro Wausau argillite, Dresser basalt, and Babbitt taconite are classified as tough rock Brittle rocks include Mankato stone, Wausau quartzite, Jasper quartzite, and Mt. Iron taconite. The remaining rocks in table 1 are medium tough.
The relationships shown by equations 11 through 13 are helpful in estimating the compressive strength of rock from the CRS and vice versa. The difficulty encountered, however, is a matter of identifying the relative characteristic at the beginning. For practical purposes, the percentage of silica content seems to be an indicator. As a rule of thumb, a tough rock has SiO2 content about 40 percent; in a brittle rock, SiO2 content is approximately 72 percent and above. Limestones and most granitic rocks may be considered as the medium tough rock to which equation 12 is applied.
The CRS as a Drillability Index
In view of reliability for penetration rate prediction of percussion drills, data obtained from the drill tests under a controlled condition in a laboratory were selected as a basis. The values of specific energy in drilling of nine rocks were calculated from the power
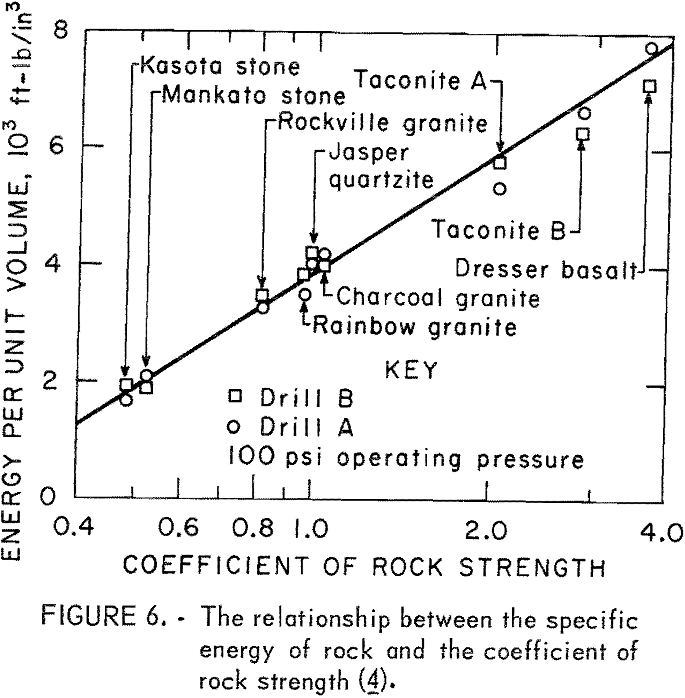
outputs and the volumes of rock removed at the optimum drilling conditions of two drills used in the tests. The correlation between the specific energy of rock, S, and the CRS f’, is shown in figure 6, from which the following equation was derived:
S = 3860 + 2744 ln f’ (ft-lb/in³)…………………………………………..(14)
This relationship is, however, applicable only for the cross-type bit. Evidently S is nonlinearly related to f’.
As mentioned previously, the specific energy in drilling is dependent upon the volume fractions of the rock initially dislodged in the basic modes and the extent of regrinding. Experimental results also show that the specific energy in drilling larger holes is less than that in drilling the small holes. The specific energy, S, then is dependent on the cross-sectional area of the drilled hole.
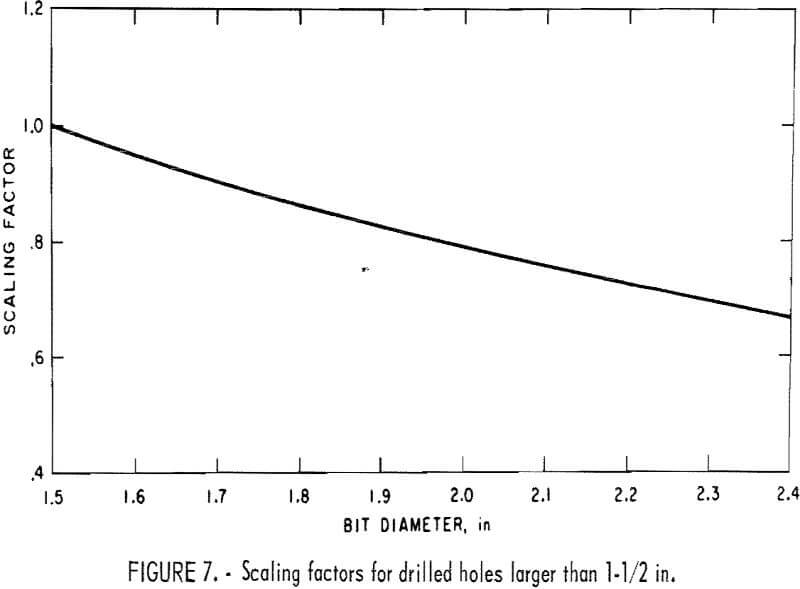
To apply equation 14 for the drillability determinations, a scaling factor is required for a particular size hole larger than 1-½ in, since equation 19 was obtained from the experimental results using a 1-½-in cross-type bit. The scaling factor, K, can be expressed by the following equation:
lnK = 0.47(d – 1.5)……………………………………………………………(15)
where d is the diameter of the hole to be drilled.
The scaling factor, K, is shown graphically in figure 7.
The corrected specific energy in drilling, for the cross-type bit larger than 1-½-in diameter, therefore, is obtained by multiplying S from equation 14 by scaling factor K.
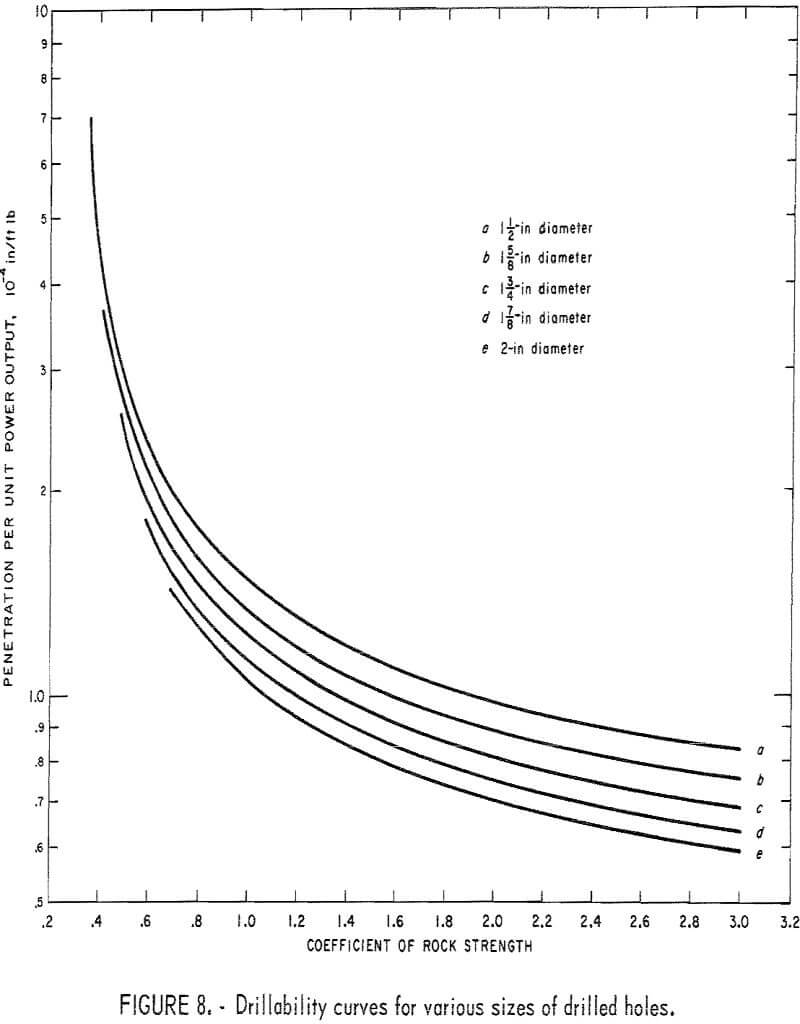
Now the penetration rate equation can be obtained from equations 1, 14, and 15, which yields

where R/P is the penetration rate per unit power output of the drill. The drillability curves for 1-½-, 1-5/8-, 1-¾-, 1-7/8-, and 2-in-diameter holes are drawn from equation 16 and shown in figure 8.
To obtain the penetration rate from these curves, the power output of the drill at the operating air pressure is required. Such information may be obtained from the manufacturer of the drill or by calculations.
Prediction of Penetration Rate
The maximum power output of a drill is the energy rate utilized in penetration at the optimum thrust. Figure 9 shows the calculated maximum power output of drills A and B previously used in the laboratory tests at various operating air pressures. As R/P for a particular rock can be read from the curves in figure 8, the penetration rate of a particular drill can be obtained from the product of R/P and the maximum power output of the drill.
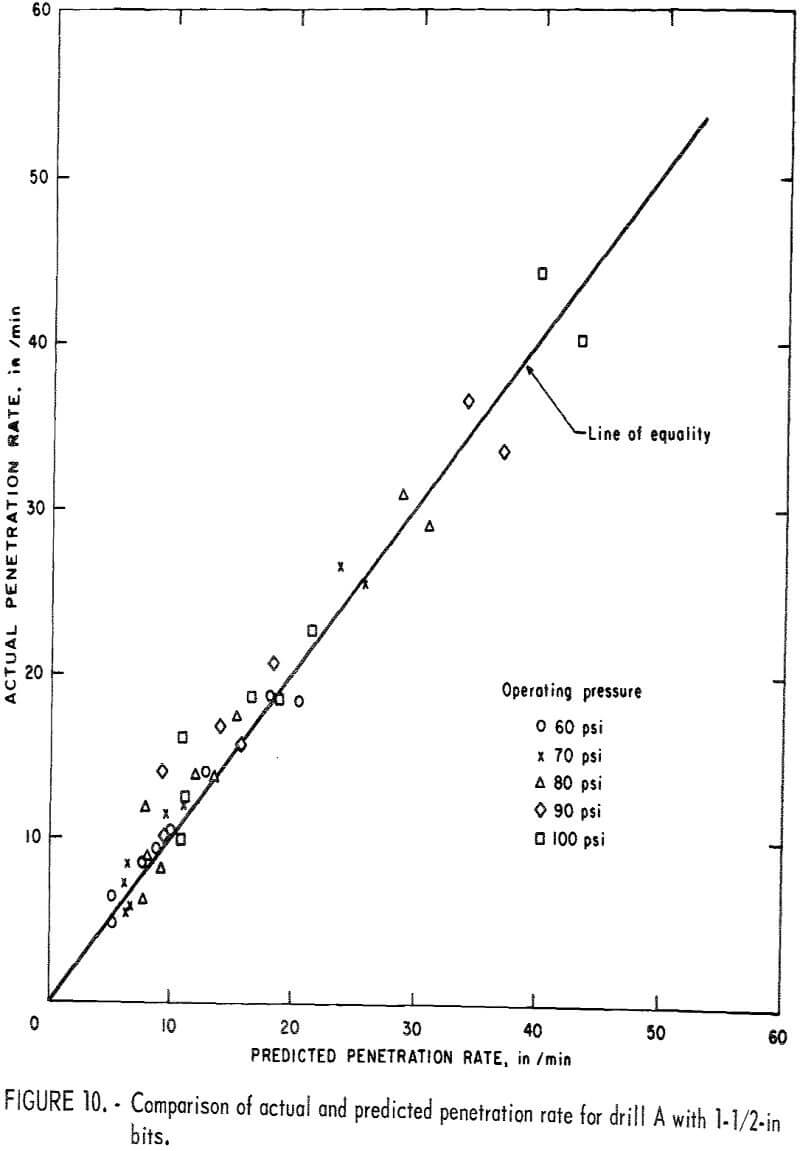
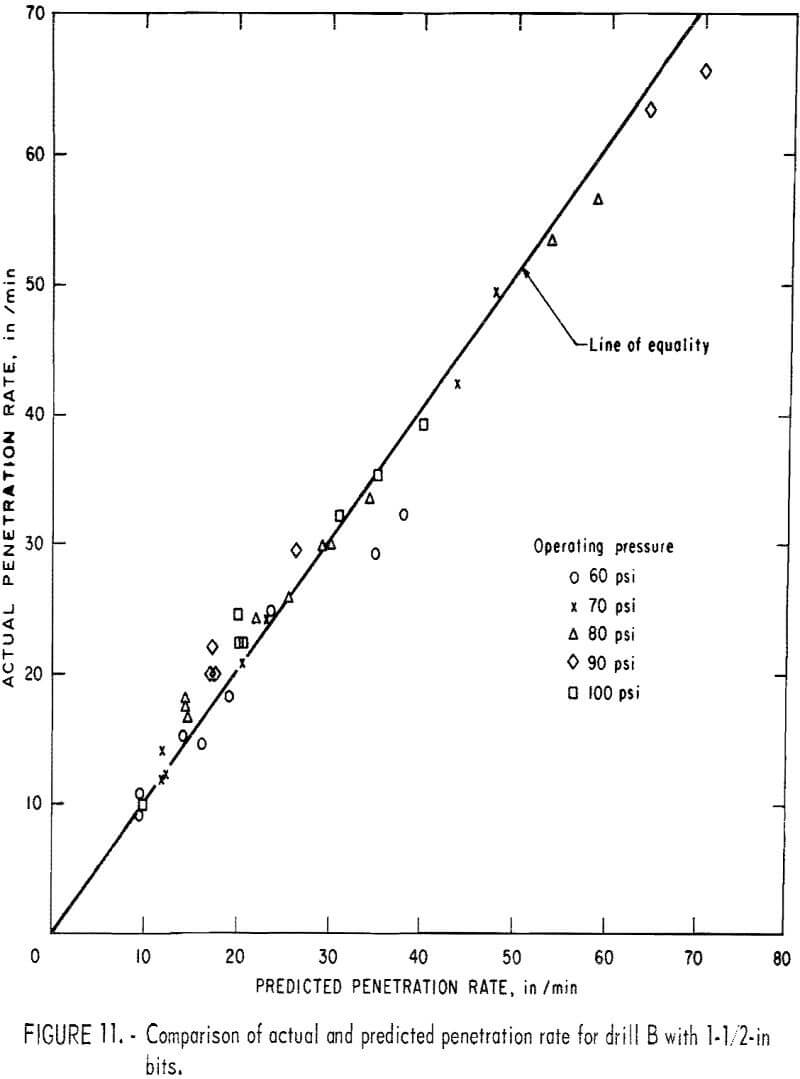
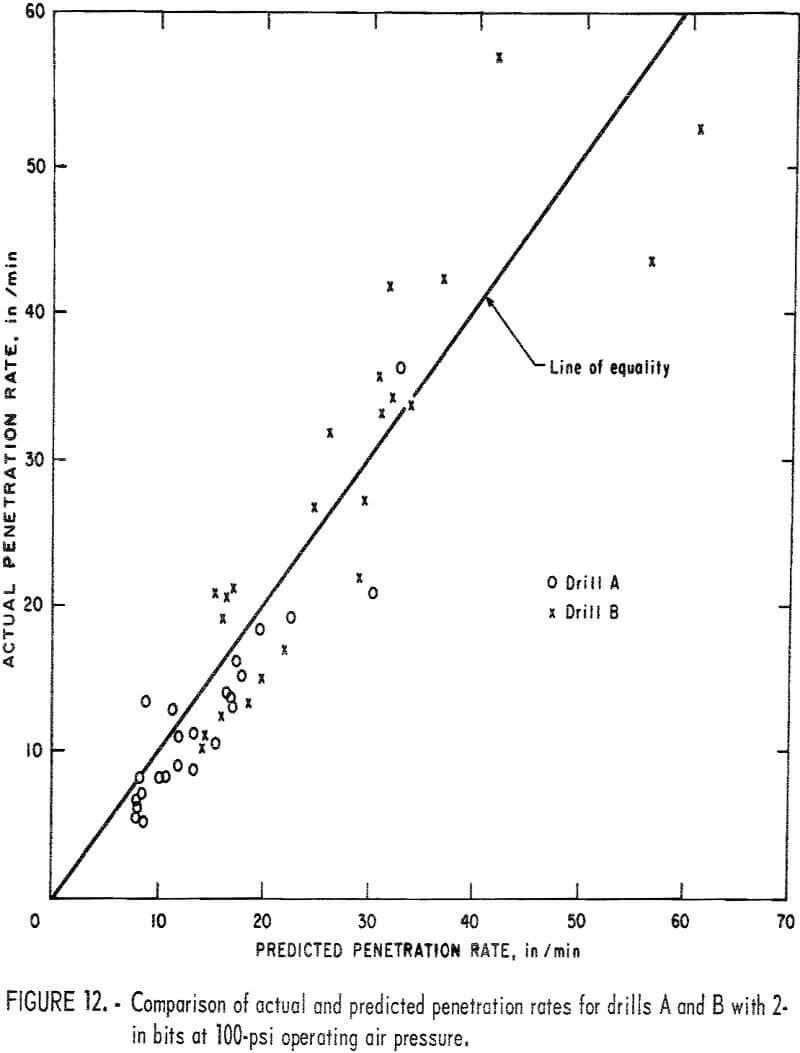
Since the drillability curves in figure 8 were obtained from the laboratory results, there remains the next step of checking the accuracy of the drillability predictions. The predicted results obtained from the simple procedure just mentioned were compared with the actual drilling rates obtained from the field by the same drills A and B. Figures 10 and 11 show the comparison of the actual and predicted penetration rates for drills A and B with 1-½-in bits at various operating pressure. Figure 12 shows the comparison of the actual and predicted penetration rates for both drills with 2-in bits at 100-psi operating pressure. These results support the fact that the coefficient of rock strength is a reliable index for drillability of percussion drills.
Conclusions
The background, the approach, the modification of the Protodyakonov test procedure for a strength index of rocks, and its significance as a drillability index for percussion drills have been discussed. The CRS obtained by the modified method range from 0.3 to 3.0 for rocks having compressive strength approximately between 10,000 and 60,000 psi. Three simple relationships between the CRS and the compressive strength have been obtained, if rocks are classified according to their relative characteristic as assigned. Due to the modification, the CRS differs from the Protodyakonov number. The drillability curves were drawn from the derived penetration rate equation. These curves will facilitate the estimation of drilling rates of percussion drills in the field within reasonable error.