
Table of Contents
A major problem facing the metals industry in the United States and perhaps throughout the world is the disposition of waste oxide dusts generated at various stages of processing. Storage in landfills has been used most often in the past; but, as more and more of these wastes are being declared hazardous, landfill costs have risen from just a few dollars per metric ton up to $100 to $150/mt, and the costs continue to rise. It is imperative that a cost-effective method be found for treatment of these wastes, and the high cost of disposal is a strong economic incentive.
One common constituent in most of these wastes is Zn. Due to its high volatility, Zn often vaporizes during pyrometallurgical processes and ultimately condenses in a finely divided oxidized form. Examples of such wastes include electric arc furnace dusts from steelmaking operations and brass smelter dusts. Conservative estimates place the amount of recoverable Zn from domestic stack dusts at over 200,000 mt annually, which is about one-quarter of domestic comsumption, of which 70 pct is now imported. These wastes also contain other recoverable metals, many of which are of strategic importance.
The economics of treating wastes of this type are not particularly favorable because of the expensive processing costs involved. However, if sufficient Zn can be recovered, the process is considerably more cost effective. The production of primary Zn from wastes presents a number of technical and economic problems. Electrowinning, for example, is very sensitive to some of the impurities in the waste even when the concentration of the impurity is only a few parts per billion. In order to circumvent some of these inherent difficulties, the concept of bypassing bulk metal production and going directly to an end product was investigated. The initial attempt at developing this idea was in the use of Zn from the dusts for electrogalvanizing or coating steel wire with a thin deposit of Zn for improved corrosion resistance. Unlike electrowinning, relatively high levels of impurities can be tolerated during electrogalvanizing because of the high current densities required and the short plating times, both of which diminish the effects of impurities in the bath.
More than one-third of all steel wire is given some kind of metallic coating for either decorative, protective, or other engineering purpose (such as adherence to rubber in tire applications). Coatings of Zn, Sn, Al, Cu, brass, Pb, Ni, and precious metals have all been used. Most common of these, however, is Zn galvanizing.
Processes for Zn coating steel have been commercially available for a number of years, with hot dip galvanizing accounting for the majority of the tonnage consumed in the United States. The first electrodeposition of Zn on steel occurred sometime prior to 1827. Although the electrogalvanizing of strip steel attained importance in 1915, the Zn plating of round wire did not reach any extensive application until 1933 with the development of the Tainton or Bethanizing processes.
The electrodeposits are always made at relatively high current densities, usually in the range of 200 to 1,200 mA/cm²), on wire that is continually moved through the electrolyte. Both soluble Zn and insoluble Pb or Pb alloy anodes are used, depending on the product requirement and the chemistry of the electrolyte.
The plating solutions are categorized by anion type, the three major ones are as follows:
- Sulfate.
- Chloride.
- Mixed (sulfate-chloride).
In this investigation, the mixed-type electrolytes were used, with the nominal pH range being from about 3.5 to 5.0. Common practice is to add other chemical species to the electrolyte to enhance the deposit quality or improve the operation of the bath. Examples are conductivity enhancers, buffering agents to minimize pH changes, and organic additives to give grain refinement and leveling of the Zn deposit.
When manufacturing small-diameter galvanized steel wire, it becomes uneconomical to coat the material in final size because of excessive length and the difficulty in obtaining a uniform coating thickness. Standard practice, therefore, is to reduce the steel wire to some convenient intermediate size, often 2.5 to 3 mm in diameter, coat this size wire, and then produce the final size product by drawing the already coated material. Thus, the final drawing operations involve the deformation of a bi-metal product having a steel core and a Zn coating.
This report describes research to determine whether Zn from flue dust can be used to electrogalvanize steel wire without sacrificing important properties such as drawability and corrosion resistance. The investigation was conducted on a small scale in the laboratory and on a larger scale in an industrial pilot plant.
Only the work with soluble anodes is reported in this preliminary research, but the emphasis was on the use of waste oxides as a source of Zn for insoluble anode processes, which remove large amounts of Zn from the electrolyte during electrogalvanizing. Insoluble anodes are preferred in industrial processes because they do not require frequent (sometimes daily) changing and the electrode gap (IR drop) remains relatively constant. Also, there is more flexibility as to the source of Zn.
A proven research technique for determining the effects of impurities during electrolysis is to minimize the number of variables such as bath composition, temperature, pH, anode reaction, etc., during operation of the cell. Then changes between deposits made in pure solutions and those made in impure solutions can be readily assessed.
The tremendous volume of electrolyte used in industrial processes tends to keep the concentration and pH constant, but in small-scale tests, these variables are best controlled by using soluble anodes: The anode dissolves at about the same rate that Zn is removed from solution at the cathode. The use of soluble anodes also eliminates the evolution of oxygen that takes place at insoluble anodes, which can have a marked effect on the reactions taking place in a small cell.
Another reason soluble anodes were used at this stage of the research is that the insoluble anodes most often used in industrial processes are Pb-Ag (0.75 to 1.0 pct Ag). These anodes put large amounts of Pb into the electrolyte making it difficult to evaluate the effects of other impurities in small-scale tests. A minor research program is being conducted to evaluate the effects of Pb on the electrogalvanized product.
Several wastes with varying Zn contents, secondary Cu smelter dusts, Pb smelter dusts, waste water treatment sludge, and brass smelter dusts were used as a source of Zn for electrogalvanizing. Even though the Zn contents and trace impurities varied in each of the dusts, similar results were obtained when the Zn was extracted and used to electrogalvanize steel wire; therefore, to simplify this report, only the results of the work with brass smelter flue dusts, the waste with the highest Zn content, will be discussed. Information on the results of using the other wastes as a source of Zn for electrogalvanizing can be found in the references cited previously.
Experimental Procedures
Materials
Waste
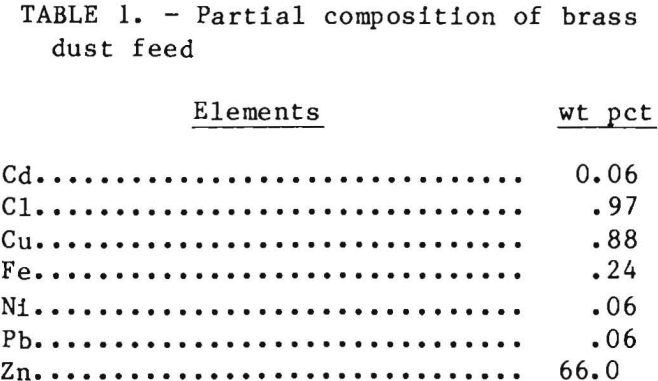
The average partial composition of the brass smelter flue dust used in this investigation is given in table 1. Typically, the particle size was 98 pct less than 100 µm with 90 pct being less than 15 µm. The dust was used as received.
Wire
The steel wire used for all the bench-scale tests by the Bureau and at the University of Missouri – Rolla was 2.26-mm diameter 1070 alloy and was obtained from National Standard Wire Co. The wire used in the pilot-scale tests at National Standard Wire Co. was also 2.26 mm in diameter but was 1090 alloy.
The intention was to use 1070 alloy, a major product at National Standard Wire, for both the laboratory-scale and pilot-scale tests. Unfortunately, only 1090 alloy was being produced in the plant at the time of the pilot-scale test. It was necessary to use 1090 alloy to avoid interrupting the production cycle of the
company. Although the 1090 alloy test coils were not electrogalvanized on the production line, they were drawn along with the production coils.
Zinc Extraction
In bench-scale tests, Zn was extracted from the brass smelter flue dusts by leaching with H2SO4 and distilled H2O. The experiments were designed to extract Zn at maximum efficiency and to end up with a solution with a pH of 4 to 5 to facilitate the removal of Fe.
In a typical leach, -1.5 kg of as- received dust was mixed with 8 L of 0.18 kg/L H2SO4 in a 10-L glass vessel on a hot plate with a magnetic stirring attachment. Considerable heat was generated with the mixing of the dust and acid, mainly from the exothermic reaction:
ZnO + H2SO4 → ZnSO4 + H2O…………………………………………………………………(1)
The standard enthalpy of formation, ΔHF°298, for this reaction is -23.91 kcal. Additional heat was supplied with the hot plate to raise the temperature to 95°±2° C and to hold this temperature for 1 h prior to filtering. A Teflon5-polymer-coated magnetic stir bar was used to stir the mixture and aid in dissolution of the ZnO in the dust.
Vacuum filtration was accomplished with the usual laboratory equipment; e.g., filter flask, buchner funnel, filter paper (Whatman No. 41 or equivalent), and a water aspirator.
In addition to the waste solutions, synthetic solutions were prepared from relatively pure (99.89 wt pct) ZnO, reagent-grade H2SO4, and distilled H2O. The ZnO contained, in weight percent, 0.0014 Cd, 0.0019 Pb, and 0.068 H2O and had an average particle diameter of 0. 33 µm.
Zinc extraction for the large-scale industrial tests was similar to that for the bench-scale tests. Concentrated H2SO4 (1.42 kg) was added to 68 L of deionized water at ambient temperature in a 120-L fiberglass-reinforced polypropylene reactor. The mixing caused an exothermic reaction, and the solution temperature rose to 60° C. Addition of -14 kg of brass smelter flue dust also caused an exothermic reaction, and the temperature of the solution increased to 95° C within 1 h. Unlike the bench-scale tests, the solution was partially purified prior to solid-liquid separation. At 80 and 120 rain after the flue dust addition, 0.068 kg of Zn dust was added to the solution in the 120-L reactor. After 2.5 h, the mixture was filtered in vacuum pan filters 61 cm wide by 61 cm long by 20 cm deep. No external source of heat was used in this large-scale test. More complete details of the leach reactors and filter equipment used in the large-scale tests can be found in a Bureau report.
Purification of Leach Solutions
Iron was removed from all the leach solutions during Zn extraction by controlling the pH and by vigorous stirring. Solution pH was the dominating factor in the removal of Fe. As the pH increased beyond 2, Fe began to precipitate as Fe(OH)3 with the maximum rate of Fe removal occurring near 5 or somewhat above. The rate of Fe removal was dependent on the introduction of air into the solution, which was the purpose of the vigorous stirring.
Some of the leach solutions generated during bench-scale tests were treated with 2 g/L Zn dust (50 pct <70-mesh) at 90° C for 1 h to remove elements more noble than Zn, such as Cd and Cu, from solution. In bench-scale tests, Zn dust additions were made to the solution after Fe removal by precipitation and solid-liquid separation. In the large-scale test, Zn dust additions were made simultaneously with Fe(OH)3 precipitation and prior to solid-liquid separation as mentioned previously under the heading “Zinc Extraction.”
Electrolyte
The composition of the electrolyte used in this research for electrogalvanizing was essentially the same as that used at the National Standard Wire Co. plant.
The mixed sulfate-chloride electrolyte was prepared from both the waste leach solutions and the synthetic solutions by adding 18 g/L NH4Cl to enhance conductivity and 12 g/L H3BO3 as a buffer. Solid licorice, 0.3 g/L, was also added as a leveling agent in some cases. The pH was measured with a digital pH meter and, when necessary, pH adjustments were made by adding reagent-grade, concentrated NaOH or H2SO4. The nominal composition of the electrolyte prepared for electrogalvanizing was 90 to 160 g/L Zn with a pH about 3.5 to 5. 0.
In addition to the electrolytes prepared from the waste and synthetic solutions, industrial electrolyte was obtained from National Standard Wire Co. and used to electrogalvanize steel wire for comparison with wire electrogalvanized in waste and synthetic electrolytes.
Electrocleaning
In the bench-scale tests, 15-cm segments were cut from a coil of 2.26-mm- diameter 1070 alloy steel wire and were straightened by hand and degreased in trichloroethylene prior to electrocleaning. The wires were electrocleaned in a 600-g/L H2SO4 solution at ambient temperature in a 400-mL glass beaker using a counterelectrode of Pb-Ag (0.75 pct Ag) and a current density of 400 mA/cm². The wire was first made cathodic for 1 min and then anodic for 1 min, and this cycle was repeated as often as necessary to remove rust and scale. Usually, four cycles were sufficient. A bipolar switch was used to reverse the direction of current flow during cathodic-anodic cycling. During electrocleaning, the wire was rotated at 70 r/min by a servocontrolled motor. The wire was rinsed with distilled H2O after electrocleaning.
For the pilot-scale tests at National Standard Wire, 180-kg coils of 2.26- mm-diameter 1090 alloy steel wire were electrocleaned in a continuous process in two steps. In the first step, the wire was electrocleaned as it passed through two 1-m-long rectangular cells containing a proprietary alkaline cleaner at 82° C. The wire current density was approximately 160 mA/cm² and the line speed was 10 m/min. The wire was cathodic in the first 1-m cell and anodic in the second.
After alkaline electrocleaning, the wire passed through a fresh water rinse and into two 1-m-long cells containing 870 g/L H2SO4 at 32° C where it was again electrocleaned, first cathodic and then anodic, as before, at a wire current density of about 540 mA/cm². The wire passed through a fresh water rinse before entering the plating cell. Lead antimony alloy electrodes were used in both the alkaline and acid cleaning cells.
Electrogalvanizing
In bench-scale electrogalvanizing tests, the electrolyte was placed in a 400-mL glass beaker and brought to the desired temperature of 25° to 60° C with a hot plate with a magnetic stirring attachment. The electrocleaned wire was inserted into the electrolyte and rotated at 100 r/min while electrogalvanizing at 200 to 600 mA/cm² cathode current density for sufficient time, usually 30 s, to give a 1-wt-pct coating of Zn (50 to 60 g/m²); the same as used at National Standard for many of its products. A 99.999-pct-pure Zn cylindrical anode, 1.2 cm in diameter by 7 cm long, was machined to give a flat surface, which was masked with electroplaters tape to leave an exposed area equal to or greater than the area (5 to 7 cm²) of the 1070 alloy steel wire cathode being electrogalvanized. Some stirring of the electrolyte was provided by the rotating cathode; in addition, a mechanical stirrer was used.
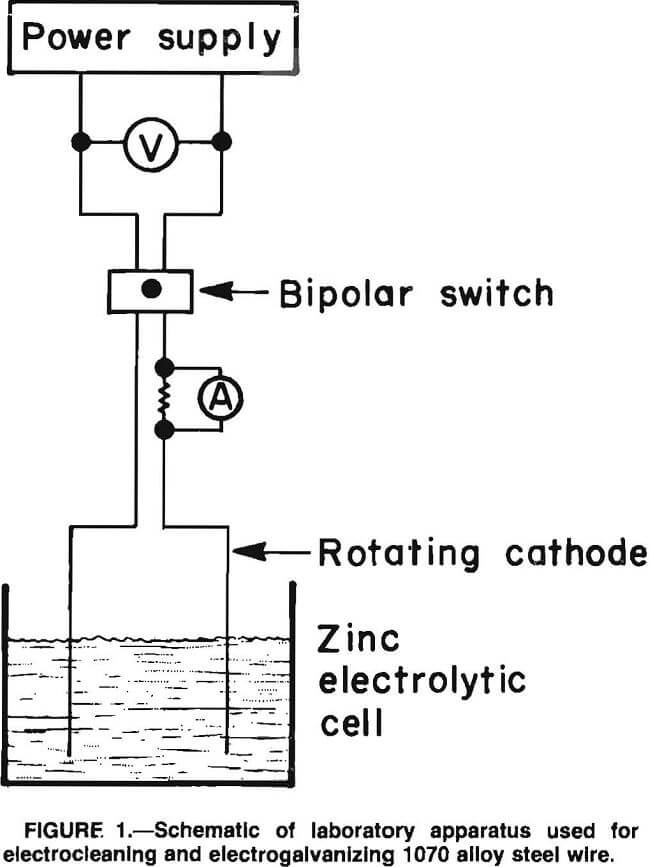
After electrogalvanizing, the wire was removed from the electrolyte, rinsed with distilled H2O and ethanol and blown dry. A 50-ampere, 40-V power supply was used to apply the controlled current to the cell. Figure 1 shows a schematic of the cell and associated equipment used in the bench-scale tests for electrocleaning and electrogalvanizing.
In the industrial tests, after cleaning and rinsing, two 180-kg coil of 1090 alloy steel wire were electrogalvanized electrolyte as they passed through three 1-m-long plating cells at a cathode current density of 500 mA/cm². The electrolyte temperature was 60° C and the pH was 3.5 to 4.5. Nominal line speed was 10 m/min, and the speed was adjusted to allow sufficient retention time in the cell to give a 1-wt pct Zn coating.
One coil wire was electrogalvanized in industrial electrolyte. Then the electrolyte was removed from the plating cell, and the cell was cleaned and refilled with the waste electrolyte that had been prepared at the
Rolla Research Center from brass smelter flue dust. A second 180-kg coil of 1090 alloy steel wire was electrogalvanized under the same conditions. After electrogalvanizing, the wire was given a fresh water rinse, a hot water (88° C) rinse, and an air wipe (blown dry).
Drawing
Prior to drawing the wire electrogalvanized in the bench-scale tests, a general study was conducted with wire electrogalvanized at National Standard Wire to determine the effects of various drawing parameters (such as die angle, reduction ratio, and die-workpiece friction) on the drawing characteristics, mode of flow, amount of Zn loss during drawing, and resultant product quality. This information was necessary to determine the best parameters to use for the subsequent drawing tests with the specimens electrogalvanized in the laboratory and to establish a basis for comparison.
Precut lengths of 2.34-mm-diameter electrogalvanized steel wires were swaged to reduced size on one end, immersed in acetone, and ultrasonically cleaned for 3 min; a length of about 13 mm was cut from each to provide a sample for initial surface characterization via scanning electron microscopy (SEM). The wires were precisely weighed on an electronic balance prior to immersion in a reservoir of water-soluble oil (oakite Fisan LC- 66), which was selected on the basis of a series of experiments. The wires were drawn from this reservoir through commercial-quality carbide drawing dies. Four dies were selected to provide reductions of 10, 20, 30, and 40 pct as computed from the original wire diameter. Two sets of dies were available, one set each, for two different semicone angles (5°, 10°). Bureau researchers and officials of National Standard Wire were interested in knowing the best semi-cone angle to minimize drawing force and Zn loss.
The drawing operation was performed on a horizontal hydraulic draw bench at a speed of 1.82 m/min, and the drawing force was monitored by a strain gage load cell system and strip-chart recorder.
After drawing, the wires were recleaned in demineralized water and acetone, reweighed to determine weight loss, and a 13-mm specimen was removed for surface inspection via SEM.
Once the operating parameters were established on the industrial electrogalvanized wire and the best semicone angle was selected, the drawing experiments on the wire electrogalvanized in the laboratory were begun.
The two coils plated in the industrial tests, one in National Standard’s electrolyte and one in the waste electrolyte, were drawn through nine dies at approximately 22 pct reduction per die (from 2.26 to 0.76 mm) to produce a final product, in this case music wire. Most of the drawing was done dry but, when needed, sodium stearate was used for lubrication. The drawing speed was usually about 300 m/min.
Corrosion Testing
Preliminary corrosion rate evaluation was conducted in a salt-spray cabinet according to ASTM Standard B117-73. Selected electrogalvanized steel samples were evaluated by means of electrochemical measurements. The procedure used for electrochemical corrosion rate measurements was similar to that given by Baugh for pure Zn.
The corrosion cell was a commercially available 1-L glass vessel. One molar (NH4)2SO4 prepared from analytical reagent-grade salt was the medium employed. All measurements were performed in deaerated solutions at 25°±2° C, pH 6±0.1. The counterelectrode was Pt mesh, and the reference was a saturated calomel electrode (SCE). The reference electrode was placed in a bridge tube fitted with a Vycor frit for a minimum resistance drop and low leak rate.
Sample preparation consisted of degreasing specimens in boiling trichloroethylene, rinsing with absolute ethanol, and blow drying. The wire surface area used was 1 cm². A scanning potentiostat was connected to the cell, and polarization curves were obtained by scanning at 0.25 mV/s from the corrosion potential, first in the cathodic and then in the anodic direction. Extrapolation of the Tafel region of the anode portion yielded the corrosion current, icorr, at the corrosion potential, Ecorr. Potential and current were measured with digital electrometers. All measurements were made in quiescent electrolytes.
Cyclic Voltammetry
Cyclic voltammetry was used in this study to characterize the electrolytes and, hopefully, to predict their behavior prior to their use for electrogalvanizing.
Cathodic polarization curves were obtained in electrogalvanizing electrolytes on polished 1070 alloy steel wire. Polishing consisted of 240-grit SiC abrasion to remove rust, followed by 600-grit SiC abrasion to yield a reproducible surface. The specimen was then degreased in trichloroethylene and wiped dry. The anode was a 99.999-pct Zn rod with one face machined to yield a flat surface. The cathode and the anode were masked to give 1-cm² surface area. The reference electrode and cell were of the same type as described in the corrosion section.
The measurements were performed at 60° C. Scanning was begun at -0.95 V versus SCE and continued in the cathodic direction at a rate of 0.5 mV/s until a current density of 50 mA/cm² was reached. At this point, the scan direction was reversed, and the scan was allowed to continue until the reversible cell potential was reached. All measurements were made in stirred electrolytes.
Results and Discussion
Zinc Extraction and Purification
The brass smelter flue dusts were chosen for most of this work because of its high Zn content and excellent leaching characteristics: fast dissolution of Zn, low Fe content that could be precipitated easily as Fe(OH)3, and Cu, the main impurity, could be removed easily by cementation with Zn dust. Treatment with 2 g/L Zn dust at 90° C for 1 h was sufficient to reduce Cu from 15 to 20 mg/L to 1 to 2 mg/L.
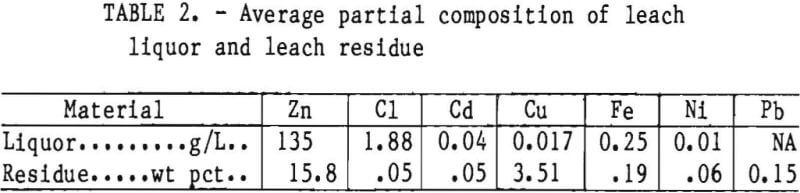
About 75 pct of the brass smelter dust dissolved, and Zn extraction efficiency for all tests was about 95 pct. Table 2 gives the average partial composition of the leach liquor and residue.
The residue remaining after Zn extraction would be classified as a hazardous waste. When the EPA toxicity test was applied to the residue, the resulting extract contained 1.3 mg/L Cd and 8.2 mg/L Pb, which is greater than the allowable concentrations of 1.0 mg/L and 5.0 mg/L for Cd and Pb, respectively. However, because of the 75-pct reduction in the weight of the residue with the Zn extraction, the savings in disposal costs would be significant.
During Fe removal by oxidation and pH control, some Cu was removed as a Cu-Zn basic sulfate, and some Pb was removed by ion exchange on Fe hydroxide with the simultaneous liberation of H ion. The removal of Pb was rapid, but the removal of Cu was relatively slow.
Although the amount of Pb remaining in the leach liquor was not determined (table 2), the limit of solubility of Pb in a sulfate solution is about 5 mg/L.
Electrolyte
In the beginning of this research, several attempts were made to use the leach liquor generated during Zn
extraction from the brass smelter dusts as electrolyte for electrogalvanizing after the additions of NH4Cl and H3BO3. Much of the Fe was removed during the leach, but there were no further efforts made to purify the solution by adding Zn dust to cement out elements such as Cd, Cu, etc. These attempts were unsuccessful, as will be discussed further under the section on electrogalvanizing, and it was found necessary to add Zn dust to the leach liquor to remove or control impurities, particularly Cu, in the leach liquor. A typical electrolyte would have a composition similar to that of the leach liquor listed in table 2 but with the 18 g/L NH4Cl and 12 g/L H3BO3 added, plus Cu would be lowered to 1 to 2mg/L with 2 g/L Zn dust additions.
Electrogalvanizing
After preparation of the electrolyte, electrocleaned wire was electrogalvanized in the laboratory at 600 mA/cm² current density and in the pilot tests at National Standard Wire at 500 mA/cm². In industrial electrogalvanizing, current densities are normally as high as possible. The current density is usually limited by the rectifier capacity. If rectifier capacity is not a limitation, then the limiting current density is the current density at which the morphology of the deposit begins to deteriorate, e.g., dendrite formation.
At a given current density, Zn coating thickness is a function of deposition time, which in turn is a function of speed of the wire through the plating bath. As mentioned previously, the 1-wt-pct Zn coating was similar to that used at National Standard Wire for many of its products. Actually, the coating was about 10 pct greater than 1 wt pct to compensate for some loss of Zn during the drawing operation.
During electrogalvanizing, soluble, high-purity Zn anodes maintained a relatively constant Zn concentration in the electrolyte. The use of soluble anodes makes it possible to use waste that contains high chloride concentrations (>0-.5 g/L) as a source of Zn because the anode reaction is
Zn → Zn ++ + 2 e-;…………………………………………………………….(2)
with insoluble anodes, the main reaction is evolution of Cl2 gas, which is undesirable.
One of the principal reasons that waste materials such as brass smelter flue dust could not be used as a source of Zn for electrowinning is the chloride content of the waste, which often can be several percent. Insoluble Pb-Ag (0.75 pct Ag) anodes are used for electrowinning, and chlorine gas is evolved. Also, the chlorine reacts chemically with the anodes and destroys them. In addition, chlorine etches the Al cathode and causes the Zn deposit to stick, making stripping of the Zn from the Al impossible. This not only results in a loss of Zn but of the Al cathode as well.
Initial attempts to use the leach liquor with the NH4Cl and H3BO3 additions as electrolyte without any further treatment failed because of rapid Zn anode passivation. Metallic Cu deposited on the anode surface, turning the bright Zn anode black; i.e.,
Zn + Cu ++ → Zn ++ + Cu………………………………………………………….(3)
Fortunately, Cu was easily removed from the leach liquor with Zn dust.
Of all the impurities in the electrolyte, Cl, Cd, Cu, Fe, Ni, and Pb, only Cu was found to be a problem. The behavior of Ni is similar to that of Cu, but electrolytes containing Ni did not show rapid anode passivation. However, after extensive electrogalvanizing in the same electrolyte, there was some anode darkening, indicating that Ni was probably behaving similar to Cu and was cementing on the surface of the soluble Zn anode.
Electrogalvanizing, like all electrolytic processes, needs an addition agent, usually an organic, to smooth or level the deposit. Addition agents also tend to counteract or negate the effect of certain impurities. In this study, licorice was used to smooth the deposit because it was the addition agent used at National Standard Wire.
In several experimental electrogalvanizing tests, the concentration of licorice in the electrolyte was varied from 0 to 1.0 g/L. The optimum concentration of licorice was found to be 0.3±0.2 g/L to give a smooth level deposit. From zero up to the desired range, Zn deposits were rough and dendritic, and strangely enough, above the desired range, the deposit again became rough, dendritic, and darker in color.
In addition to the effect of licorice on the smoothness of the Zn deposit, It also had an effect on orientation; Properties such as corrosion and formability vary markedly with the crystallographic orientation of the Zn deposit. For example, a Zn deposit with predominately (002) orientation (basal plane parallel to the substrate) will deform more readily than would one with a predominate (110) orientation (plane perpendicular to the substrate) since deformation occurs mainly by slip on the basal plane for metals such as Zn. Also, corrosion currents measured on Zn single crystals were smaller for (002) planes (81 µA/cm²) than for (110) planes (261 µA/cm²). Deposits with predominate crystallographic orientations other than (002) and (110) or with mixed orientations would be expected to behave somewhere between these two extremes.
The orientation of the Zn deposited at 600 mA/cm² for 5 min changed with increasing concentrations of licorice in the electrolyte. The relative intensities of the various planes were determined by X-ray diffraction for comparison, but very precise values were not possible owing to the rounded or irregular nature of the plated surface. The Zn coatings obtained without any licorice addition were characterized by high (112) and (101) orientations at ambient temperature. As the concentration of licorice in the electrolyte increased, the predominant orientation changed from a mixture of (112) and (101) to (101) and finally to (110). The amount of licorice needed to cause the shift to (110) orientation increased as the ZN concentration increased, 0.5 g/L for 155 g/L Zn and 0.2 g/L for 90 g/L Zn at ambient temperature. Owing to the roughness of some deposits, the data may not be as definitive as if they had been done on smoother deposits. When plating at 60° C, a predominant (103) orientation was obtained without the presence of licorice, and it changed to (110) with licorice present in the bath, which was similar to the results for deposits obtained at ambient temperature.
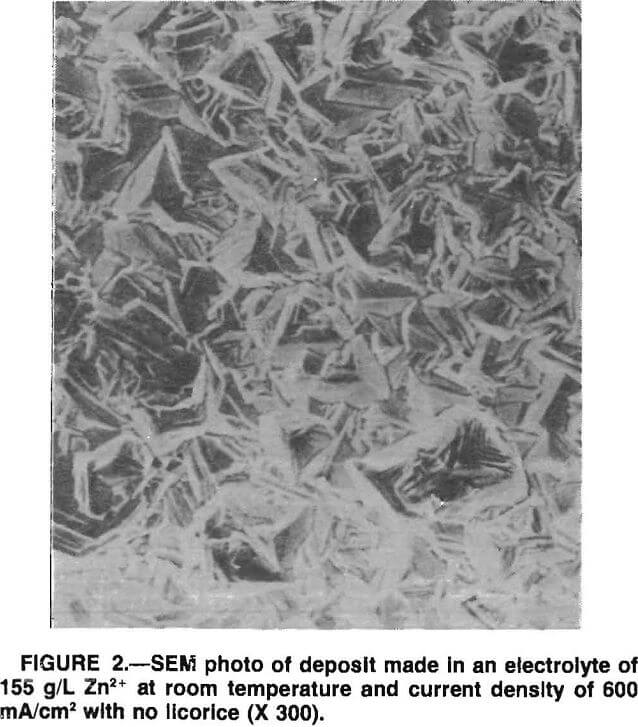
The SEM micrographs showed that the well-defined Zn crystals formed in the absence of licorice (fig. 2) changed into a smoother, more rounded deposit with the addition of licorice. The faceting kept decreasing, and voids or porosity were present as more licorice was added (fig. 3). The results were similar for 155 and 90 g/L Zn electrolyte except that the voids were considerably less evident for lower Zn concentration with the same amount of licorice present. The difference probably was due to a lower electrolyte viscosity, which made the detachment of hydrogen bubbles easier in 90 g/L Zn electrolyte.
When the plating temperature was increased to 60° C, the solution without licorice gave a nodular growth for
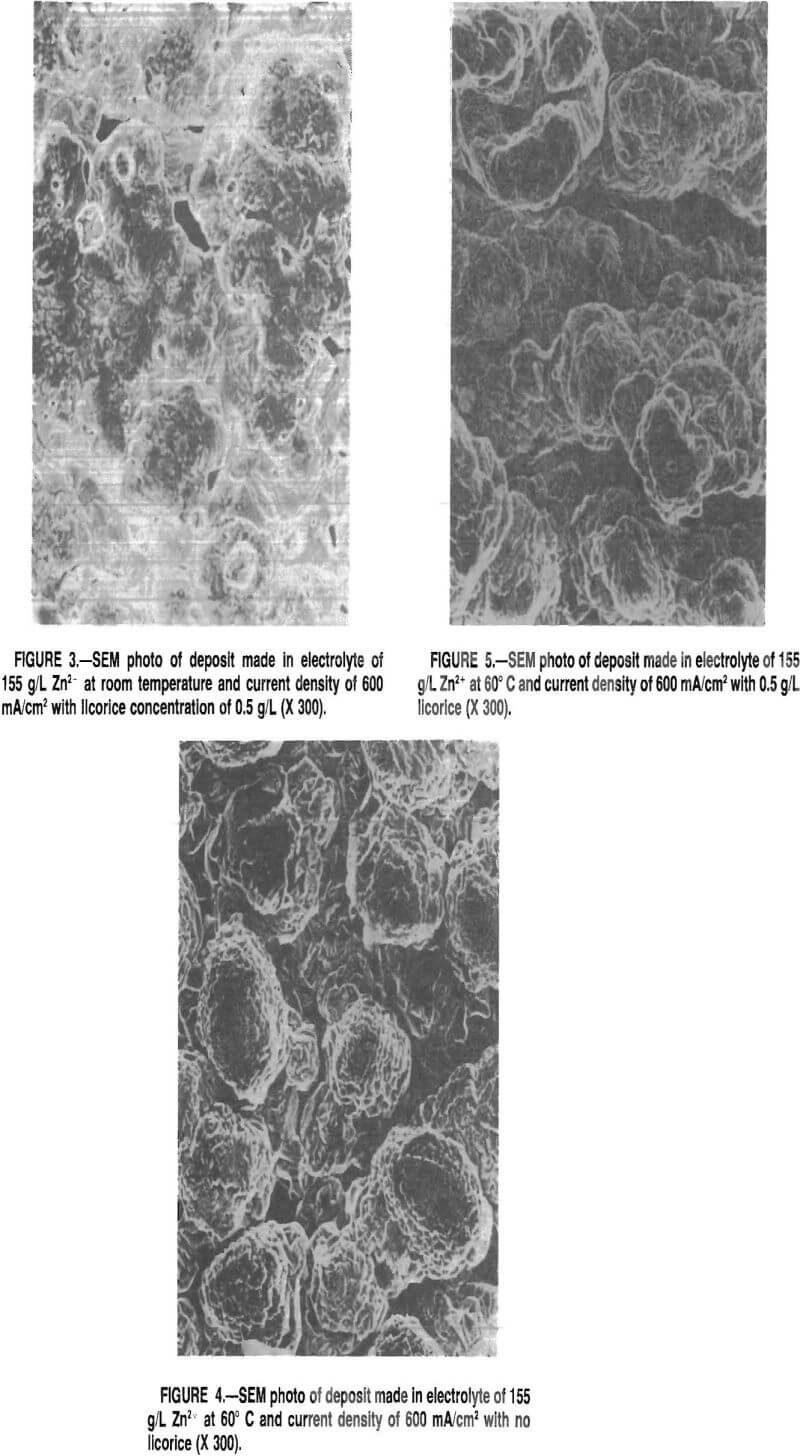
155 g/L electrolyte (fig- 4). As the licorice concentration increased, the number of protrusions increased, and at 0.5 g/L licorice, the density of the protrusions gave the deposit a furrowed appearance (fig. 5). The deposits made in 90 g/L Zn electrolyte were smooth but some small nodules formed. The microscopic roughening and nodulation at high temperature was not expected, and the exact reasons are not completely understood. However, it appeared that the roughness of the deposits was associated with the formation and detachment of the H bubbles on the cathode, and was influenced by factors such-as the viscosity of the electrolyte, surface tension, temperature, and other related parameters.
An initial test indicated that the microhardness of the deposits increased as the licorice concentration increased and, for similar licorice contents, was harder for deposits made at ambient temperature than for those made at 60° C.
Drawing
Table 3 gives the drawing force versus die angle for the commercial 2.26-mm-diameter industrial electrogalvanized steel wire undergoing the four reduction ratios on the laboratory draw bench. In all cases, the 5° die required less force and was closer to optimum than was the 10°
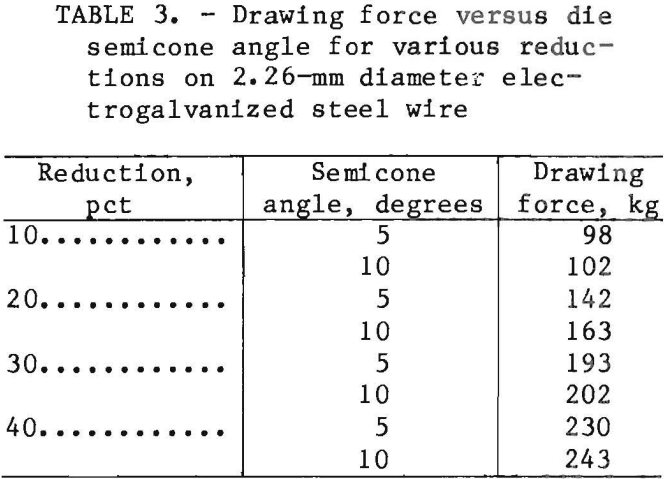
die. Thus, subsequent studied were conducted with 5° dies.
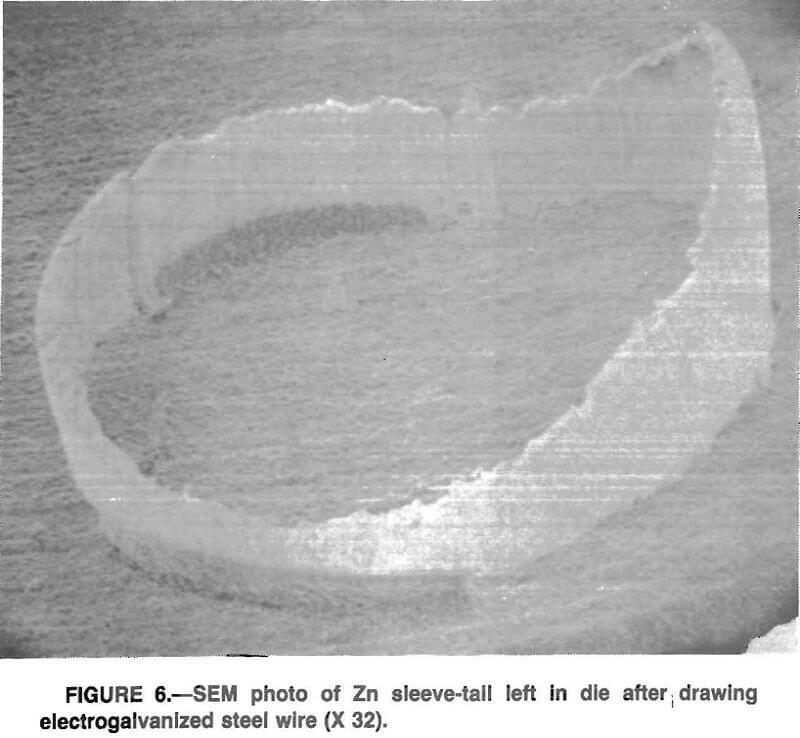
Next the study focused on the nature and mode of the Zn loss that had been typically observed. While sleeve backflow and shaving were clear possibilities, it was also deemed possible that the brittle-natured, hexagonal close-packed (hep) Zn could simply be spalling or fracturing from the steel substrate.
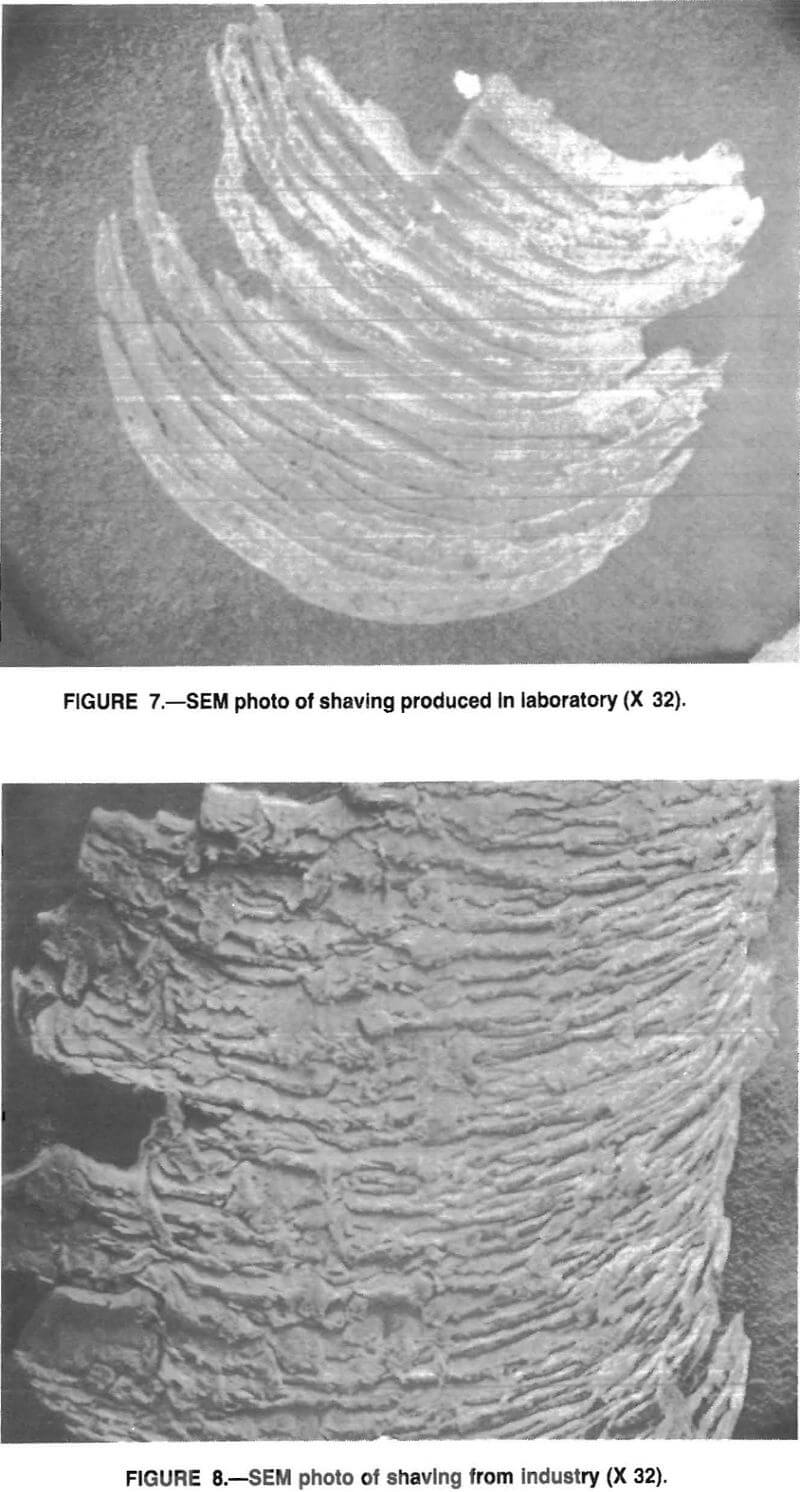
A variety of drawn spacimens was examined under the electron microscope and no evidence of a cracking or spalling mode was observed. Instead, specimens, such as those in figure 6, show the sleeve tail left in the die after drawing a small, 0.10-m length of wire. Figure 7 shows a typical Zn fragment recovered from the lubricating oil; it exhibits clear evidence of a surface shaving. Figure 8 is a fragment of Zn from a commercial drawing operation and exhibits nearly identical shaving features.
As mentioned previously, a significant variable in the forming characteristics of Zn electroplated steel wires is the crystallographic orientation of the Zn coating. For hep metals such as Zn, deformation occurs mainly by slip on the basal planes when deformed at room temperature. If the basal planes are parallel to the wire axis, Zn should appear to be weak and will deform easily. The greater the difference between core and
case strength, the more predominant shaving or backflow will be. Thus, orientations favoring Zn deformation will increase the strength difference and may cause more shaving. It is postulated that a basal-plane-parallel-to-the-wire- axis orientation will exhibit increased shaving but reduced drawing force.
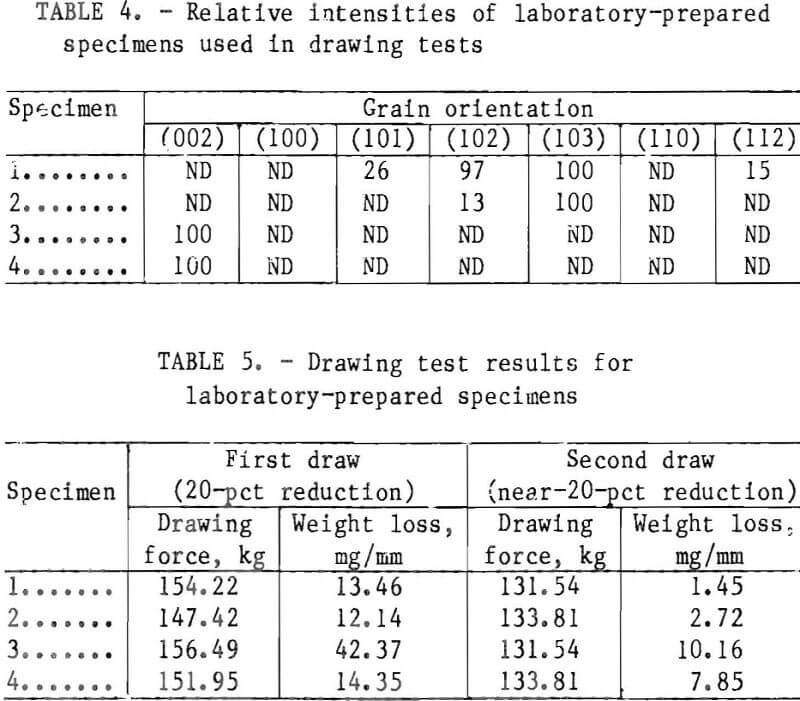
Tables 4 and 5 show the results of a limited series of tests, reporting orientation, weight loss, and drawing force for a 20-pct reduction and similar data for a subsequent near-20-pct reduction- Drawing force showed no significant change, but the weight loss was greater for the basal-parallel texture (002).
Corrosion Testing
The use of the salt-spray cabinet for corrosion studies was not reliable because the data obtained were not reproducible. Further study of ASTM standard B117-73 indicated that salt-spray corrosion tests are not recommended for research purposes. Therefore, Tafel line extrapolation and polarization resistance measurements, both direct current (dc) electrochemical techniques were employed.
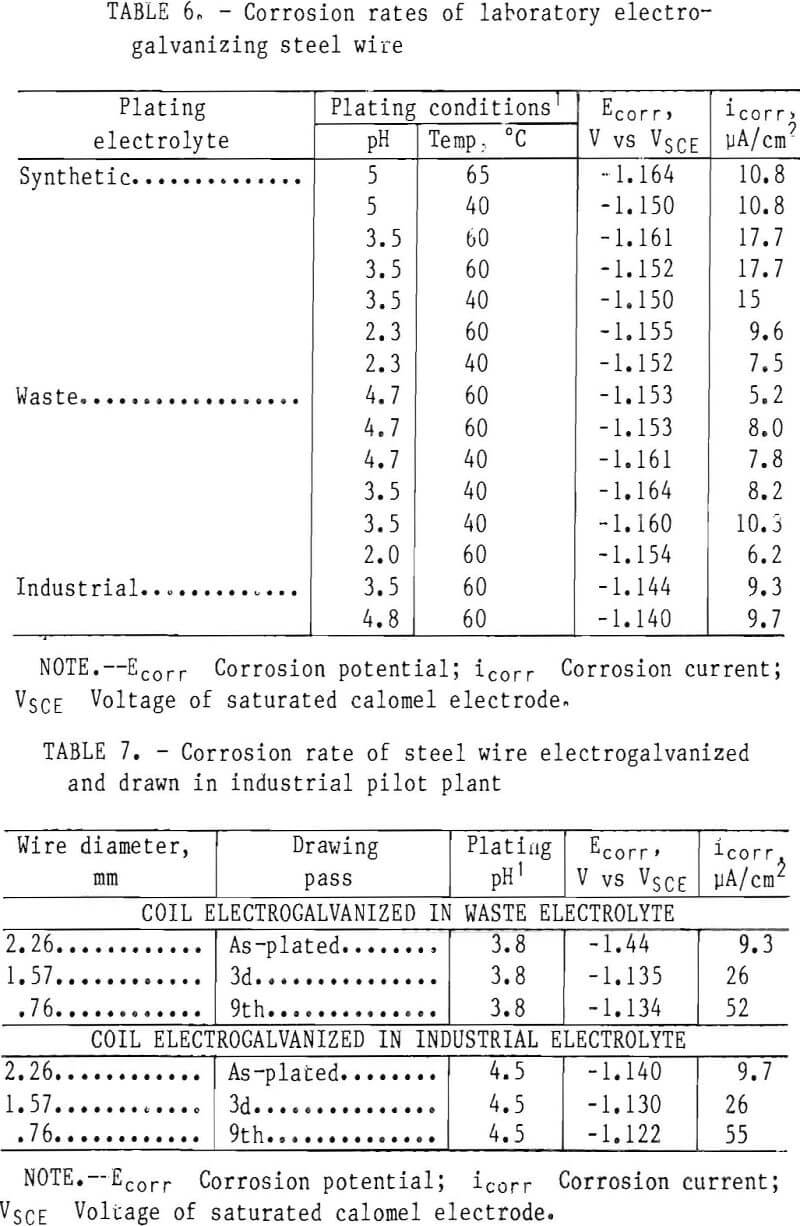
Table 6 shows the corrosion rates obtained by electrochemical measurements for wire plated in electrolyte prepared from brass smelter dust and in synthetic electrolyte. Comparison is also made with an industrial electrogalvanized wire product.
The electrochemical data too are somewhat erratic. For the most part, the plating temperature had only a marginal effect on corrosion current. Electrogalvanizing causes resistance heating of the electrodes, the amount depending on the conductivity of the electrodes, and, subsequently, the electrolyte. An electrolyte temperature of 60° C is used by one of the country’s largest electrogalvanizing wire producers. That temperature must be maintained by cooling, which is usually accomplished by passing the hot electrolyte through a heat exchanger.
As with electrolyte temperature, it was difficult to correlate electrolyte pH with corrosion current. At a comparable pH, the values of corrosion current for the wire electrogalvanized in the waste electrolyte were somewhat lower than for the wire electrogalvanized in the industrial electrolyte.
The results of the electrochemical corrosion tests on the as-plated and drawn wire from the industrial pilot-plant run are given in table 7. It should be noted that these results were obtained approximately 1 month after plating and that the as-plated surface can change significantly after long exposure to air.
Again, corrosion current was somewhat lower for the wire electrogalvanized in the waste electrolyte than for the wire plated in the industrial electrolyte, indicating that the impurities in the waste electrolyte did not have a detrimental effect on the corrosion rate. Before it can be stated with certainty that the impurities in the waste electrolyte do not adversely affect the corrosion properties of the electrogalvanized wire, long-term exposure tests will need to be made to verify the laboratory electrochemical results. (Long-term tests were not
performed on electrogalvanized wire, but they are being performed on electrogalvanized sheet at the present time.) Prediction of long-term corrosion results from short-term laboratory tests has always been a problem. During this research, a very promising method has been developed that uses alternating current (ac) to measure the electrochemical impedance of the corroding specimen. For measuring corrosion rates, this ac technique appears to be far superior to the two dc techniques used for most of this research. Preliminary correlation with 3-month on-vehicle tests has been quite good, but several more months of on-vehicle exposure will be required before a final decision can be made.
The substantial increase in corrosion current after drawing is probably due to the energy imparted to the wire during drawing and the contamination of the surface with steel particles from the die and perhaps the die lubricants.
Cyclic Voltammetry
Chemical analysis can be used to determine the concentrations of most of the inorganic constituents in the electrolyte, but it is usually not possible to determine the concentration of the active organic species necessary for obtaining a smooth deposit. The amount of organic constituent is critical because it is only effective in a very narrow range: too little results in rough deposits and too much can cause significant losses in current efficiency and other problems. The cyclic voltammetry method used in this study was a modified version of that developed by Wang, O’Keefe, and James for evaluating electrolytes prior to Zn electrowinning.
The use of cyclic voltammetry proved to be one of the most successful parts of this work and enabled us to do what was virtually impossible before: to monitor the concentration of the active organic species in the electrolyte during electrolysis. The technique proved to be effective for determining the amount of licorice necessary to smooth the deposit while maintaining the current efficiency at a high level.
Figure 9 (curve 1) shows the current-potential relationship observed on a steel cathode in a synthetic ZnSO4 electrolyte containing 130 g/L Zn²+, 12 g/L H3BO3, and 18 g/L NH4Cl at 60° C and pH 3.6. The scan is initiated in region A, showing the initial current due to hydrogen reduction. At -0.995 V, the current begins to increase owing to cathodic Zn ion reduction. At point C (50 mA/cm²), the scan direction is reversed and the current decreases to the reversible potential for Zn in this medium, which is -0.986 V.
Curve 2 is obtained when 0.3 g/L of solid licorice is dissolved in the same synthetic ZnSO4 electrolyte. Once again, in region E only the hydrogen reduction current is observed. This current is
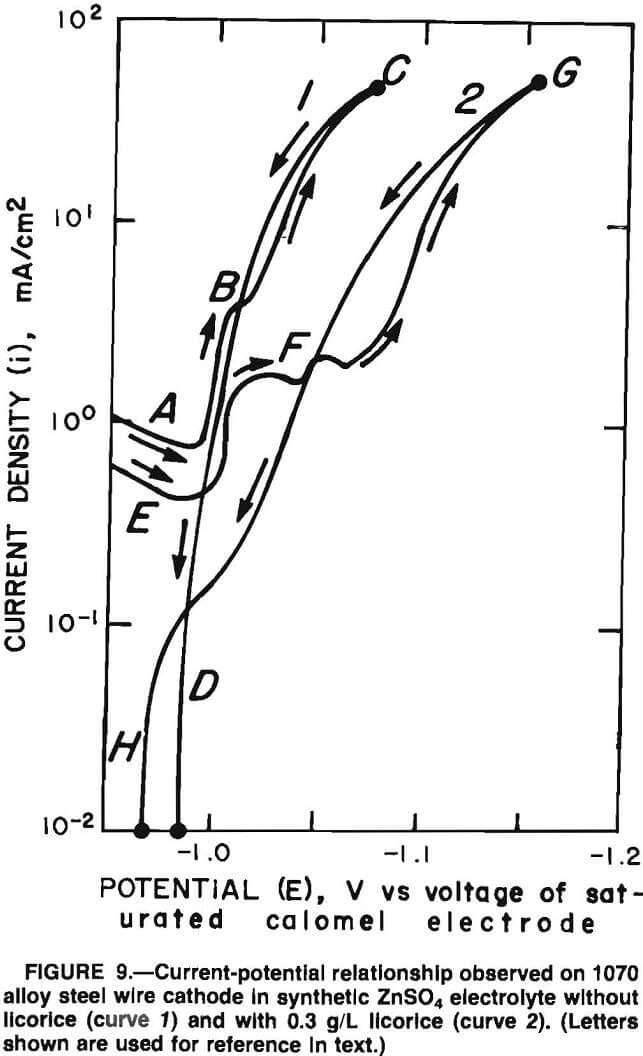
much lower than that observed in the absence of licorice. The total current begins to rise at -1.000 V but rapidly reaches a limiting plateau at about -1.015 V in region F. This region is more pronounced than the shoulder seen in region B in curve 1. This limiting effect that licorice has on the Zn ion reduction reaction causes the potential to be more negative at point G than at point C. The polarization effect by the licorice additive is considered to be beneficial since deposits are “leveled” by its presence.
After reversing the scan direction at point G on curve 2, the current decreases to point H (on abscissa) the reversible potential, which is -0.967 V. This value is 19 mV more anodic than that observed in curve 1 at point D (on abscissa). Thus, licorice also causes a displacement of the reversible potential for Zn.
Figure 10 shows the current-potential relationship for waste electrolyte prepared from the brass smelter flue dusts with NH4Cl and H3BO3 added. Note the similarity of this polarization curve to that obtained with licorie present in the synthetic electrolyte (figure 9, curve 2). There are certain differences, however, such as the current plateau in region B. The overall effect is a polarization at 50 mA/cm² versus curve 1 in figure 9. The potential at point C is -1.130 V. The reversible potential at point D in figure 10 is -0.955 V, which is more anodic than the values obtained in synthetic electrolyte. Table 8 summarizes the values. The Zn reduction potential is EredZn²+, and the reversible potential is Erev. The potential at the point of scanning direction reversal is E(50 mA/cm²).
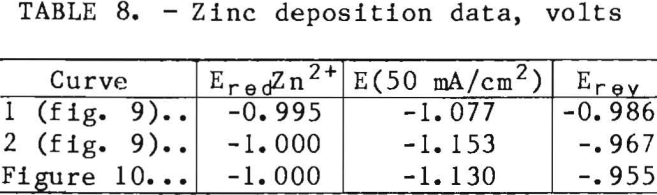
Note.—E Potential at which scan direction is reversed; Ered Zinc reduction potential; Erev Reversible potential.
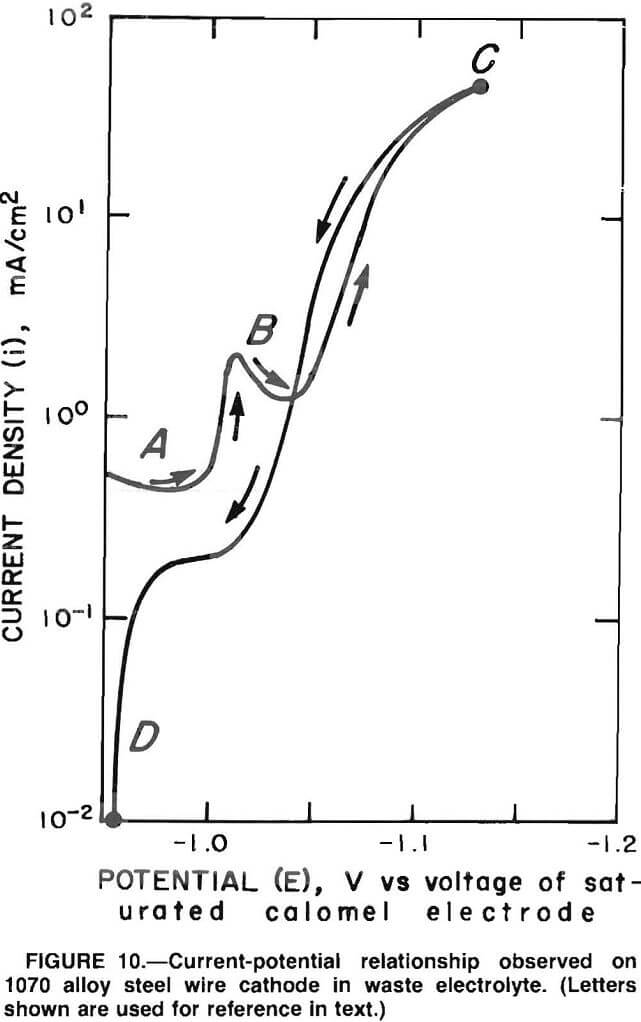
The shape of the polarization curve and the shift in the potential with the waste Zn electrolyte compared with the synthetic electrolyte suggest that the waste Zn electrolyte contains a polarization or leveling agent. The waste Zn electrolyte is very similar in color to the synthetic electrolyte containing licorice both are amber. Isolation and identification of this polarizing agent from the brass dust would be of benefit to electrogalvanizing technology since it affects crystal growth.
The effects of the organic polarization agents on crystal structure of the Zn deposit can be seen in figures 11 and 12. Figure 11 shows scanning electron micrographs of a Zn deposit from synthetic electrolyte without licorice addition.
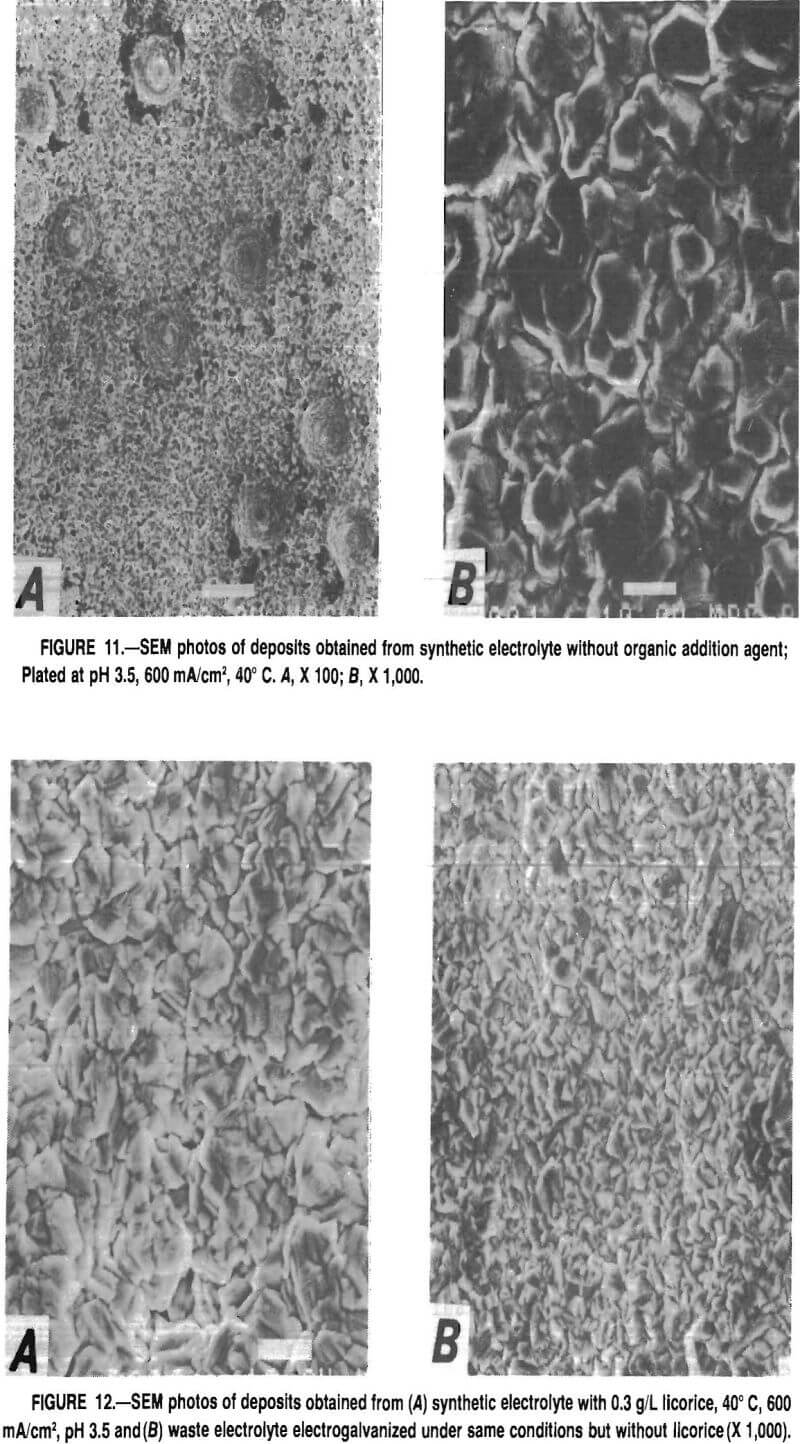
Figure 11A shows that a magnification of X 100 the deposit is pitted; at X 1,000 (fig. 11B) rather large crystals are observed. With addition of licorice or other polarization agents, the pits are not observed. Figure 12A shows that a licorice addition of 0.3 g/L refined the grain size of the deposit. However, as shown in figure 12B, coatings obtained from the waste electrolyte have a much finer grain size. This observation of a finer grained coating obtained from the waste electrolyte correlates with the lower corrosion currents shown in table 7, since fine-grained materials usually corrode at a slower rate than do coarse-grained materials. Overall, it appears that cyclic voltammetry can be used to monitor the active concentration of licorice, or similar polarizing additives, in Zn electrolyte. A good indication of additive content can be obtained by comparing the polarization curve of the unknown electrolyte with those generated from electrolytes containing known licorice concentrations at a fixed temperature and Zn concentration. However, there is no information on the grain-refining ability of the polarization agent. Deposit grain size must be determined by observation.
Conclusions
Brass smelter flue dusts can be a potential source of Zn for electrogalvanizing. During leaching of the dusts with H2SO4, all the impurities (Cd, Cl, Cu, Fe, and Ni) except Pb, which precipitates as insoluble PbSO4, are coextracted with the Zn. Of these impurities, only Cu causes major problems during electrogalvanizing because it coats (polarizes) the soluble Zn anode. Fortunately, Cu is easily removed by cementation on Zn dust. Chlorine, which causes serious problems in electrolyte used for electrowinning, is desirable in the Zn sulfate electrolyte used for eleccrogalvanizing because it increases the conductivity.
Laboratory results indicate that a major problem in the drawing of electrogalvanized steel wire in industry is a loss of the Zn plating material by means of a shaving mechanism. This loss can be reduced by proper selection of drawing parameters; namely, the use of low die angles and larger reductions per pass. Fewer large-reduction passes are preferable to multiple smaller reductions from the viewpoint of both shaving losses and total power consumption.
Structural features of the plating can also markedly influence drawing performance. The crystallographic orientation of the electroplate is quite significant. Grain size, surface texture, and structure characteristics (crystalline versus nodular) of the plating can also influence drawing behavior, lubricant effectiveness, the amount of Zn loss, and the performance of the product material.
Electrochemical corrosion rates of steel wire electrogalvanized in electrolyte prepared from brass smelter flue dusts were lower or at least comparable to the corrosion rates of wire electrogalvanized in relatively pure synthetic and industrial electrolytes.
Of the three different electrochemical methods (two dc and one ac) used to determine corrosion rates, the ac impedance method appeared to be far superior to the dc methods and better able to predict long-term results from short-term tests.
Cyclic voltammetry can be used successfully to monitor the active level of organic addition agents, are critical to any electrolytic process to control deposit morphology. A curve showing current versus potential for an electrolyte with an unknown amount of organic constituents can be compared to curves with a known amount of organic constituents to determine the amount of the unknown.
Demonstration of the use of a waste Zn electrolyte in an industrial pilot plant was successful. These results show that although it is difficult to produce pure Zn from waste sources of Zn oxide, the material is suitable for electrogalvanizing. This allows a more efficient use of waste Zn in the industrial environment.