Search for a consistent theory to explain the relationship between energy input and size reduction in a comminution process has accumulated, over the years, an enormous amount of plant and laboratory data. Although some correlation of these data has been possible for purposes of engineering design and for the advancement of research in fracture, there is still great need of a means of predicting behaviour of a solid when it is reduced in size by mechanical forces.
Theoretical Considerations: Most existing relationships between energy and size reduction of a brittle solid stem from a single, simple, empirical proposition. Although this proposition can be demonstrated by observation and experiment, no theoretical derivation is yet possible. Mathematically, the proposition may be stated as follows:
dE = — C dx/x n………………………………………………………………….[1]
where dE = infinitesimal energy change, C = a constant, dx = infinitesimal size change, x = object size, and n = a constant.
Er = K(σ2 — σ1)…………………………………………………………………….[2]
Er = energy input per unit volume, K = a constant, σ1 = initial specific surface, and σ2 = final specific surface.
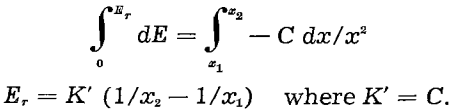
In the size reduction of particles of size x1 to particles of another smaller size, x2, Eq. 2 becomes the well known relation:
Er = K’ (1/x2 – 1/x1)……………………………………………………………….[3]
where K’ is a constant.
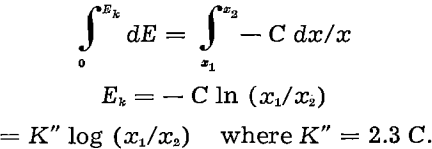
The Kick concept may be expressed as follows:
Ek = K” log x1/x2…………………………………………………………[4]
K” = a constant and Ek = energy per unit volume.
The expression for Kick’s law may be arrived at by again integrating Eq. 1 and in this case assigning a value of 1 to the exponent n.
Bond has lately proposed that since neither Kick’s nor Rittinger’s hypotheses seem correct for plant design work, an energy-size reduction relationship somewhere between the two would be more applicable. The fundamental statement of Bond’s work index equation is derived from Eq. 1 by considering the exponent n to have a value equal to the arithmetic average of 1 and 2, i.e., 1.5. Thus,
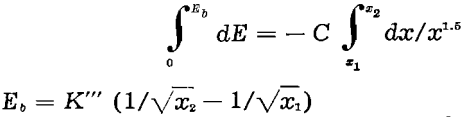
where K'” = 2 C.
Bond considers the total work, Wi required to break material from theoretically infinite size to a size modulus, P, which is the 80 pct passing size on a screen analysis plot. Therefore:
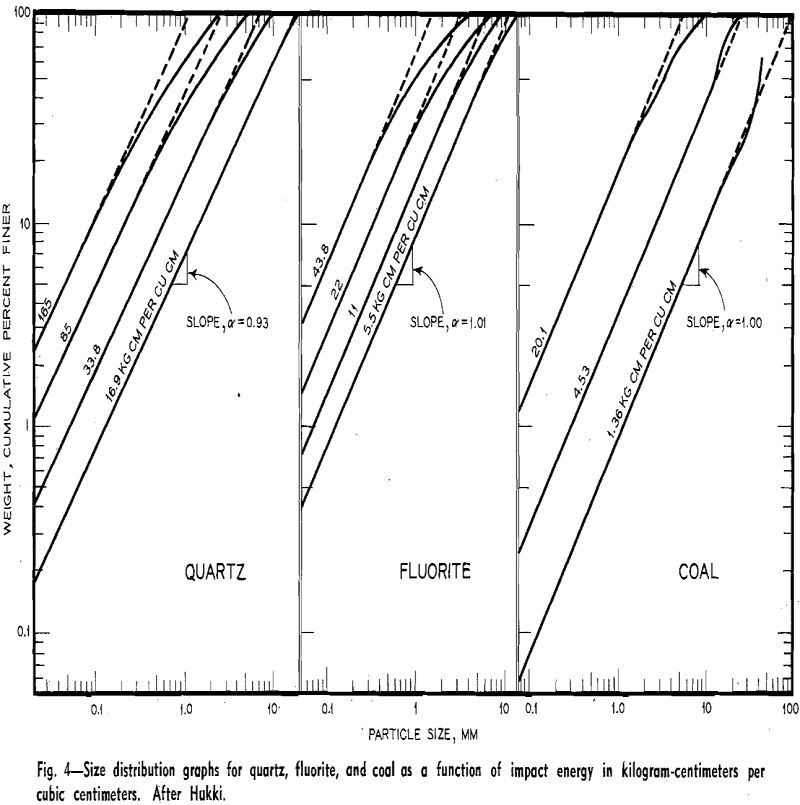
An illustration of the use of two numbers to characterize size distribution is given by Schuhmann as follows:
y = 100(x/k)α……………………………………………………………..[6]
where y = weight percent finer than size x, x = size, k = size modulus (a constant) for a given size distribution, and α = a constant.
For elastic impact such a simple analysis as is given above cannot be made, for the momentum of complicated forms of traveling elastic waves must be considered. It has been shown however, that in impact of a simple elastic system the maximum fraction of kinetic energy absorbed as strain energy is dependent mainly on the geometry of the system and only slightly on the total initial impact energy.
In the above derivation it has been assumed, for convenience, that the material broken was of uniform size, xm. The derivation is equally simple if the original material is considered to have a distribution of sizes.
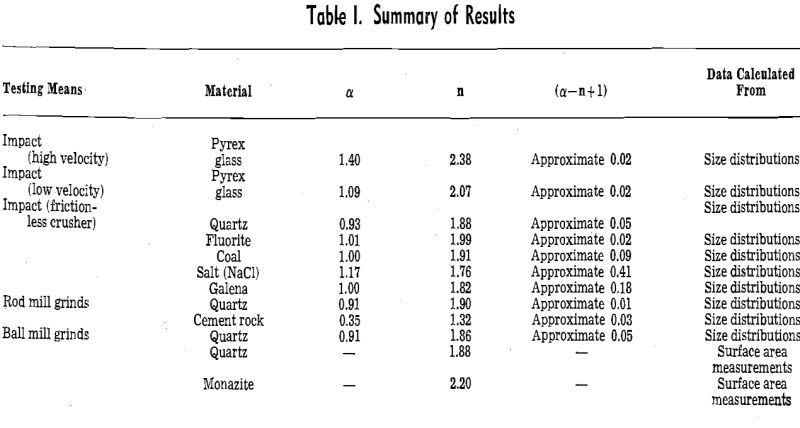
Experimental Results
A. Dropping Weight and Projectile Impact Tests: In a previous work impact tests at high and low velocity were made on similar specimens of pyrex glass. The high velocity tests were carried out by firing a mild steel projectile weighing about 12 g from an air gun at cylindrical glass specimens 2×1 1/8 in. Low velocity impact tests were made on similar specimens by means of a mild steel dropping hammer weighing about 3.7 kg.
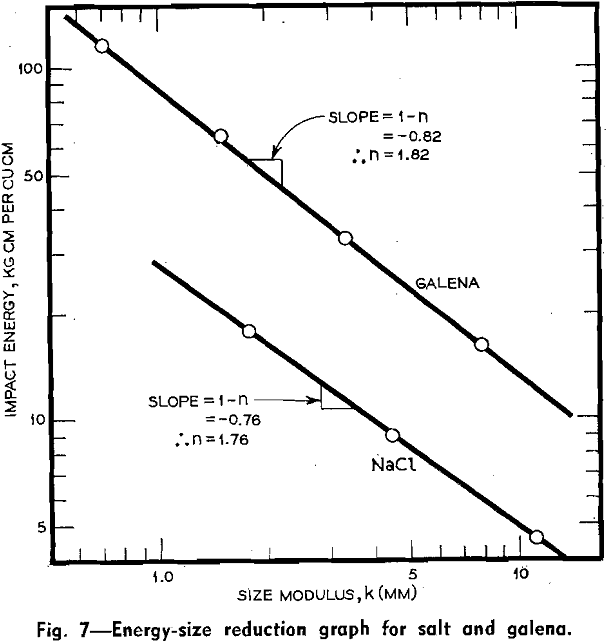
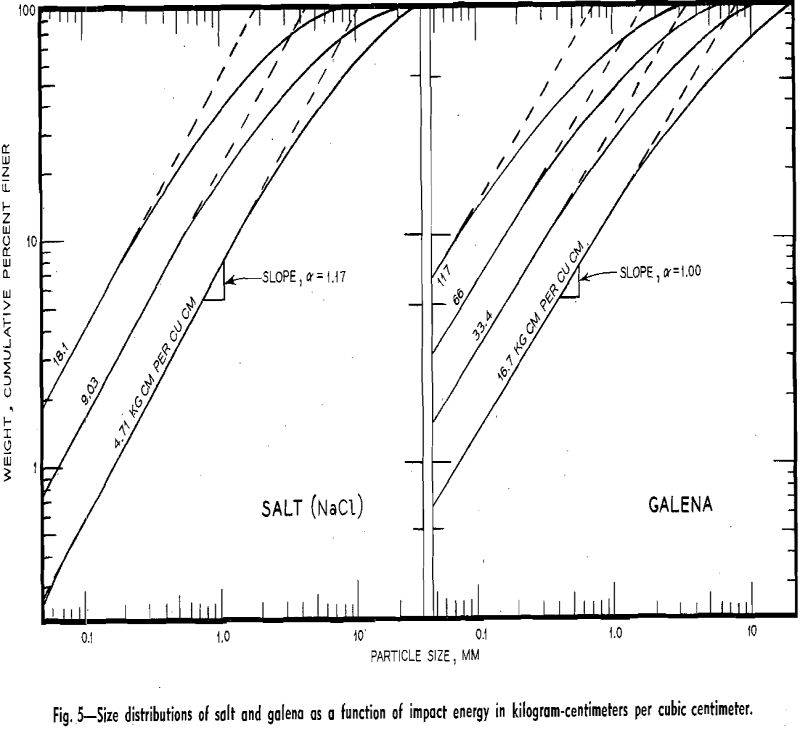
B. Pendulum Impact Tests (Frictionless Crusher): Hukki has presented experimental work on the size reduction of a number of minerals by means of an apparatus called the Frictionless Crusher. Results from this work are well suited to analysis along the lines outlined in the introduction of this investigation, since the size reduction of these minerals has been given in relation to energy input from constant mechanical conditions.
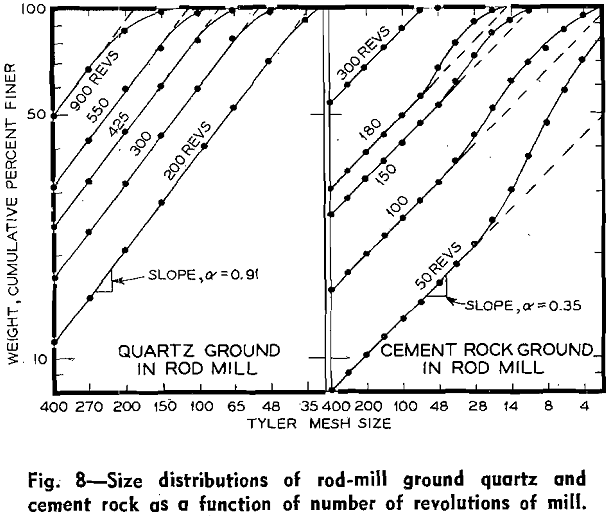
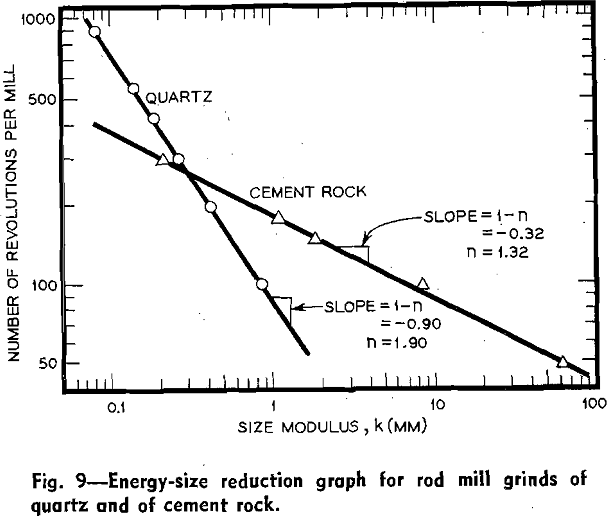
C. Rod Mill Grind Tests: the size distributions resulting from grind tests of quartz (—3/8 in. + 6 mesh) and of cement rock (—3/8 in. + 6 mesh) for various numbers of revolutions in a laboratory rod mill. The rod mill, of stainless steel, was 10 in. diam and 12 in. long and turned at 54 rpm. Lifter bars were attached inside the mill to prevent slipping of the grinding charge. All tests were made wet at 60 pct solids.
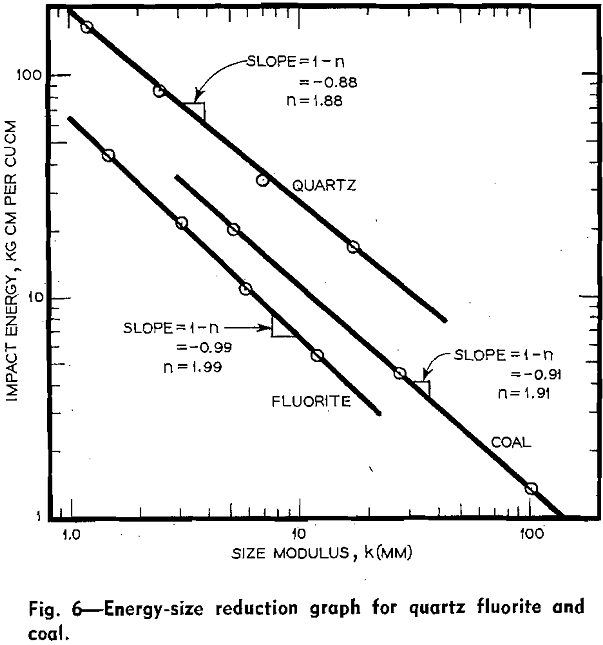
D. Ball Mill Tests: the results of ball mill grinding of quartz (—3/8 in. + 6 mesh) with similar equipment and under the same conditions as given for the rod mill tests. A log-log plot of energy input (proportional to the time of grind) vs size moduli is included. The log E — log k curve is a straight line and the calculated value of n is 1.86.