Table of Contents
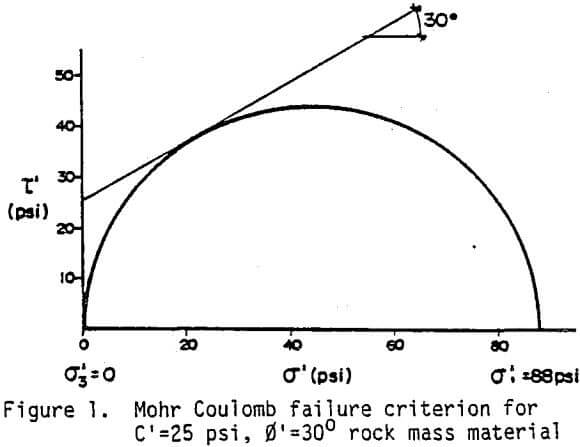
Factors Controlling the Strength of Weak Rock Masses: For the purposes of this paper a weak rock mass is defined as any rock mass in which the effective shear strength parameters are less than:
- effective cohesion, c’ = 25 psi (0.2 Mpa)
- effective friction angle, ∅’ = 30°
using the Mohr Coulomb failure criticism. This would be equivalent to material (refer Figure 1) having a macro sample unconfined compressive strength of less than 100 psi (approx. 0.7 MPa), a strength normally associated with soil like materials.
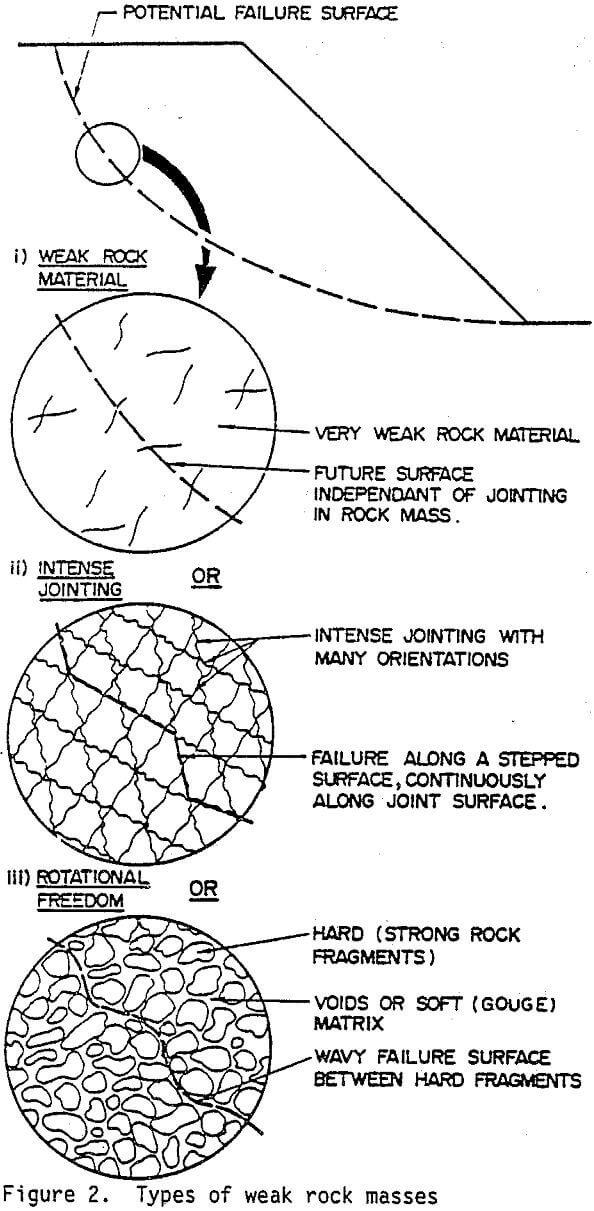
Rock masses, with such low strengths, may occur as a result of a number of independent factors as illustrated in Figure 2.
- Weak rock material (Figure 2.(i)
Where the sole reason for a weak rock mass strength is the low strength of the rock material it is more properly classified as having a soil like strength. An appropriate classification for rock and soil, based on simple tests, from which an estimate can be made of the uniaxial compressive strength is given in Table 1 (Jennings and Robertson, 1969). Extremely weak “rocks”, or more properly materials with a soil strength but a rock appearance, can be tested in the laboratory to determine the shear strength. Such material may be referred to as either soils or rocks but use of the strength qualifies S1 to S5, as indicated on Table 1, serves to indicate that their strength falls into the soil classification.
- Intense Jointing (Figure 2(ii))
Where the jointing is sufficiently intense and has a sufficient range of orientations, a stepped failure surface can develop through the mass, at any orientation, with a resultant low shear strength. Thus while the jointing may be non-isotropic, the shear strength may be considerably less so. The spacing between joints may be sufficiently large that it is impractical to select a laboratory scale specimen which is representative. The difficulty of cutting and preparing a specimen without disturbing the joints and effecting the shear strength of the specimen is an additional impediment to such testing.
- Rotational Freedom (Figure 2(iii))
This form of failure may be illustrated by the failure surface that would form through a gravel pile. The individual rock fragments, which would interlock if they were prevented from rotating, have rotational freedom resulting from the loose packing of the gravel particles. With a high rationality freedom (such as exhibited by even sized marbles in a pile) very low shear strengths result. Rotational freedom increases if the intact rock fragments are equidimensional, rounded and within a matrix of either voids or a very low shear strength (soft) material. An example of a rock mass with very high rotational freedom would be spherically weathered dolerite boulders in a matrix of soft (in-situ weather dolerite) clay. Again it is difficult to cut, prepare and test laboratory sized specimens for strength testing.
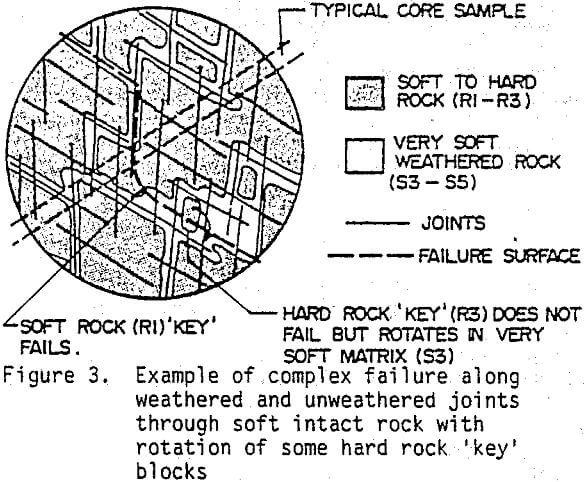
Most often, weak rock masses occur as a result of a combination of each of (i) to (iii) above. Typically a rock material may have weathered to produce a soft rock (R2) or very shift rock (R1) rock material between closely spaced fractures along which more extensive weathering has occurred to produce zones of S3 to S5 strength material. The failure surface is a complex combination of failure through soft intact rock, along weak joints and through very soft (soil like) weathered zones which squeeze and deform to allow harder rock blocks to rotate. Figure 3 is a typical example.
Shear strength of fracture and weakness planes
The difference in mechanical behaviour between smooth and rough rock surfaces is illustrated in Figure (1), (a) and (b), in which shear stress is plotted against shear displacement and against normal stress, respectively.
The curve A in Figure 1a, represents a typical behaviour of a solid rock substance in a tri-axial compression test under relatively low pressure. In such a tests, after an approximately linear-elastic behaviour, the rock breaks in a brittle manner, and one or several continuous but irregular discontinuities are formed. If the test is continued after the peak under the same confining pressure, the strength measured will be that of the freshly created irregular rock surface. Eventually, for very large shear displacements along these new fracture surfaces, the irregularities will be overriden and a sufficient amount of detrital material created, in order to bring the strength to its lower residual value, denoted by angle ∅r in Figure 1 b.
In the case of very rough surfaces such as extension joints or irregular shear faults, interlocking of surface irregularities causes the sample to behave in an approximately linear-elastic manner for small displacements. At a given displacement, the peak shear strength of the surface is overcome as a result of overriding or shearing through of the interlocking irregularities and a rapid drop in shear strength occurs as displacement is continued (curve B in Figure 1 a). Eventually, after a much larger displacement, when the effect of the irregularities has practically disappeared, a residual strength value is reached. The peak shear strength of such irregular surfaces corresponds to the immediate post-peak strength of the rock substance.
In the case of smooth surfaces (curve C in Figure 1 a), such as those in which the peak strength has already been exceeded during previous sliding, the shear strength increases rapidly with displacement until the residual strength value is reached.
Plotting the values of peak and residual strengths for various applied normal stress levels, one obtains the curves B and C illustrated in Figure 1 b, which are typical of the behaviour of rock surfaces. In the case of the peak strength (curve B), a small value of cohesion c may be present due to cementing of the surfaces. The curve relating shear strength and normal stress for rough rock surfaces is generally non-linear as illustrated. This curve is steeply inclined at low normal stresses as a result of the interlocking of surface irregularities. Because of the high strength of the rock substance from which these irregularities are formed, shear displacement at low normal stress takes place as a result of overriding or dilation in which the irregularities move over one another and the total volume of the specimen is increased. As demonstrated in the following, the slope of the curve at low normal stresses can be approximated by the angle (∅f + i) where ∅f is the friction angle of the material surface and i is the average-angle of incidence of the surface irregularities to the direction of shearing. As the normal stress increases, the dilation of the specimen becomes more and more difficult, and fracturing or shearing through the interlocking surface irregularities commences. Eventually, at a relatively high normal pressure, the shear strength of the surface is controlled entirely by the shearing through of these irregularities and the curve approaches the failure envelope of the rock material (curve A).
In the case of the smooth surface, (curve C, Figure 1 a and b), the strength behaviour is defined by the residual friction angle ∅r, and the cohesion is for all practical purposes zero.
Several important conclusions follow from these considerations, which are based on a considerable amount of experimental evidence:
- Peak strength of a rough rock surface, such as a surface formed by tensile splitting or shearing of solid rock, is located somewhere between the peak strength of the solid rock and the strength of a smooth plane surface of the same rock.
- Immediate post-peak strength of solid rock corresponds approximately to the peak strength of the freshly created fracture plane.
- After large or repeated shear displacements, when the asperities in the original rough surface are ground smooth, and when a detrital material is formed, the strength will decrease to the lower residual value.
- At a sufficiently high normal pressure (σ = σT, Figure 1b), called also “brittle-ductile transition pressure”, the strength due to shearing of asperities in the created failure surface will become approximately equal to the strength of the rock substance and there will be no drop of strength immediately after failure.
Frictional properties of plane rock surfaces
Smooth polished surfaces of mineral specimens will give a variety of angles of surface friction depending upon the degree of smoothness and the surface moisture conditions. In nature, however, rock surfaces are rarely monominerallic or highly polished, and flat surfaces are seldom encountered. Investigations made by Patton, suggest that, with large displacements, initially polished rock surfaces become scratched and gouged and the angle of frictional sliding resistance increases from some initial low value to a value, ∅f, which is similar to that obtained when shearing an unpolished planar surface. On the other hand, if the original surface is quite rough, it becomes progressively smoother with increasing displacement and the angle of frictional sliding resistance decreases from some initial high value to some lower value, ∅r, the angle of residual sliding resistance. Usually, the two angles, and ∅r, are of similar magnitudes. According to the available experimental evidence for most rocks (with the exception of clay shales) the value of ∅f = ∅r varies commonly between 25° and 35° as a function of the rock type and the state of the contact surfaces, which may vary with the amount of shear displacement.
An investigation showing clearly how ∅f depends on the state of joint surfaces and the amount of displacement, is that carried out by Ripley and Lee. For artificial surfaces in sandstone and siltstone, they found the following friction values: (1) Smooth (lapped) surfaces: ∅f = 25°, (2) sandblasted surfaces: ∅f = 30°.
In addition, the value of ∅f was deduced also from the direct shear tests carried out on natural joints with irregular-contact surfaces, by subtracting the effect of dilation from the total shear strength measured in the tests. The results obtained were: (3) natural joints (from peak strength): ∅f = 35°, (4) Natural joints (from residual strength): ∅f = 30°.
The larger ∅f value at the peak strength, compared to that after large displacements, may be explained by the different amounts of shear debris present in the two cases: ∅f = 35° corresponds to an incipient shear failure with very little detritus, while ∅f = 30° reflects the rolling friction of the rock detritus. Figure 2 illustrates schematically this type of behavior. It shows that ∅f cannot be expected to be equal to ∅r, because the former corresponds to a small displacement along a virgin joint, and the latter to the shear of debris covering the joint after a large displacement has occurred. Consequently, the final choice of ∅f in a practical case should be made by considering not only the state of the joint walls, but also the amount of expected displacements.
Nevertheless, from a large amount of published data one can conclude that for the same surface finishing, the variation of the friction angle ∅f is not great for a great majority of rocks and can for practical purposes be assumed correctly on the basis of the available published data. In a doubtful case, its value should be determined by direct shear tests. Usually small-scale laboratory tests with roughly saw-cut surfaces, carried out within the same range of humidity and normal pressures as those expected in the field, will be sufficient for all practical purposes. In interpreting such tests, one should always keep in mind that ∅f is not a constant but may vary with the shear displacement, similarly as shown in Figure 2.
Strength properties of irregular rock surfaces
The shear behaviour of natural irregular rock discontinuities has attracted attention of a number of workers. Many different types of surface and rock have been tested by large scale in-situ tests. However, because of high cost of such tests, a major portion of the available experimental evidence on the shear behaviour of irregular rock surfaces originates from small-scale direct shear and triaxial testing of artificially produced rock specimens. In order to obtain closely fitting irregular surfaces, two different methods have been used. Some investigators have carried out direct shear tests on extension fractures produced in. the laboratory by splitting solid rock specimens (7,26). In some other cases, after solid specimens have failed by shear fracture in triaxial or direct shear apparatus, testing was continued to study sliding on the fractured surface.
Mogi and Byerlee performed high pressure triaxial tests on shear-induced fractures in a great number of different rocks. The test results obtained with such a method have induced both of them to conclude that for dense rocks at high normal pressures, the shear strength of irregular surfaces depends relatively little on the rock type, being much more affected by the irregularities in the surface. Since these sesned to be of a similar shape in all such fracture surfaces, the resulting shear strengths fell in a relatively narrow band in the Mohr plot. Mogi, on the basis of his tests, concluded that shear strength of such surfaces could be approximated by a Coulomb straight line with c = o and ∅ = 39°. Later, Byerlee reanalyzed Mogi’s findings and added his own results obtained by a similar method on six different rocks, (two limestones, gabbro, dunite, serpentinite and granite) all relatively strong and dense. The range of normal pressures attained in his tests was from 10 to 700 MPa.
For the Byerlee’s curved envelope, representing the average of all these tests, Ladanyi and Archambault found that it could fairly well be expressed by the following two empirical equations (with σ and τ in MPa):
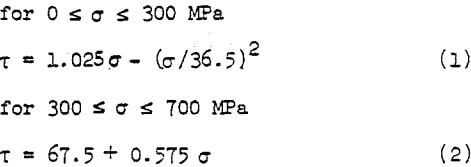
Assuming an average value of uniaxial compression strength Co = 275 MPa for the six rocks, Byerlee’s failure envelope can be written in a dimensionless form:
τ/Co = σ/Co (1.025 – 0.207 σ/Co)…………………………………(3)
Barton, on the other hand, has carried out a large number of direct shear tests on extension-induced fracture surfaces, using a relatively weak artificial material with Co ranging from 70 to 830 kPa. Within the range of normal pressures covered in the tests, (0.015 ≤ σ/Co ≤ 0. 25) he obtained shear strengths considerably higher than those reported earlier by Mogi and Byerlee for shear-induced faults. Higher strengths for extension fractures have also been reported by Archambault.
Methods for predicting shear strength of indented rock surfaces
In 1966, Patton showed that the shear strength of an indented joint surface can be represented by the equation:
τ = σ tan(∅f + i)………………………………..(4)
where σ and τ represent the normal and the shear stress in the plane of failure, ∅f is the basic friction angle for a plane joint surface, and i is the average angle of deviation of ascending planes of the irregularities in the direction of shearing. This equation, deduced from static considerations, is valid as long as there is no failure of the asperities in the overall joint plane. Patton’s observations show also that, at larger pressures when the asperities start breaking, the angle i will gradually decrease, but the shear strength will then also become.a function of the shearing resistance of the asperities. He proposed to approximate the resulting curved failure line by two straight lines, the first steeper one being given by Eq. (4) and the second, for higher pressures, by equation:
τ = Co + σ tan ∅o………………………………………(5)
where Co and ∅o denote the Coulomb strength parameters related to the failure strength of the wall rock at high normal pressures.
The Patton’s simple mathematical model furnishes a good first approximation to the true non-linear failure envelope found in the tests. Its use is particularly convenient for predicting the shear strength of irregular surfaces at low normal pressures, at which Eq. (4) defines, in fact, the tangent at σ = o to the true non-linear failure envelope for the joint. At higher normal pressures, where the use of Eq. (5) is indicated, determination of parameters, Co and ∅o which depend on the strength of asperities, is difficult without additional experimental data.
Several attempts have been made subsequently by various authors to approximate more closely the observed non-linear failure lines for irregular rock surfaces. In these efforts, the approach taken by various investigators was either theoretical or empirical.
An example of the former is the work by Ladanyi and Archambault who developed a shear equation on theoretical grounds, the implications of which in the light of the theory of plasticity was later given by Roberds and Einstein, who also proposed a new comprehensive model for rock discontinuities.
In the latter, empirical approach, adopted by a number of investigators, the Patton’s Eq. (4) is applied to the whole range of normal pressures extending from σ = o up to σ = Co, where Co denotes the uniaxial compression strength of the wall rock, but the angle i in that equation is expressed as a function of normal pressure.
Of the two approaches, the second one is clearly simpler but has some theoretical inconsistencies. It is easy to show, in face, that if any such variable-i type formula, in which the strength of rock substance affects only the value of i, is fitted to the true failure envelope of an irregular surface, it will necessarily yield i-values that are too high. Inversely, if true dilation rates are substituted into such a formula, it will necessarily underestimate the strength of the irregular joint, except at very low normal pressures where the knowledge of the initial i-value is usually quite sufficient.
In the following, the two approaches will be reviewed in more detail.