Strain relief measurement techniques were used to quantify stress in the underground pillar and to compare stress relief to seismic and ultrasonic core velocities. These measurements represent a single point. The procedure for measuring strain relief (Girard and others, 1997) consists of —
- Drilling a hole 152 mm (6 in) in diameter to a pre-selected depth beyond the blasting overbreak zone.
- Centering an EX-size (38 mm [1.5 in]) drill hole concentrically within the 152-mm-diameter (6 in) hole.
- Placing the borehole deformation gauge into the EX hole and noting the orientation of the gauge buttons.
- Overcoring at least 27 mm (1.1 in) on either side of the gauge centerline using a 152-mm (6 in) bit. Strains are measured as drilling progresses past the centerline.
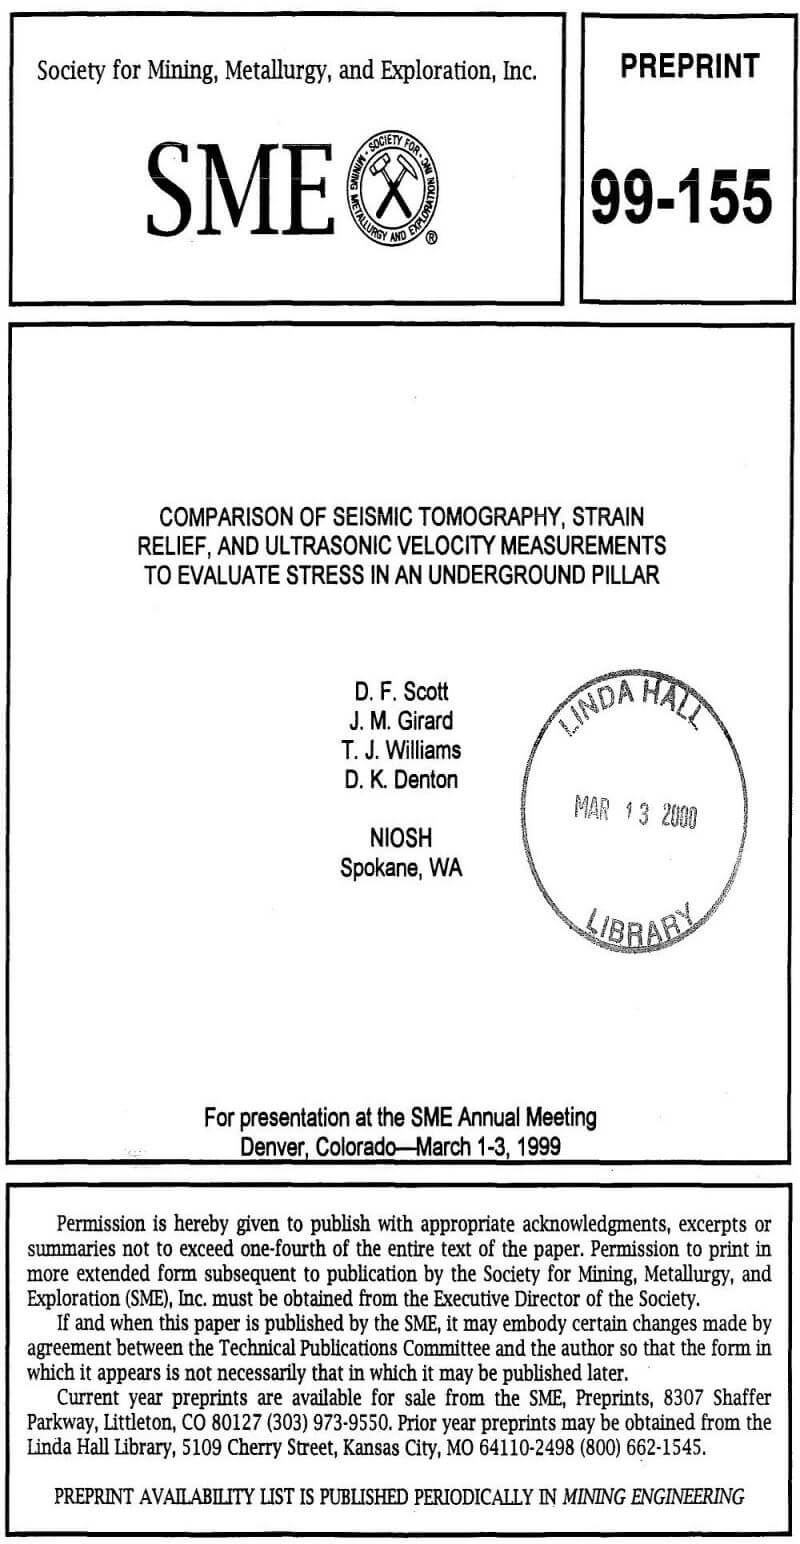
Two holes, 7.6 and 9 m (25 and 30 ft) long, were drilled about 65° apart and nearly horizontal (figure 1). The third hole, 5.5 m (18 ft) long, was drilled at a near-vertical orientation into the back. Because of drilling problems, such as core breaking prematurely, not all strain relief measurements were used, resulting in incomplete horizontal profiles. Therefore, 13 strain relief measurements (from all three holes) were chosen from 24 attempts and averaged. The fractured rock at the drift-rib interface was thought to extend from the interface to at least 5.5 m (18 ft) into the rib. Based on this estimate, about 2 to 4 m (6.6 to 13 ft) of undisturbed rock in the pillar, as well as the fractured area in the rib, was drilled. Measured octahedral normal stress was 37 MPa (5,366 psi). Girard et al. (1997) found that a quartz unit showed higher stress than the surrounding Poorman and Homestake rocks. This quartz unit is very hard and capable of storing more stress relative to other rocks of the Poorman and Homestake formations. The abundant amounts of mica and chlorite are capable of bending and allowing a slow release of stress over time.
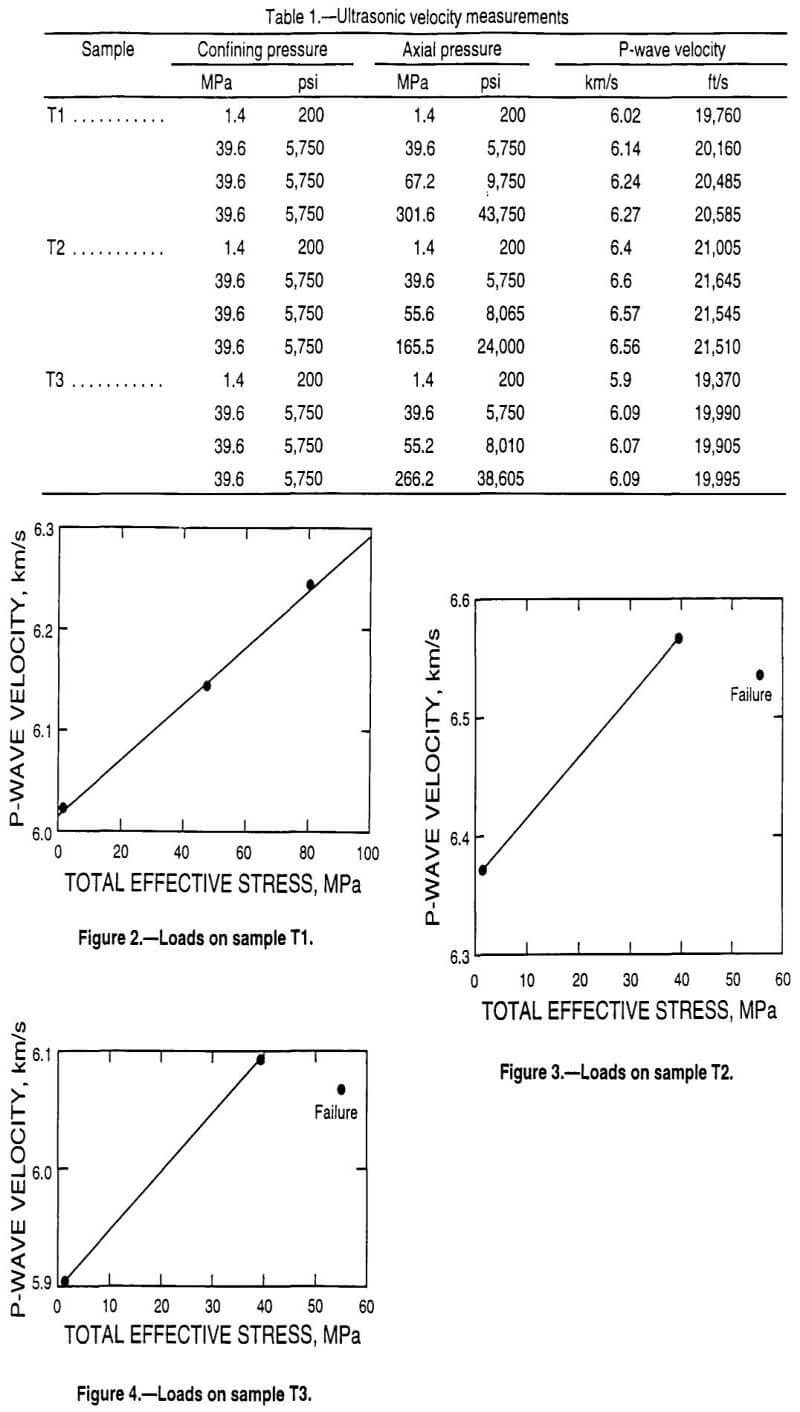
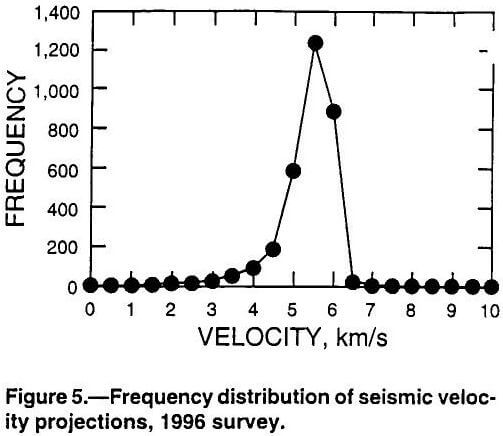
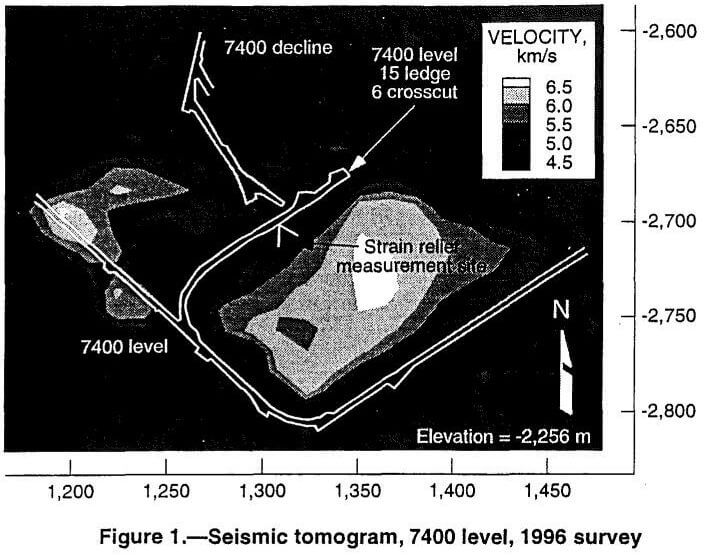
Ultrasonic velocity core tests are a valuable tool for setting global constraints for inferring seismic velocities. Loading on three core samples (T1, T2, and T3) showed an initial increase in velocity for each sample, a result that Thill (1982) identified as being the result of crack closure in soft rocks. Velocities in the core samples averaged 6.3 km/s (20,669 ft/s) at pressures of from 1.4 to 39.6 MPa (200 to 5,750 psi) whereas P-wave velocities along the skin of mined-out openings averaged 4.5 km/s (14,764 ft/s), a 29% difference. Lower velocities in the survey measurements should be expected because of large open cracks in the pillar that were not present in the smaller core samples. An increase in core velocity from 1.4 to 39.6 MPa (200 to 5,750 psi) confirmed crack closure, as noted by Thill (1982), Radcliffe and others (1986), and Young and Maxwell (1992). Because the increased pressure in samples T2 and T3 beyond 39.6 MPa (5,750 psi) yielded no increase in velocity, future tests should be done in increments of 0.7 MPa (100 psi), starting with 1.4 MPa (200 psi) up to about 39.6 MPa (5,750 psi). Measured overcore strain relief values of 37 MPa (5,366 psi) (Girard et al. 1997) compare to seismic velocities of about 5.2 km/s (17,060 ft/s) and ultrasonic core velocities of 6.3 km/s (20,669 ft/s). These results are encouraging as attempts are made to determine a relationship among measurements of actual seismic velocities and overcore strain relief in a rock mass and ultrasonic velocities in core.