
Table of Contents
Although the comminution process has undergone much experimental study, there is not yet an adequate theoretical basis for predicting the mean size and size distribution of the product from a comminution machine. This lack is hardly surprising, since most of the considerable body of knowledge concerning the deformation of solids becomes inapplicable when the stresses exceed the elastic limit. Although the theory of crack propagation has contributed much to our understanding of the fracture of structural materials, the application of this theory to catastrophic breakage such as occurs in comminution becomes hopelessly complicated.
The problem is further complicated by the difficulty of evaluating the results of a comminution process. The product cannot be adequately characterized by its mean particle size; output data are observed as size-distribution functions covering a wide range of sizes.
The studies that have contributed most to an understanding of the mechanism of breakage are those involving the breakage of a single specimen by impact and by static loading. Studies of this kind have the most direct application to coarse crushing; their contribution to fine grinding is largely to provide a conceptual basis rather than to produce usable data. The interaction between breakage forces and ore particles in a tumbling mill takes on a statistical aspect. Such processes can be dealt with more effectively on a phenomenological basis; that is, the process is represented, not by extending the breakage mechanism from a single particle to a large number of particles, but by determining the relationships between observed corresponding values of the input and output variables.
The purpose of this Bureau of Mines study was to re-examine the quantitative relationship between the energy expended and size reduction. Particular attention was given to the size distribution of the resulting product. The intention was to carry out these observations with no preconceived ideas on the relationships to be observed. The size distribution for each experiment was analyzed by the method of moments. The mean size was measured by the first moment with respect to the maximum size. The essential features of the shape of the distribution curve were represented by the second, thirds and fourth moment about the mean.
In short, the experimental procedure was to crush uniformly sized samples of mineral by direct application of a known amount of kinetic energy and to observe the effect on the mean size and size distribution as the energy input was increased. Observations were also made on the effect of initial particle size, impact velocity, and sample size.
Experimental Procedure
The crushing device used in these experiments was a simple drop-weight crusher similar to that used by Gross and Zimmerley, except that the drop weight was cylindrical instead of spherical and that the impact energy was applied directly to the mineral-not through a steel plunger. This direct application made it necessary to provide a cylindrical enclosure to prevent the loss of flying particles, but the charge absorbed all the impact energy and there was no rebound The inconvenience of providing an enclosure was more than offset by avoiding the corrections for rebound and the unknown influence of the plunger on the crushing process.
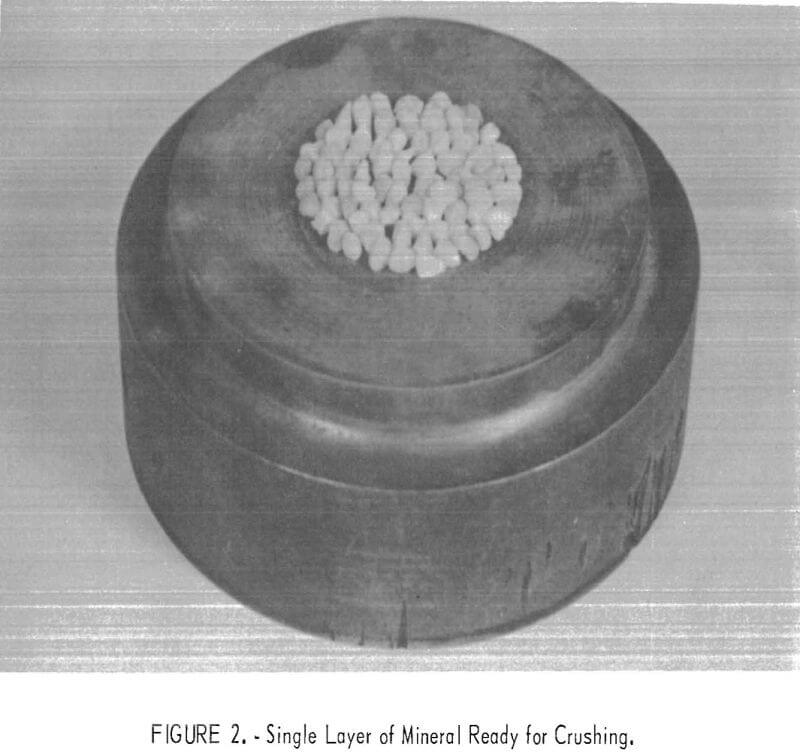
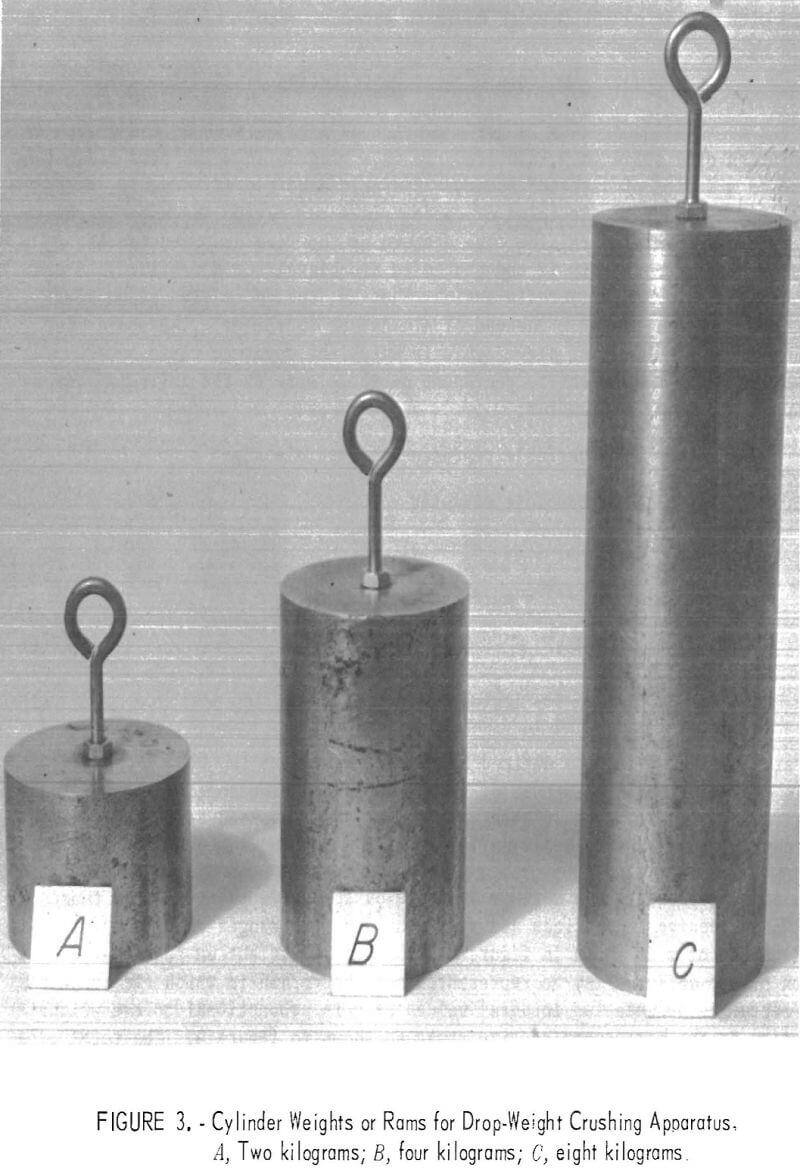
The apparatus is shown in figure 1. The mineral to be crushed is arranged in a single layer on the base as shown in figure 2. The impact energy was provided by dropping one of the three cylinders (fig. 3) a measured height above the base. The cylinders weighed approximately 2, 4, and 8 kg. They were provided with screw eyes at the center of one end of the cylinder by which they were suspended by a nylon cord at a prescribed distance above the base. Care was taken to line up the cylinder so that the face was parallel to the base and the center of the cylinder was in line with the center of the
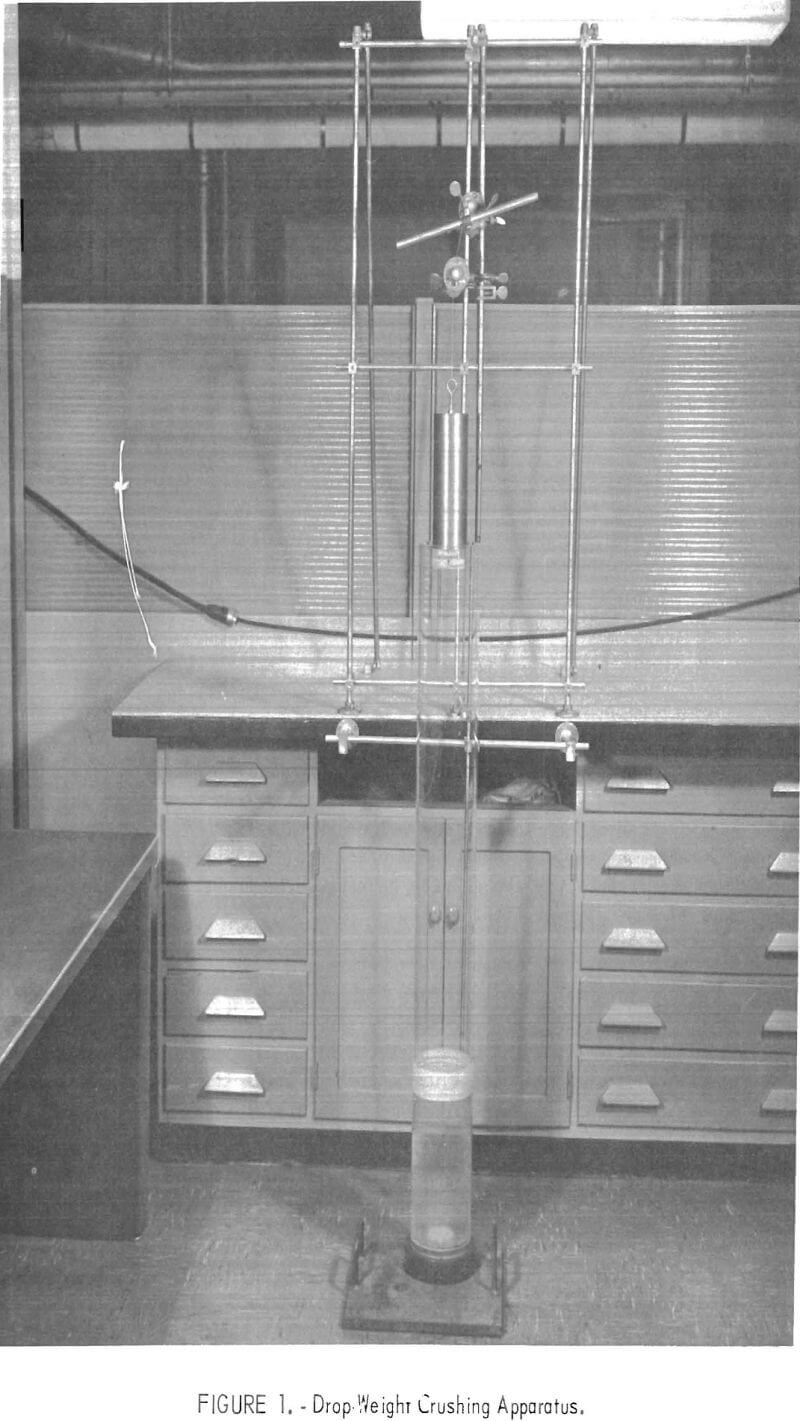
charge. The cylinder was dropped vertically without any sidewise motion by placing a lighted match close to the nylon cord. After a few trial experiments, a technique was developed whereby all the energy from the dropping cylinder was absorbed by the charge with no rebound or appreciable sidewise displacement of the cylinder after impact.
The mineral used for these experiments was a clean white amorphous silica gravel with no visible grain structure. The minus 3-½- plus 4-mesh fraction used in these experiments was prepared by screening the gravel as is. Supplies of finer size fractions were prepared by passing the gravel through a laboratory jaw crusher set just close enough to break the larger particles.
Microscopic examination indicated that the mineral was virtually pure silica, including some slightly discolored particles that were removed from the samples by hand picking. The density of the mineral was 2.630.
Each experiment consisted of 12 to 24 drops depending on the particle size of the sample; the drop distances ranged from 30 to 120 cm. The particles were arranged in a single layer having p. maximum diameter of about 2-¼ in to assure equal distribution of the impact energy over the entire charge. The sample weight ranged from 20 g for the coarsest to 5 g for the finest initial particle size. At least 100 g was crushed for each experiment to give an adequate amount for sieve analysis.
The crushed product from each experiment was analyzed for size distribution by sieving with a set of Tyler sieves in the √2 series. It was first screened on a Ro-Tap sieve shaker for 20 min using a nest of screens from 4- through 48-mesh. The undersize was then screened again on the Ro-Tap for 20 min with a nest of 65- through 400-mesh screens. Each fraction was weighed to 0.2 mg.
Analysis of Size Distribution
The comminution process is not a continuous process such as the growth or dissolution of a solid in a solution. It is a process in which size reduction occurs as a series of discrete events. A single particle is suddenly transformed into a group of particles of random sizes but having the same aggregate volume as the initial particle. The pattern of the size distribution is revealed more meaningfully if the particles are classified according to a geometric rather than an arithmetic scale. That is, the successive sieve apertures have a constant ratio instead of a constant increment. The scale most commonly used is the Tyler sieve scale in which the aperture ratio is √2. Therefore, it is convenient to represent particle size by the following transformation of particle diameter:
x = variable representing particle size
d = particle diameter
dR = reference diameter
s = 1/√2 = multiplier
d = dRsx………………………………………………………..(1)
x = l/log s log(d/dR)……………………………………….(2)
The size variable x may be defined as the logarithm to the base s of the ratio of the particle diameter, d, to the reference diameter, dR; it is proportional to log d. The variable x may easily be converted to the corresponding particle diameter by equation 1.
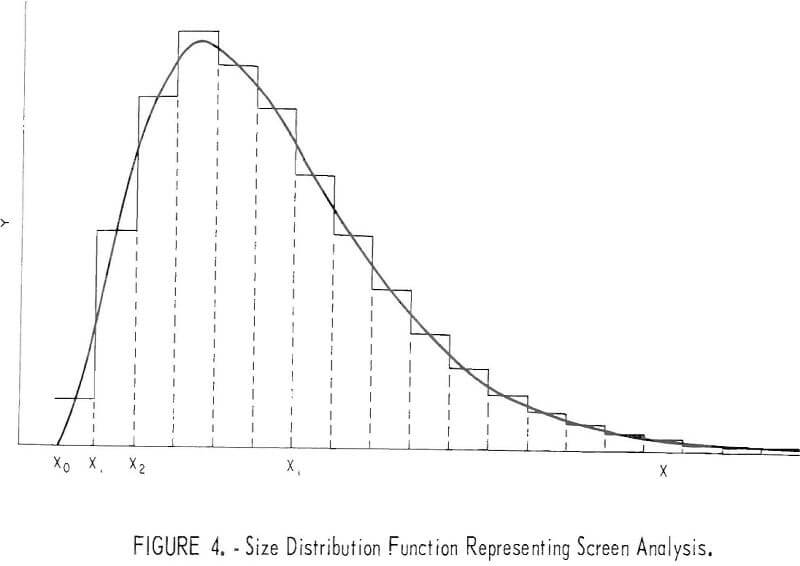
If dR represents the maximum aperture of the sieve then the size ranges of the successive finer sizes are represented by the ranges between the integral values of x as shown in figure 4. The size distribution represented by a given screen analysis may be represented by a bar graph in which the areas of the rectangle between two integral values of x is proportional to the weight fraction m the corresponding size range as shown in figure 4. The total area under the graph including that representing the subsieve sizes is equal to 1.
The properties of a distribution function can be represented quantitatively by the moments of the distribution. For example, if a screen analysis is represented by the rectangular elements in figure 4, the first moment about xo is defined by
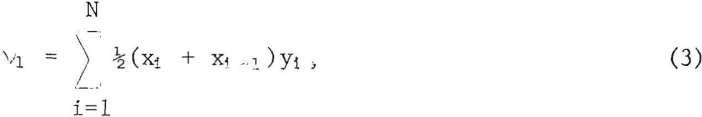
where xi = value of x corresponding to maximum size of sieve size i,
yi = corresponding weight fraction,
vi = first moment about an arbitrary axis,
and N = total number of size fractious.
The first moment of the mean value of x is the value of x corresponding to the mean particle size as determined from weight or volume.
Higher moments are measures of the shape of the distribution curve. They are taken as central moment, µn; that is, they are taken about the mean.

The second moment, µ2, is the variance, a parameter that denotes how widely the distribution is spread either side of the mean value. The square root of the variance is known as the standard deviation.
The third and fourth moments are usually expressed as ratios with the second moment to put them in dimensionless form. The dimensionless ratio of the third moment,
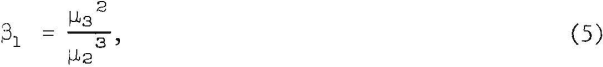
is known as the skewness, it is a measure of the asymmetry of the distribution. It may have either positive values when skewed to the right or negative, when skewed to the left. For symmetric distribution β1 = 0.
The corresponding ratio with the fourth moment

is known as the kurtosis; it is a measure of the peakedness of the distribution. The kurtosis for Gaussian or normal distribution is β2 = 3. When β2 is less than 3 it means that the peak is flatter than that of the normal curve.
Various schemes have been used by previous investigators for analyzing size distribution data. Most have involved plotting some function of the weight fraction against some function of the particle size and determining graphically, or by linear regression, the slope of the line and the size corresponding to some cumulative weight fraction, such as 80 percent. These two parameters are then used as parameters to measure the dispersion and relative size of the product. These techniques have been useful for smoothing data and for extrapolating size analyses into the finer sizes. Moreover, they were the only techniques that were easy to apply to size distribution data before high speed computers became widely available.
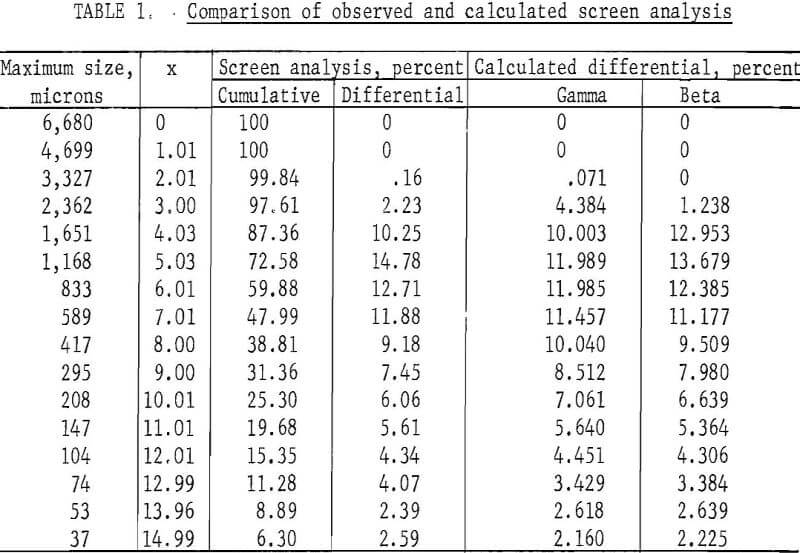
It is now practicable to use the classic method of moments which has long been used by statistical mathematicians for problems of this kind. Knowing the first four moments of a distribution, one can calculate the parameters for a distribution function, such as the continuous curve, shown in figure 4, which has the same moments as calculated from the observed data. The two types of distribution function most useful for this purpose are the incomplete beta and gamma functions, or Pearson’s Types I and III functions. The utility of these functions is shown in table 1, which gives a comparison of the observed screen analysis and the analyses calculated from the moments for both gamma and beta distribution functions. The maximum size shown in table 1 is the nominal sieve aperture given by the manufacturer.
Virtually all the essential information regarding the size distribution is contained in the four moments. The gamma distribution is calculated on the basis of only the first three moments and the beta distribution, on the basis of all four moments. In this instance, the beta distribution is sufficiently better, as judged from the mean deviation, to justify the extra parameter required. This is usually not so. Even though there is considerable deviation between individual pairs of values of the calculated and observed analyses, the moments agree and this is the better test for the entire distribution.
Calibration of Screen Analyses
Uncertainties often arise when one compares size analyses made by one investigator with those of another Sieves having the same nominal aperture vary, as do sieving techniques. In order to make the size data in this report more meaningful, the mean particle size for the size fractions coarser than 35-mesh was measured by determining the mean size and volume of about 100 particles selected at random. The results are summarized in table 2.
Note.-First moment or mean value of x = 7.897.
Central moments:
Second moment or variance = 16.455,
Skewness (beta 1) = 1.803,
Kurtosis (beta 2) = 5.183.
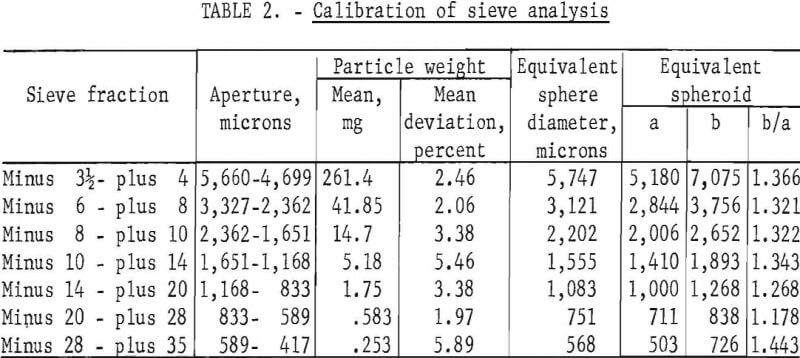
The diameter of an equivalent spherical particle having a weight equal to the mean weight of the particles is considerably greater than the mean value of the nominal apertures. This discrepancy could mean that the actual apertures are greater than the nominal apertures of the sieves. However, examination of the particles under the microscope shows that they have a strong tendency to be elongated and that the mean particle is more suitably represented by a prolate spheroid. The mean particle volume for particles larger than 14-mesh was equal to that of a prolate spheroid having a minor axis equal to the mean aperture and a major axis about one-third greater. For finer sizes the particle shape tends to become more equidimensional. The ratio for the minus 28- plus 35-mesh fraction in table 2 is an exception However, counting particles of this size and finer is a tedious operation and there may be an unconscious bias toward selecting larger particles for weighing.
Experimental Results
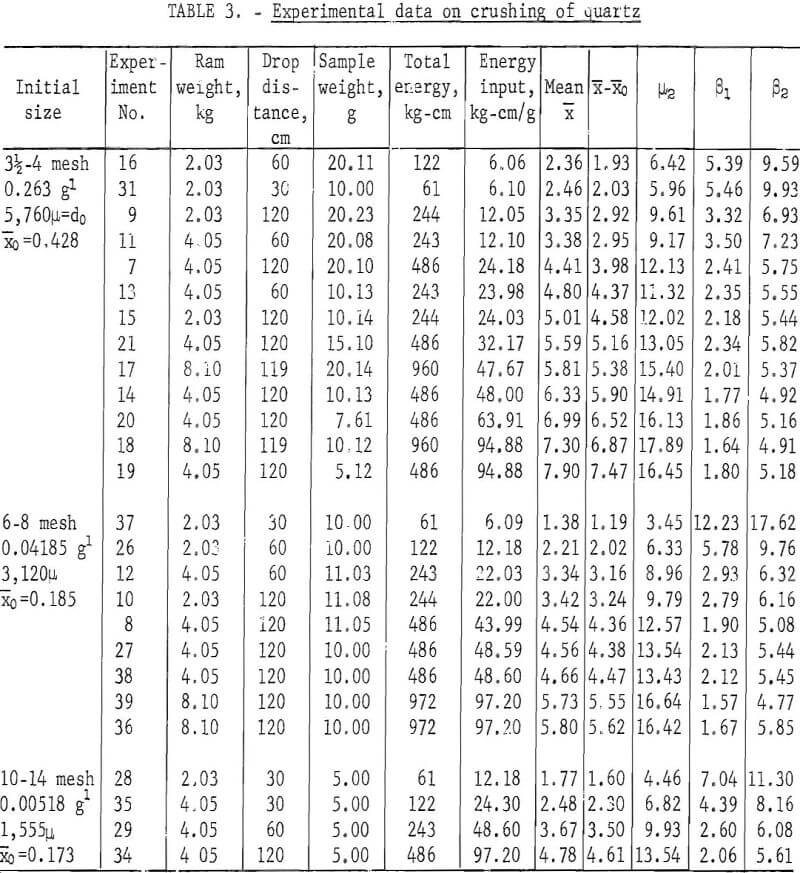
Three series of experiments were run, in which products were collected and analyzed for three different initial sizes and various levels of impact energy. The energy level of the impact energy, measured in kg-cm per g, was varied by changing the drop distance, ram weight, and size of sample. Several sets of experiments were run to determine the degree of reproducibility of the experiments and to what extent the size reduction was dependent on velocity of impact and the size of the sample absorbing the impact energy. Input and output data for each of these experiments is summarized in table 3.
Size Reduction
The relationship between the reduction in size, energy input, and initial particle size is shown graphically in figure 5. The size reduction is plotted as
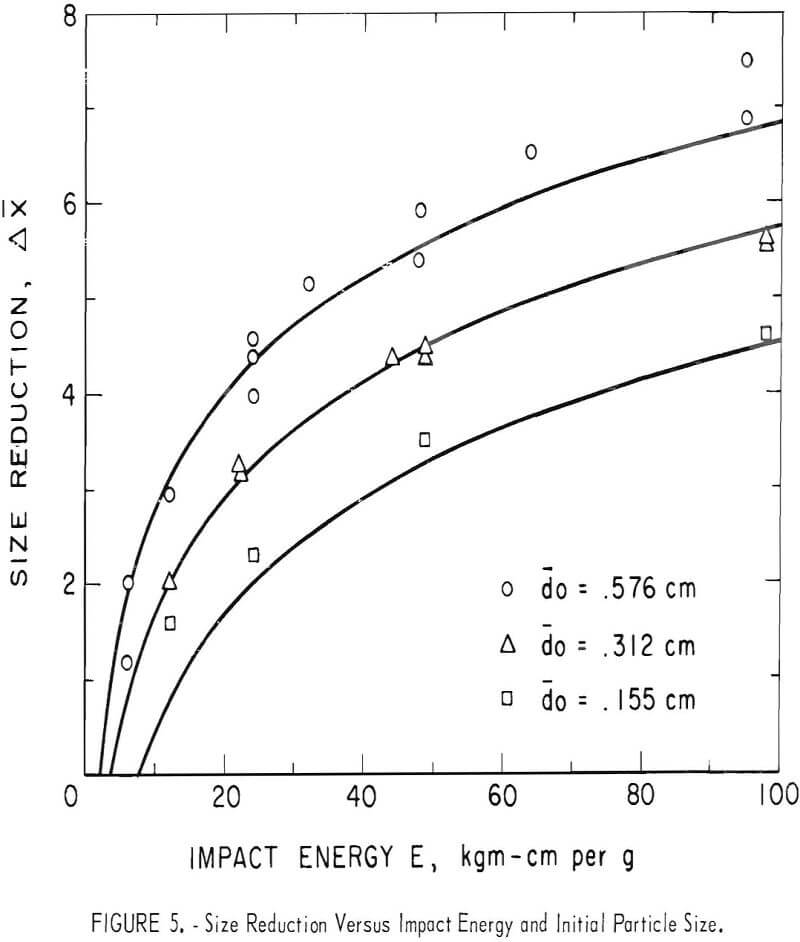
ordinate against the energy input as abscissa. The size reduction is represented by the difference in the mean value of x for the product as compared with that of the initial sample. The energy input, E, is equal to the total energy of impact in kg-cm divided by the weight of the sample. The size reduction is clearly a function of initial particle size as well as the energy input.
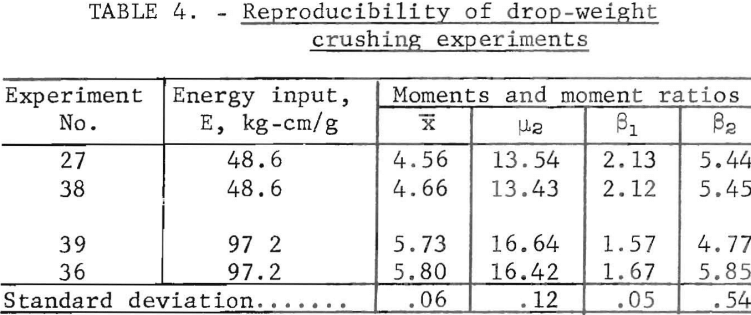
Reproducibility
Duplicate experiments were run at two energy levels for the intermediate size quartz samples. Four 10-g samples of 6- to 8-mesh quartz were crushed by dropping rams weighing 4.05 and 8.10 kg, a distance of 120 cm. The results are summarized in table 4.
Effect of Velocity of Impact
Several experiments were made to determine what effect, if any, resulted from increasing the velocity of impact, while keeping the energy input constant. The length of the fall was increased in the same proportion that the weight of the ram was decreased. The results of these experiments are shown in table 5.
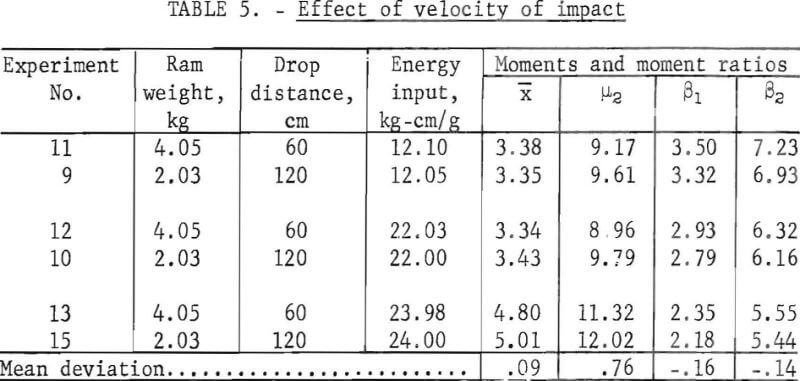
A comparison of the deviations shown in table 5 with the standard deviations in table 4 shows that increasing the drop distance (velocity of impact) from 60 to 120 cm tends to cause a slightly greater size reduction. The deviation is 1.5 times the standard deviation. The comparative tests show a more definite effect on the form of the size distribution function. Higher impact velocity tends to increase the variance and decrease the skewness; the ratios of the deviation to normal deviation are 6 and 3, respectively,
Effect of Sample Size
The effect of sample size is shown in table 6. Three pairs of experiments were performed in which the energy input per gram was the same, but the quantity of material being crushed was different. Experiments were performed at three energy levels.
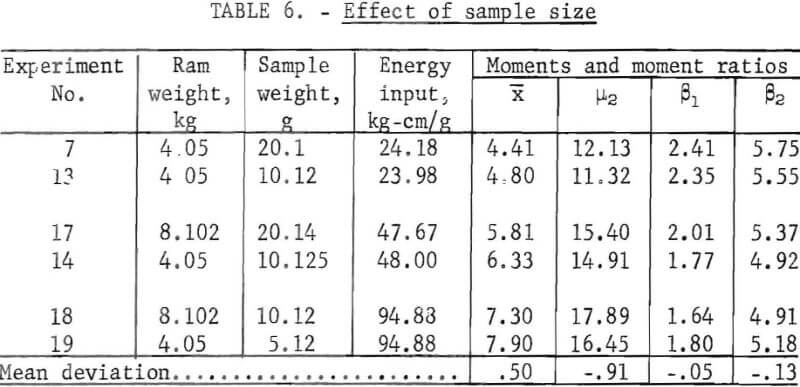
A comparison of the deviations in table 6 with the standard deviations in table 4 shows that decreasing the sample weight by one-half produces a significant increase in size reduction, and decreases in variance in the size distribution; the ratios of the mean deviation to the normal deviation are 8 and 7, respectively. The skewness and kurtosis are not significantly affected. The sample size effect may be related to the cushioning effect of the finer particles on the momentum of the ram
Size Reduction as Function of Input Energy and Initial Particle Size
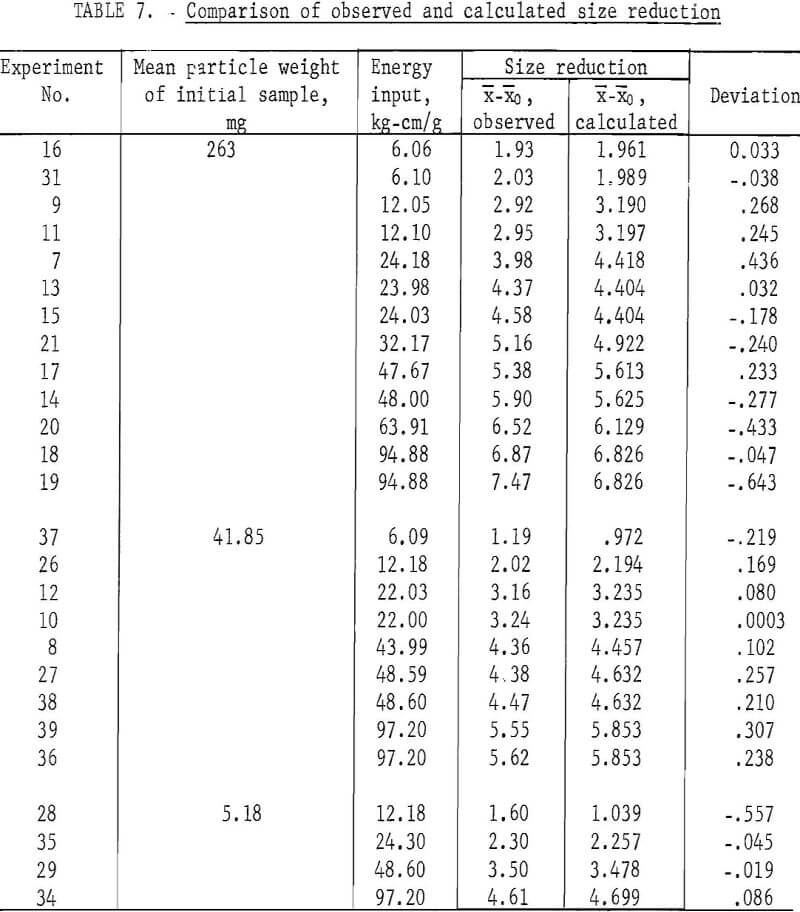
Although the velocity of impact and the total volume of material absorbing the impact have secondary effects on the amount of size reduction produced, the primary factors determining the relationship between the initial and final mean particle size are the energy of impact per unit volume of material and the initial particle size. After trying several ways of correlating the data for 26 experiments, it was found that the size reduction, X-Xo, could be correlated with the logarithms of the energy input, E, and the mean particle weight, m, of the initial sample, by the following regression equation:
![]()
A comparison of the observed and calculated values is shown in table 7. The values of size reduction calculated by equation 7 for the three series of experiments are shown by the three curves in figure 5; the three sets of points represent the observed values.
Although a comparison of paired experiments indicated that impact velocity and sample size had an effect on size reduction, these effects are very small with respect to the more dominant influences of energy per unit volume and initial particle size. Inclusion of these two additional variables in the regression equation did not decrease the variance between observed and calculated data.
Size Distribution
An analysis of the size distribution of the products of various crushing and grinding machines was described in a previous publication. It was shown that the essential features of the size distribution for isotropic homogeneous minerals such as quartz, feldspar, and glass could be represented by the second and third moments about the mean. The fourth moment was linearly correlated with the third. It was also shown that while an initially uniform feed material was progressively reduced in size, the size distribution underwent a progressive change in form from a reverse, J-shaped to a skewed, bell-shaped distribution curve, typical of the product of a tumbling mill such as the ball mill. This shape change is reflected in a progressive increase in the second moment, and in a decrease in the third moment representing a corresponding increase in variance and decrease in skewness.
These same changes in distribution are observed in the products from the drop-weight crushing experiments as shown in figure 6. The variance, µ2, and
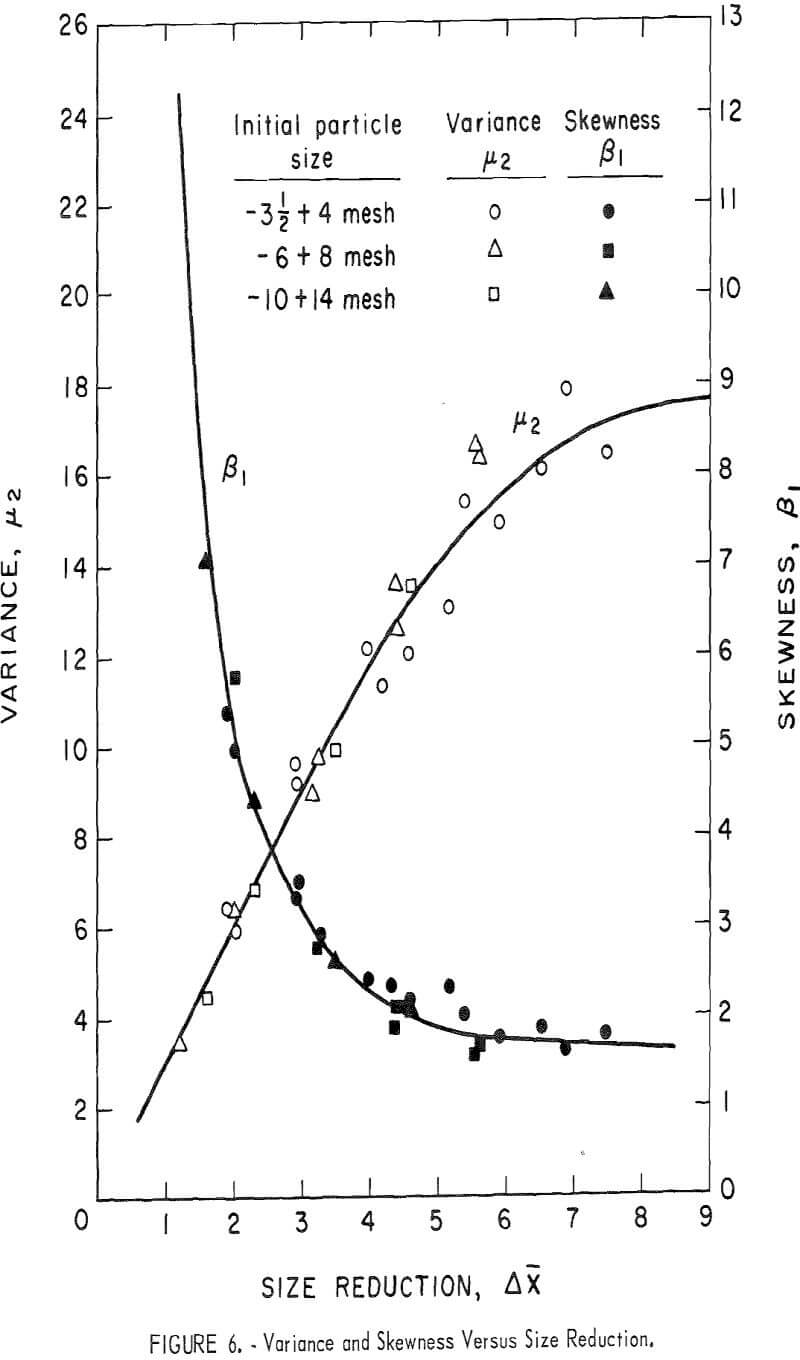
the skewness ratio, β1, are both plotted against the reduction in mean size, Δx. For a size reduction of 0<Δx<4, which is equal to a fourfold reduction in mean particle diameter, the increase in variance is proportional to Δx and the skewness decreases sharply, approximately as a hyperbolic function, as Δx increases. For a size reduction, Δx>6 (more than eightfold decrease in mean particle size), the variance tends to approach a maximum and the skewness, a minimum value. These changes suggest that as the size reduction, or the ratio of the initial to the final mean size, exceeds 16 (Δx=8), the form of the size distribution ceases to change further. This stable size distribution curve is a skewed, bell-shaped curve with a well-defined maximum or mode.
Evaluation and Interpretation
The curves in figure 3, representing size reduction as a function of impact energy, pass through the zero size-reduction axis at a different positive value of the impact energy for each different initial size. This result suggests that for each particle size there is a threshold value of impact energy that must be exceeded before size reduction occurs. This phenomenon is reasonable since the energy must be sufficient to exceed the elastic limit and might be expected to vary with particle size.
The threshold energy corresponding to the data shown in figure 3 may be calculated by equating the right-hand side of equation 7 to zero, expressing the mean particle weight, m, as a function of particle diameter, d, and solving for E.

where do = initial particle size, cm.
This equation indicates that the threshold energy increases as the particle size decreases. However, more energy is not required to crush a small particle than a large one; impact energy has been defined as energy per gram or per unit volume. Another way of stating the relationship is that the threshold energy is approximately proportional to the specific surface.
Substituting equation 8 into equation 7,
Δx = 1.762 log (E/E0)………………………………………………..(9)
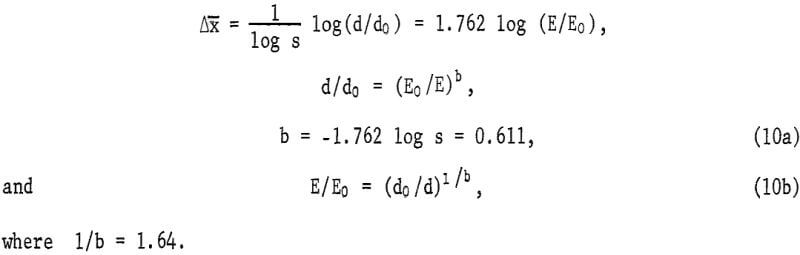
Or, if we express x in terms of the particle diameter,
Similar experiments were made by Hukki on the relationship of size reduction to impact energy. Hukki’s experiments on quartz covered a size range from 0.8 to 5.8 cm for initial particle diameter. The energy was applied by a double pendulum device in which the applied energy could be accurately measured. The energy input ranged from 0.8 to 60 kg-cm per g.
Regression analysis of Hukki’s data together with that in table 3 gave the following equations for threshold energy and size reduction:
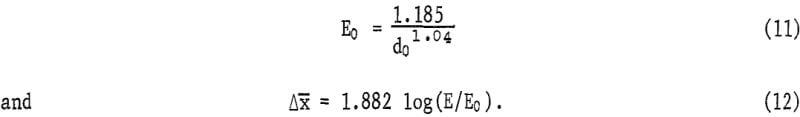
The standard deviation for the combined data from expected values given by equations 11 and 12 is 0.40. The corresponding standard for the data in table 3, as represented by equations 8 and 9, is 0.28.
Previous investigators have usually expressed energy for comminution as a function of the ratio of size reduction as in equation 10b. Various rules have been proposed that in effect assign values to the exponent l/b; these range from l/b = 1 for “Kick’s Law” to l/b = 2 to “Rittinger’s Law.” Bond has found that the effective value of this exponent is between these two extremes and has proposed 3/2.
Charles made a similar correlation of input energy to size reduction. However, he measured size by the so-called “size modulus” parameter of the Gaudin-Schuhmann equation instead of the mean particle size. He found that the values of the exponent for various materials ranged from 1.32 to 2.4; his value for quartz was 1.86 to 1.90.
The size distribution of the product from impact crushing may be represented by a gamma distribution function. The distribution parameters are strongly dependent on the size-reduction ratio. The variance increases linearly over an eightfold size reduction in mean particle size, and tends to approach a limiting value after sixteenfold reduction. The skewness decreases sharply as the mean size is decreased twofold and approaches a limiting value after eightfold size reduction.
This observation seems to be at variance with the assumption made by Epstein and by Broadbent and Callcott and others who have attempted to model the grinding process mathematically. They tacitly assumed that comminution is a linear process. However, it is evident that comminution is actually a nonlinear process; that is, the pattern of size distribution is dependent on the magnitude of size reduction.
Possibly the breakage pattern would be reasonably constant if the impact energy were completely absorbed by the original particle, but in general the impinging mass has sufficient energy for secondary and perhaps tertiary crushing from the same impulse. Therefore the concept of a characteristic breakage pattern, which has been the basis of useful models for comminution, is really a useful fiction that can only be observed under special circumstances. In general, its pattern must be inferred rather than measured. The function that is thus derived is probably just as much a characteristic of the model used in the computations as it is a characteristic of the material being crushed.
The results of these experiments may be quantitatively expressed quite completely by equations 11 and 12 plus the two curves shown in figure 6. With this information it is possible to determine initial particle size within the range of the experimental data, as well as the expected mean particle size, variance, and skewness corresponding to any energy input. Knowing these parameters, the complete size distribution can be computed for a gamma distribution having the same moments. The mathematical relationships between the moments and distribution and a program for making these computations are given in a previous publication.