We present the results obtained in a study of the residence time distributions of solids and liquids in two and three phase systems in a column flotation cell. The effects of various flotation parameters on these residence time distributions of the collection and cleaning zones are also reported. The data obtained was fitted to various models. The validity of using the behavior of the liquid phase to predict solids residence time distributions is discussed.
Experimental Methods
The perspex laboratory column flotation cell used in the tests had a diameter of 54 mm and a height of 2200 mm. The air was introduced into the column via a sintered glass frit at the bottom of the column. The geometry of the cell is shown in Figure 1.
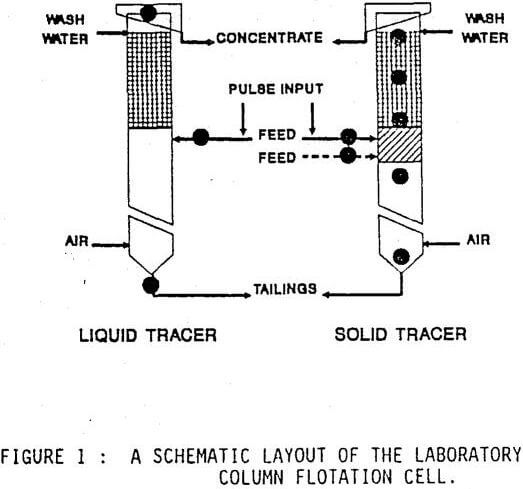
Throughout the tests a gold bearing pyrite ore was used. The solid tracer used was isotopically labeled gold present in the ore. A sodium chloride solution was used as the liquid tracer. The 89Au191 isotope was chosen because it has a convenient half-life of about 68 hours. The ore was irradiated a week before it was used to allow the shorter half-life isotopes to decay to negligible levels. The solids residence time distributions were measured by observing the response to a pulse injection. six Gieger counters were used to monitor the input and response signals, these are shown in Figure 1 as black circles. The data from the detectors was logged directly to computer. The detectors used for the liquid residence time distribution measurements were conductivity cells.
The collector used was SMBT (50 g/ton) and the frother Dowfroth 200 (25 ppm). Frother was added to both the wash water and the pulp. A conditioning time of 10 minutes was allowed once the reagents had been added, and the column to reached steady state after twenty minutes. The tracer was then introduced. This consisted of 7 g of ore at a pulp density of 50 % solids and was introduced into the feed line using a syringe 20 cm Just before the feed point (FP) to the column.
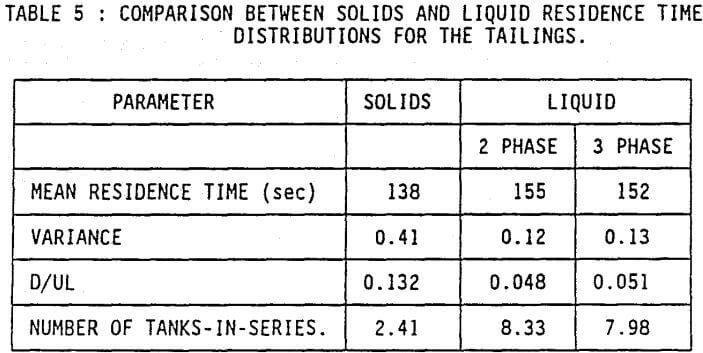
Samples of the concentrate, feed and tails were taken for each run just before the tracer injection so that the grade, recovery, mass pull and particle size could be determined.
RTD Model
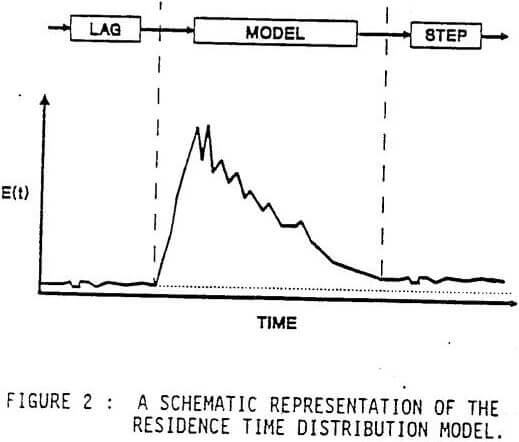
Figures 2, 3 and 4 show schematic representations of the models used in this study. Two constant terms are included in the model, viz, a time lag at the beginning and a step change at the end. The former accounts for the lag between the pulse input of tracer and the output signal. A step change must be incorporated to account for the fact that the output signals do not return to their base values due to contamination of the column (Figure 2).
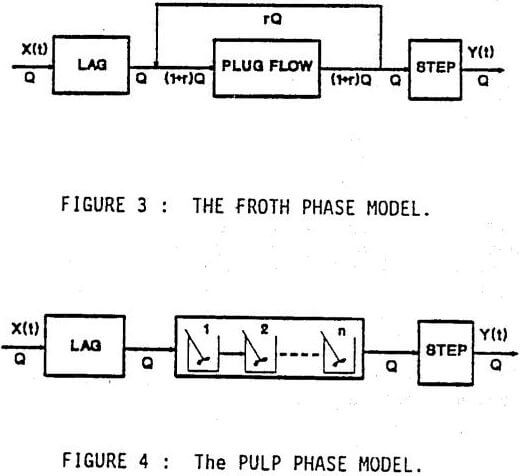
A perfect plug flow reactor with a recycle stream was used to model the froth phase behavior. This model was chosen because virtually any flow regime between plug flow (zero recycle) and mixed flow (infinite recycle) can be accommodated. The pulp was modelled using a tanks-in-series model. The dispersion model was not used for either the pulp or the froth phases because the vessel dispersion numbers obtained were far too large for the proper use of this model. Schematic diagrams of these models are given in Figures 3 and 4 respectively.
Two methods of modelling the data are possible, viz., the method of moments and the frequency response method. The latter is more complex but was chosen because it gives equal weight to all portions of the curve and deals effectively with long tails. The variance, vessel dispersion numbers, number of tanks-in-series and mean residence time values were calculated using standard methods.
Modelling of the residence time distribution data
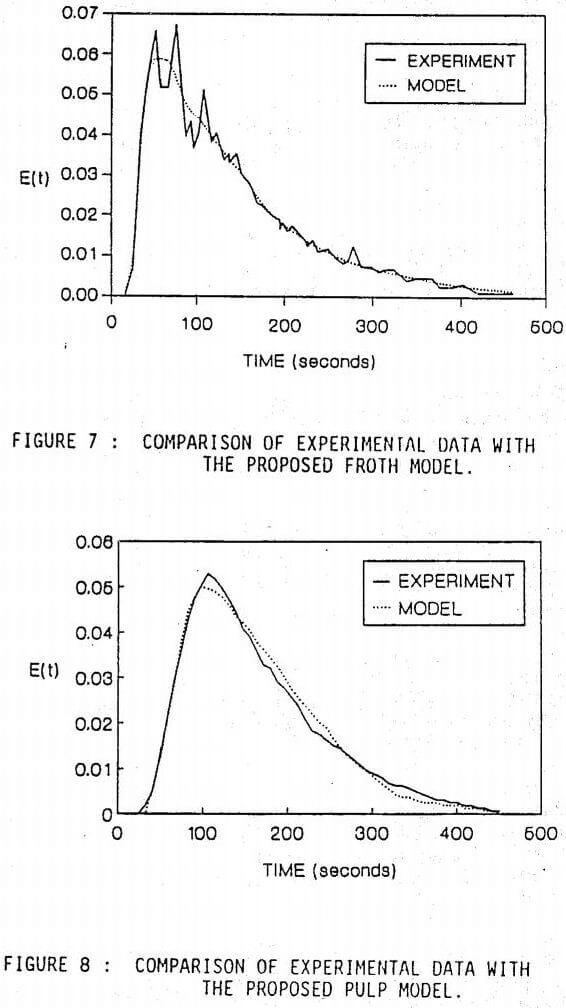
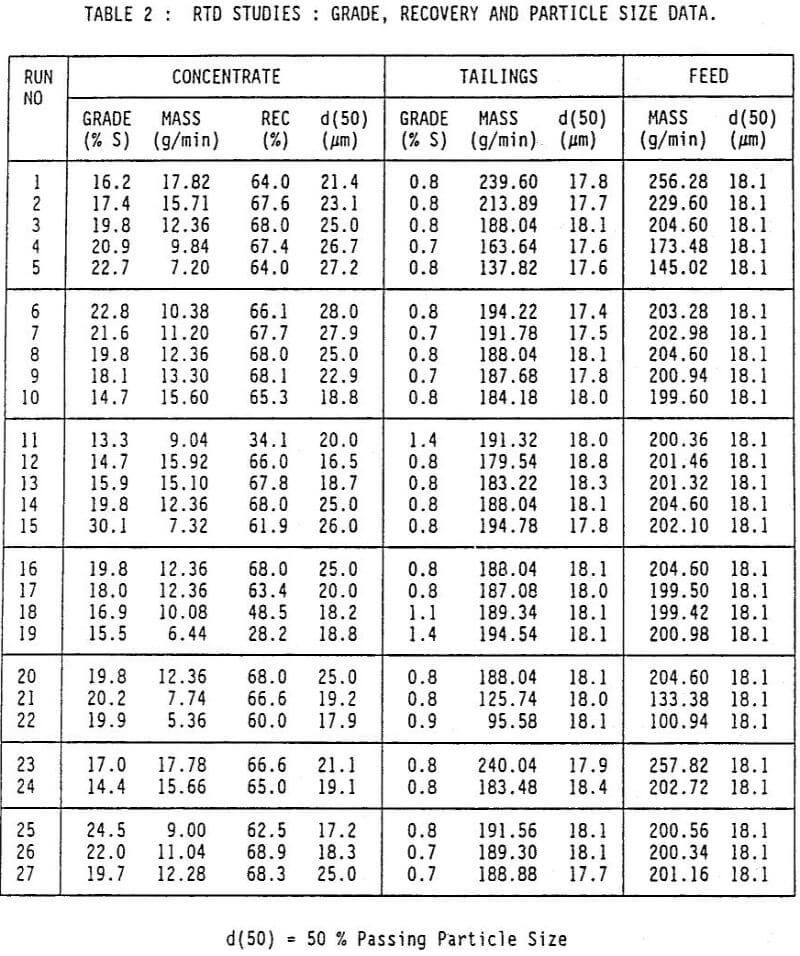
Figures 7 and 8 show plots of the experimental and model data for the top and bottom of the column respectively for Run 6. In all cases the mean absolute deviation between the experimental and model data was less than 8 percent. Sensitivity plots of the froth model were constructed by plotting equal error contours on a graph of the recycle ratio against the reactor residence time, the scales on the axes being proportional to the sensitivity of the model to each parameter (Box and Draper, 1987). The shape of these contours gives an indication of the inter-dependence of the two parameters. These sensitivity plots showed that there was little inter-dependence between the two parameters and hence that the parameters chosen were valid.