
- To participate in the 911Metallurgist Forums, be sure to JOIN & LOGIN
- Use Add New Topic to ask a New Question/Discussion about Flotation.
- OR Select a Topic that Interests you.
- Use Add Reply = to Reply/Participate in a Topic/Discussion (most frequent).
Using Add Reply allows you to Attach Images or PDF files and provide a more complete input. - Use Add Comment = to comment on someone else’s Reply in an already active Topic/Discussion.
Delayed froth formation (4 replies)
Hello Tamzon,
What frother are you using? Pine oil is slow to kick-in. Glycols are faster. MIBC alcohols are fastest to immediate.
Tamzon,
There is likely some short circuiting in the flow. You need to move the feed point to cyclone overflow and get good mixing and some conditioning before flotation. MIBC is usually very rapid so this is likely the reason.
What exactly are you seeing? Is this in the lab or a plant? Please describe where and how you are adding the frother and to what dosage g/t. Do you have photos or videos you can take and share?
Are you seeing no froth at all or just a dense/lazy froth movement removal/pull?
Maybe you just need higher frother because of iron/pyrite content or head grade, therefore collector dosage, but water chemistry affecting the effectiveness of your frother, no, not water chemistry.
Tamzon,
please answer Bob for further help.
Frother is added with two main purposes: to reduce and control the bubble size in the pulp by maintaining a target concentration around the bubble formation region, and to stabilize the froth layer through the water carried by the rising bubbles. Most plants dose frother based on feed tonnage rather than concentration in the pulp water, and thus undetected variations can occur. A practical target concentration can be based on the critical coalescence concentration; if frother concentration is below the critical coalescence concentration level, then changes in concentration result in inconsistent bubble size and gas holdup.
Maintaining frother concentration near but above critical coalescence concentration level is becoming an operational target, but there are numerous factors that may affect the stability of frother concentration. Variations can occur because of unstable frother delivery and incomplete dissolution, or operational decisions such as variable addition of frother-free wash water to control mechanical entrainment, launder water which dilutes downstream flotation stages, uneven distribution into parallel cell lines, and frother partitioning into the concentrate stream.
REF: Determining frother distribution in flotation circuits by Azin Zangooi, Cesar Gomez and James Finch.
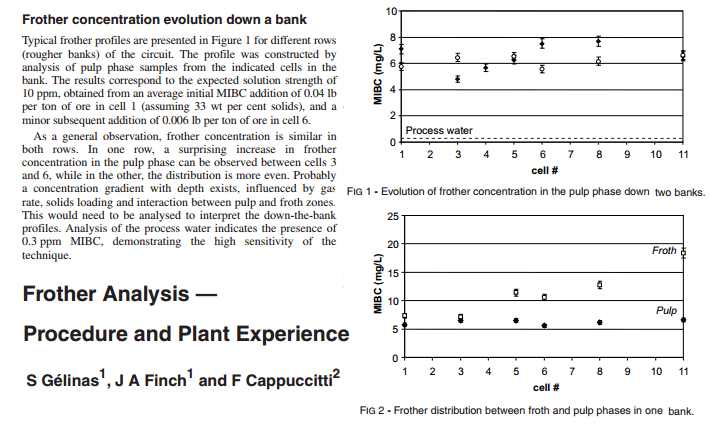
Typical frother profiles are presented in Figure 1 for different rows (rougher banks) of the circuit. Tire profile was constructed by analysis of pulp phase samples from the indicated cells in the bank. Tire results correspond to the expected solution strength of 10 ppm. obtained from an average initial MIBC addition of 0.04 lb per ton of ore in cell 1 (assuming 33 wl per cent solids), and a minor subsequent addition of 0.006 lb per ton of ore in cell 6.
As a general observation, frother concentration is similar in both rows. In one row. a surprising increase in frother concentration in the pulp phase can be observed between cells 3 and 6. w hile in the other, the distribution is more even. Probably a concentration gradient with depth exists, influenced by ga* rate, solids loading and interaction between pulp and froth zones. This would need to be analysed to interpret the down-the-bank profiles. Analysis of the process water indicates the presence of 0.3 ppm MIBC. demonstrating the high sensitivity of the technique.
Use the Social Share Bar on the Left. Tell everyone you can about https://www.911metallurgist.com/metallurgy/ It's FREE & GOOD.
What mineralogical or electrochemical factors could hinder froth formation during chalcopyrite flotation?
I do not understand what are the contributing factors in delayed and/or no froth formation.