Table of Contents
Those who have had occasion to sample a mine not infrequently find that it is impossible to take their sample cuts at regular distances apart, owing to the ground being close timbered, a stope having been taken out, or some other cause. When such is the case a tedious calculation becomes necessary in order to obtain an accurate result. A conscientious man will make the tedious calculation, but one who is inclined to be lazy, or who does not recognize the importance of accuracy, or has not the time, may be satisfied with either the arithmetical or weighted arithmetical mean result.
There are two main systems of taking samples when the cuts are taken—(1) at equal distances, (2) at unequal distances.
When the samples we cut at equal distances apart there are three methods of commuting the assay value :—
1 (a). By Arithmetical Mean.—The sum of the values and sum of the widths are each divided by the total number of samples, in order to obtain the value and width respectively, no allowance being made for the relative widths and values. The result is absolutely inaccurate, and should never be used under any circumstances.
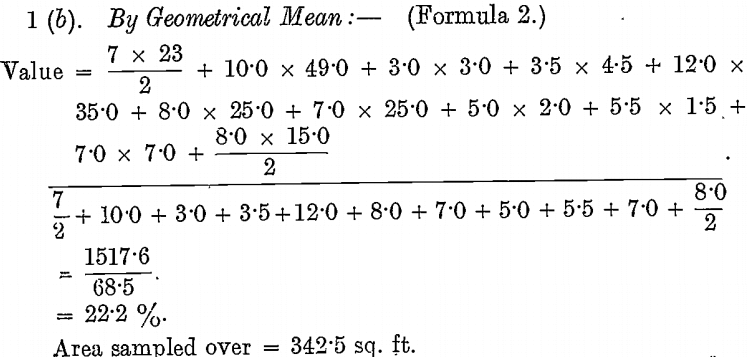
1 (b). By Geometrical Mean.—The assay widths, i.e., feet %, feet oz., inch dwt., are added together and the sum of these is divided by the sum of the widths.
All computations of value are based on the assumption that the width and value are the same for half the distance on each side of the cut, or, in other words, that the values and widths rise or fall from point to point in a straight line. No one supposes for an instant that such is the case in nature, but if samples are cut sufficiently close the straight lines will give very close approximations to the natural curves.
1 (c). By Prismoidal Method.—The area of each end of a prism is obtained by multiplying the width of the sample cut by the assay value. The middle area is obtained by calculation in the usual way from the end areas. The length is the distance between the two adjoining samples under consideration. The prismoidal formula;
End area + 4 times middle area + other end area/6 x length.
gives the value of the prism. The volume divided by the area sampled over gives the assay value.
Mr. W. Crossley, in a paper read before the Institution of Mining and Metallurgy, claims that this is the most accurate method. Perhaps it is, mathematically. If so, is the small amount of extra mathematical accuracy gained by it over the geometrical mean worth all the extra arithmetical work required ? In the writer’s opinion it certainly is not.
When samples are cut at unequal distances there are four methods of computing the assay value of the area sampled:—
2 (a). By Arithmetical Mean.—The method is the same as in 1(a), but objections to it are even greater, because allowance is made neither for the relative widths and values nor for the distances between samples.
2 (b). By Weighted Arithmetical Mean. — This is practically the application of method 1(b) to cuts taken at unequal distances ; it thereby becomes a mixture of the arithmetical and geometrical mean methods. It is not a geometrical mean applied to unequal distances, since the distances between the cuts are not taken into, consideration ; this leads to considerable error where the values vary to any extent.
2 (c). By Geometrical Mean.—Allowance is made both for the relative widths and values and for the varying distances between sample cuts (Fig. 1).
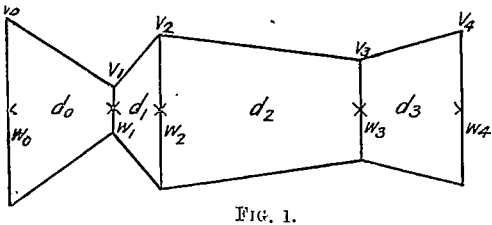
Let W0, W1, W2, W3, and W4 = Width of samples.
V0, V1, V2, V3, and V4 = Corresponding values.
d0, d1, d2 and d3 = Distance between samples.
The geometrical mean value over the whole area sampled
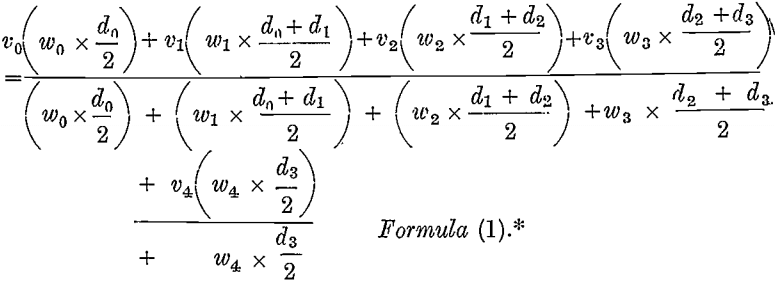
When samples are cut equidistant, the distance factor in the above formula is eliminated ; for instance, suppose that there is a uniform interval—say, 10 feet—between sample cuts, the expression then becomes—
In working out values by the geometrical mean the writer has always used either a Fuller or 10-in. Faber slide rule.
2 (d). By Prismoidal Method.—Same as already described in 1 (c).
Stoping Width.—With narrow veins it is sometimes necessary to work out a certain amount of wall rock in order to obtain sufficient room. It is often advisable to treat this rock, rather than pick it out, thereby impoverishing the ore. When this is done, it is necessary to make an allowance for what is known as a stoping width. For instance, suppose a lode is 18 in. wide, and worth, say 5 oz. (100 dwt.) The value over a stoping width of, say, 48 in. is obtained by multiplying the units of width by the value, and dividing the product by the units of stoping width ; that is,
18 x 100/48 = 37.5 dwt.
assuming that the wall rock is barren.
The Proposed Method
Recognizing certain objections to the best of the aforementioned methods, the writer has devised one which he considers, and has proved in practice, to be superior. The method consists of laying off on squared paper the distances apart of the various cuts on the axis. From these points, at right angles to the axis, lay off the assay widths on one side and the widths on the other. Draw connecting lines, straight or curved, as required, between the adjoining points of each figure, and join the extremities of the assay widths and width fines to the corresponding extremities of the axis. The scale to which the assay width diagram is drawn is an important matter, for, if too small, errors of measurement become exaggerated; if too large, the diagram becomes cumbersome. Where possible, it is advisable to use the same scale for both ordinates and abscissae. When this cannot be done, the writer plots the distances between samples and the widths of sample-cuts to a scale of 10 ft. to 1 in., using squared paper (100 squares to the sq. in.), and decreases the scale of the assay width fines to 30 ft. % to 1 in., which is a ratio of 1 to 3.
The area of the width figure (area sampled over) and the area of assay width figure are then obtained by means of the planimeter ; the latter is then multiplied by three to bring it to its true relation to the area sampled over.
In order to obtain the mean assay value, the assay width area is divided by the area sampled over.
Advantages of the Proposed Method
- One is less likely to make a mistake in plotting on squared paper, as the eye checks the result.
- Besides plotting assay width and width curves, the writer also uses one for assay values on the same sheet, but drawn in a different coloured ink. The relation of value to width at different parts of the lode may be seen at a glance. This was recommended by L. H. Cook in a discussion on the paper already referred to.
- One can more nearly approach the natural curve by this method than even by the prismoidal.
- The mean value and area sampled over can be obtained far quicker than by the prismoidal or the geometrical mean methods, if samples are cut at unequal distances.
- In the case of wide lodes, where one has to depend upon occasional cross-cuts to prove widths and values, the method is more likely to be correct than any of the others in use.
Precautions to be Observed when Using the Planimeter
See that the pointer is accurately set to the scale used. (Usually 100 sq. ft. = 1 sq. in.)
Set the instrument so that the wheel does not pass over the edge of the paper.
Measurements must be taken on a level table; if used on the incline the instrument is liable to over-run its mark, when released by the hand, thus registering incorrectly.
If the plan has by any chance been folded, it is well to slightly damp the reverse side, cover with a cloth and iron it.
Section Samples.—At one mine, where the writer is in charge of the sampling work, samples are cut in the roof of the drives in as near as possible to foot sections, at intervals of 5 ft. These are termed section samples. They are entered on a mine values sheet thus :—
As will be seen, the date of cutting, No. of sample, distance from a certain instrument point, width, and assay value of each section, assay width (in this case ft. %), and mean assay value for the whole cut are recorded. The first sample from Table No. 1 is shown as a specimen entry.
Face Samples.—At another mine where the writer is engaged it is impossible to cut section samples in the roof, as the ground is wet and heavy, and lathes have to be driven ahead from the last set to hold up the roof. If the samples were cut on the floor they would be absolutely unreliable. To get over the difficulty, each face is sampled daily by two cuts, one a quarter of the way down the face, the other three-quarters of the way, at approximately right angles to the dip. The ground being very soft, each cut is taken as nearly as possible in foot sections ; the geometrical mean value of the sections is taken as the value of the cut, the sum of the widths of the two cuts is divided into the sum of the assay widths of the same, and the result is the value of the face. For the purpose of reference the writer employs what he terms face sample sheets, a specimen of which is shown in Fig. 2.
From this it will be shown that the sheet is sectionalised to a scale of half an inch to one foot, which allows record to be made of faces up to 8 ft. square. If a face is larger than this, ordinary squared paper, 100 squares to the sq. in., is used. The sheet shows the date of sampling, the distance from a certain instrument point, width, value, dip, and nature of the lode, also the assay width, which is required for the proposed graphic method. The first face sample from Table No. 5 is shown as a specimen entry. From these sheets the daily face sample cards are posted, as follows :—
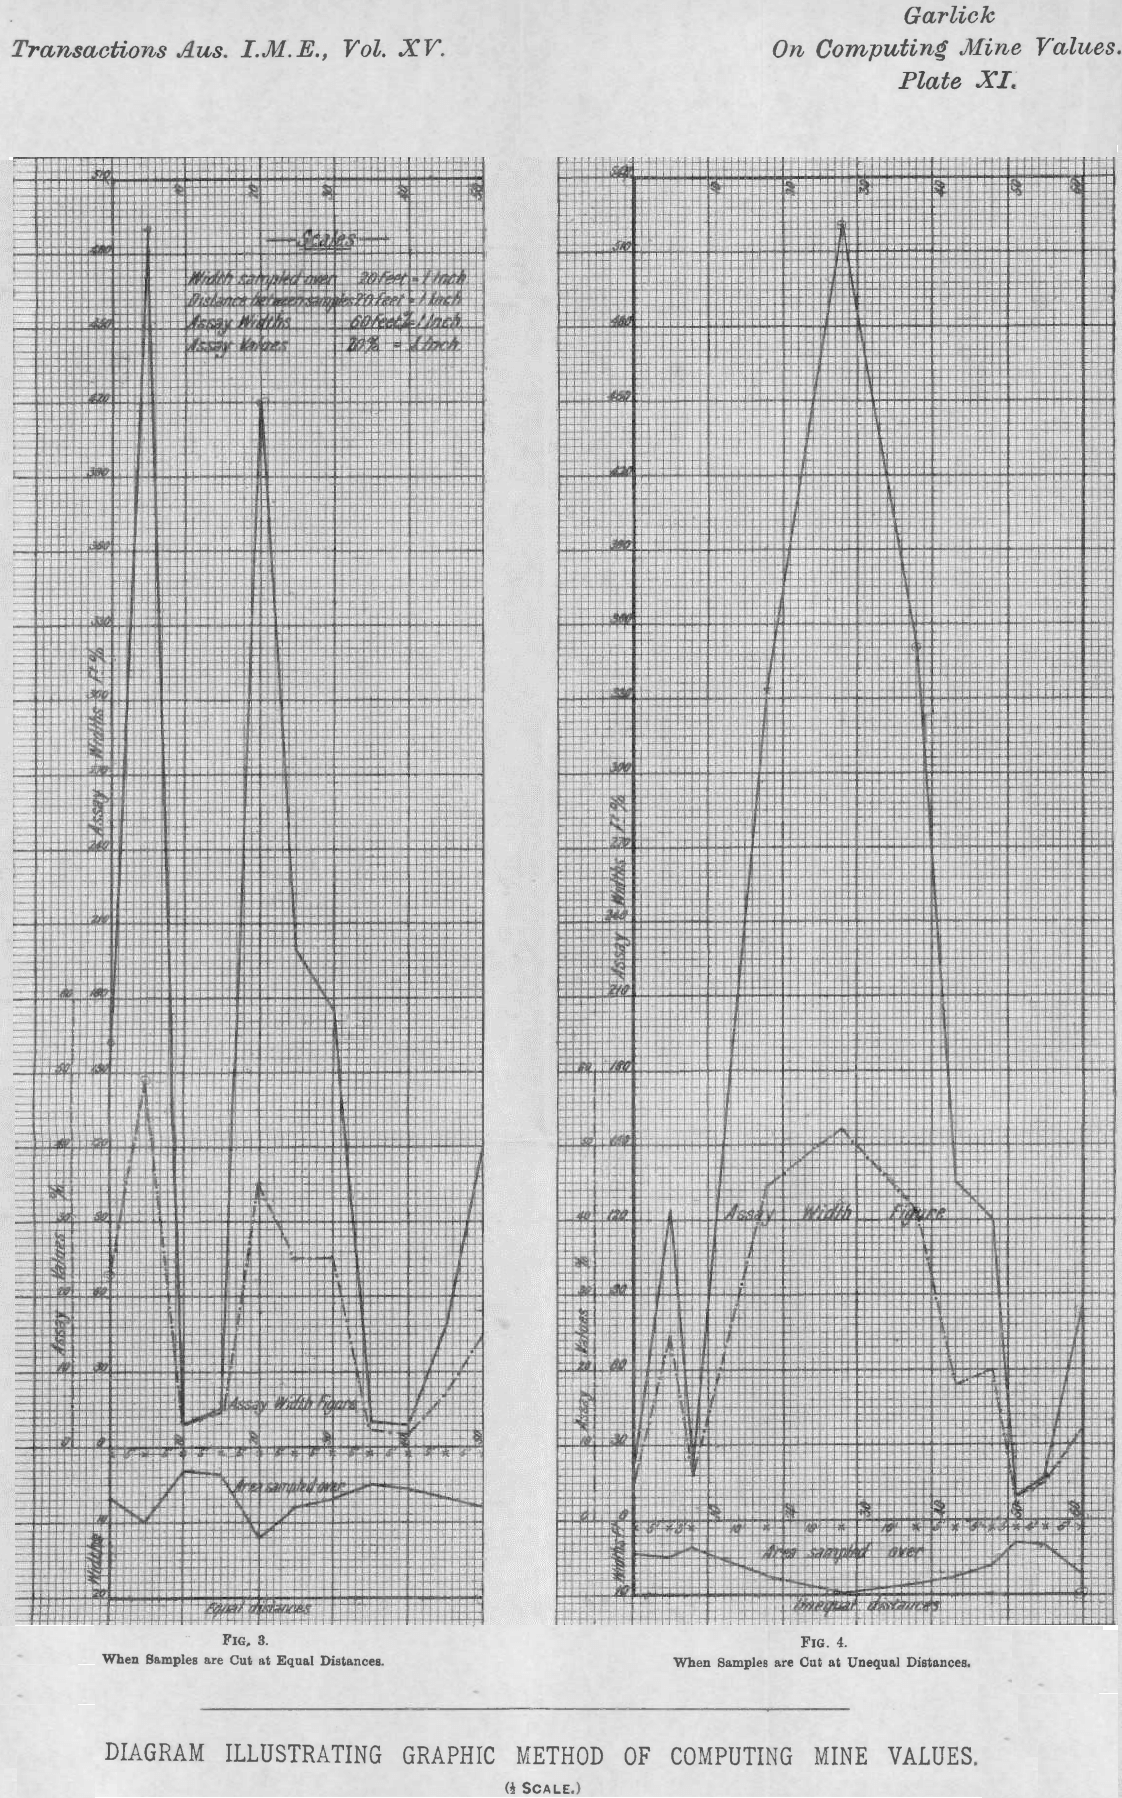
To illustrate the different results obtained, the writer has computed the value of part of a level by each of the methods.
When Samples are Cut at Equal Distances Apart
Let us suppose that a level is sampled at intervals of 5 ft., and that the widths and values are as in Table No. 1.
1 (a). By Arithmetical Mean:—
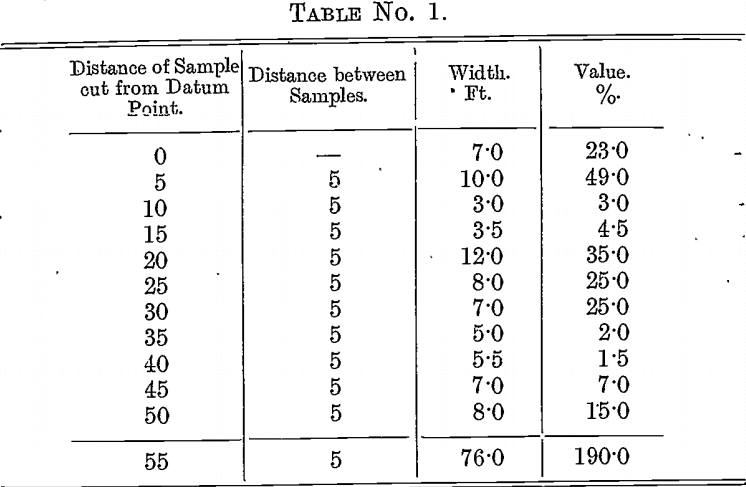
Number of Samples, 11.
Sum of Widths, 76.0.
Width = 76.0/11 = 6.91′.
Sum of Values = 190.0
Value= 190.0/11 = 17.3%
Area sampled over = 6.91′ x 50 = 345.5 sq. ft.
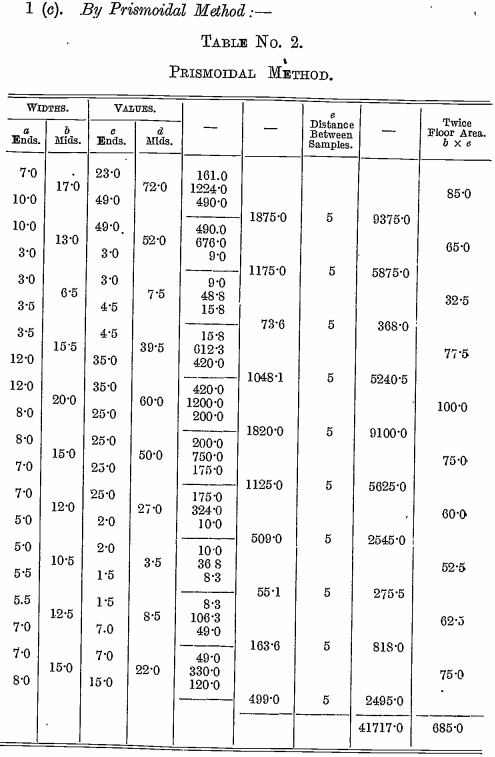
Value x width x distance = value x area sampled over = 41717/6 = 6953.
Area sampled over = 685/2 = 342.5 sq. ft.
Value = 6953/342.5 = 20.3%.
1 (d). By Proposed, Graphic Method:—(Pl. XI., fig. 3.)
Planimeter measurement of assay width figure = 25-32 sq. in.
Planimeter measurement of assay width figure = 3-45 sq. in.
To bring the areas to the same ratio, multiply the area of the assay width figure by 3, because the assay widths (ft. per cent.) were plotted to a scale of 30 ft. to 1 in., and the width 10 ft. to 1 in.
Assay width area = 25.32 x 3/3.45 = 22.0 %.
Area sampled over = 345 sq. ft.
For the sake of comparison the writer has computed the tonnage and gross value of the copper contents at £60 per ton by the four methods, 25 ft. above and 25 ft. below the level sampled, assuming 10 cub. ft. of ore to the ton.
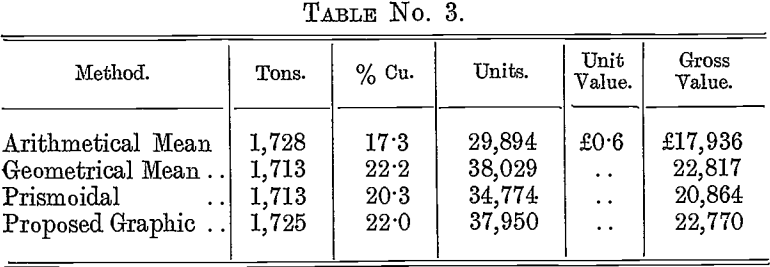
The proposed and geometrical mean methods give practically the same results—they are 1.7 and 1.9 respectively higher than the prismoidal. In ore body of such varying relative widths and values this error is quite within the limits of accurate sampling.
When Samples are at Unequal Distances
Let us suppose that a level is sampled by means of face samples (at irregular distances apart), and that the widths, values, and distances between samples are as in Table No. 4.
2 (a). By Arithmetical Mean:—
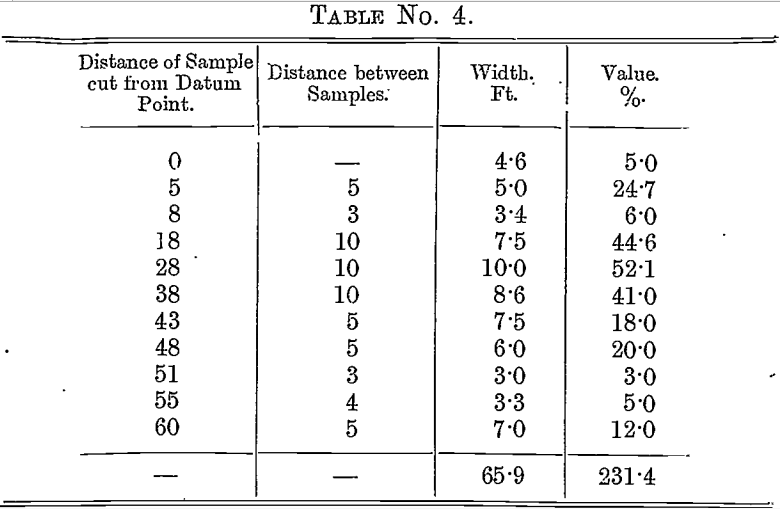
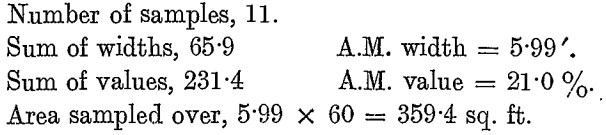
2 (b). By Weighted Arithmetical Mean :—
Sum of assay widths = 1739.5 ft. %.
Sum of widths = 65.9 ft.
W.A.M. value = 1739.5/65.9 = 26.4%
Number of samples, 11.
A.M. width (as before) = 5.99′.
Area sampled over (as before) = 359.4 sq. ft.
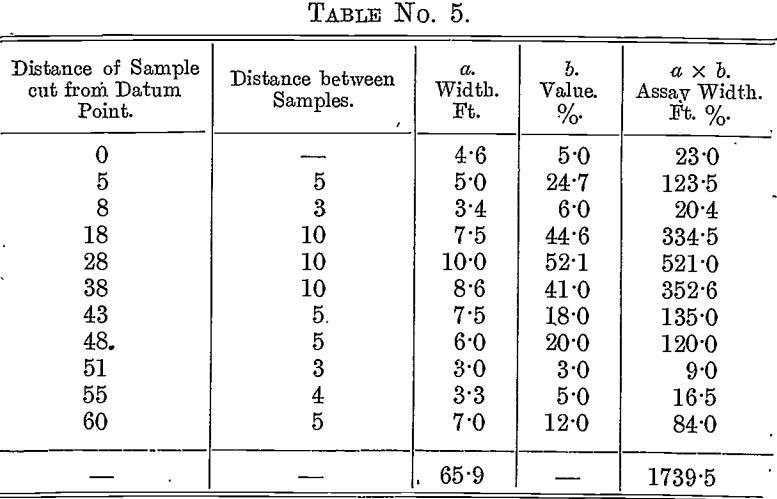
2 (c). By Geometrical Mean .—
The value is calculated as in Formula No. 1, the working of which is appended.
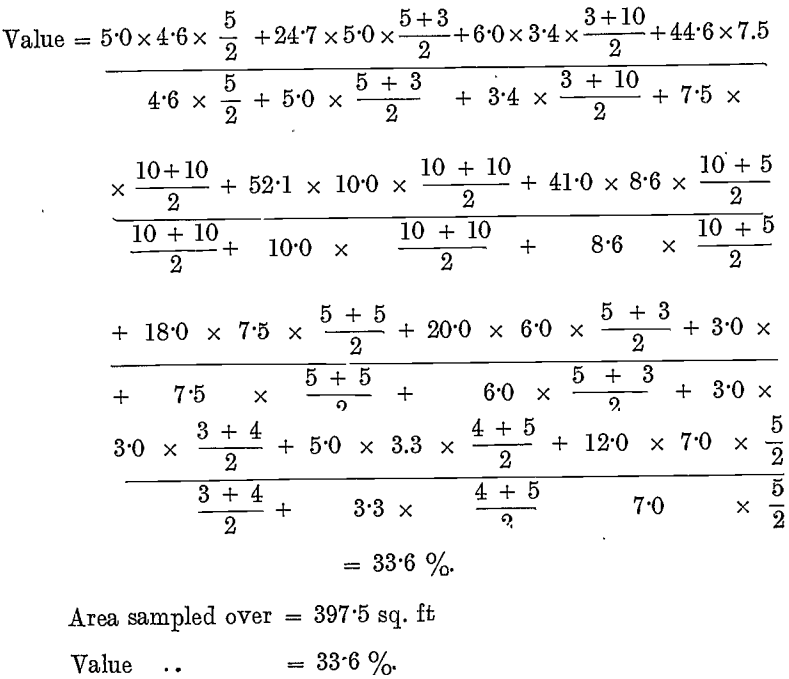
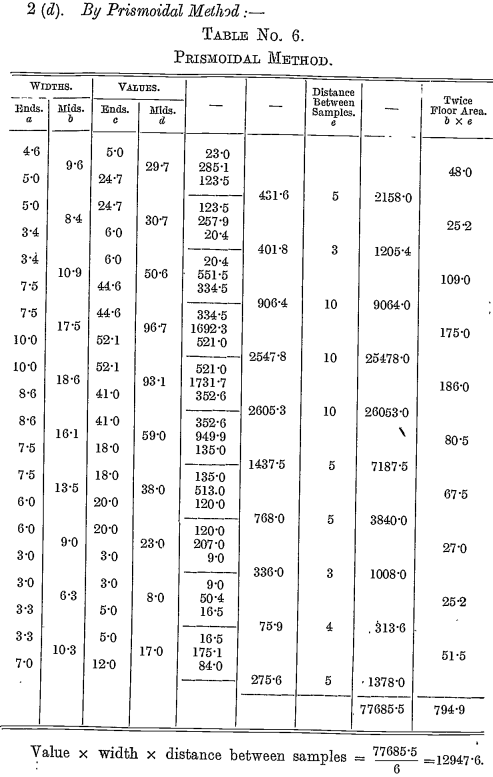
Area sampled over = 794.9/2 = 397.5 sq. ft.
Value = 12947.6/397.5 = 32.6%
2 (e). By Proposed Graphic Method .—(Pl. XI., fig. 4.)
Planimeter measurement of assay width figure = 44.10 sq. in.
Planimeter measurement of assay width figure = 3.975 sq. in.
The vertical scales for assay width and width figures are 30 ft. % and 10 ft. to 1 in. respectively. The horizontal scale of 10 ft. to 1 in. is common to both figures.
To bring the areas to the same ratio, the direct area of the assay width figure must be multiplied by 3.
Then the value over 397.5 sq. ft., the area sampled, is
44.10 x 3/3.975 = 33.3%.
Comparison of Methods
Suppose an estimate is to be made 25 ft. above and 25 ft. below the level sampled, assuming, as before, 10 cub. ft. of ore to the ton, and copper at £60, the following figures will show the results given by the five methods :—
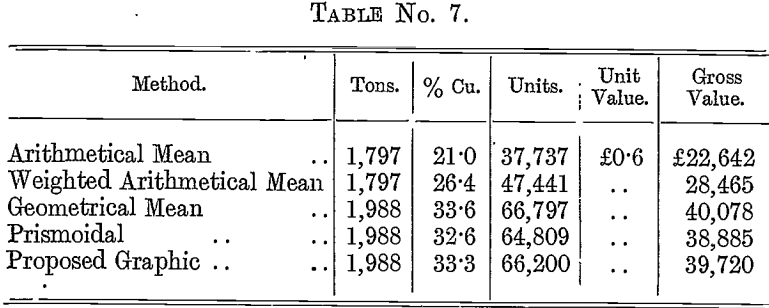
From Table No. 7 it will be seen that on the example taken the geometrical mean and the proposed graphic methods give approximately the same result, whilst the prismoidal is a little lower than the latter, but the difference between them is quite an allowable sampling error.
Discussion
Mr. Danvers Power said that as Mr. Garlick was not present he would read extracts from his paper, and, as far as possible, illustrate his meaning by diagrams and figures.
MR. J. M. Newman said it was becoming more and more recognised in Australia that the assay values and the keeping of assay value records should be in the hands of men like Mr. Garlick who were capable of dealing with them. It had been customary in the past for sampling to be in the hands of ordinary unskilled workmen. Now-a-days, however, every mining company recognised the value of skilled technical men in this department, whom they recognised as being amongst the most important men in the mine. It seemed to him that any graphic method was better than a calculating method, and for this reason, viz., that errors or inconsistencies were seen at once. He thought that Mr. Garlick had introduced some novel and interesting features into the paper.
MR. J. B. Shaw said that he regretted he had not too much time to look into the subject carefully, but he considered that the paper had presented a field for future study.