The inferred particle size model is a key part of the grinding control system presently being used. The model, as used during the evaluation period, related the percent +65 mesh material in the cyclone overflow to three of the mill operating variables: ball mill feed, mass flow of ore to the cyclones, and mass flow of water to the cyclones. The form of this equation was:
ln %+65 = K1 + K2 MFO + K3 MFW + K4 FOF
%+65 = weight percent of plus sixty-five mesh particles in cyclone overflow
MFO = mass flow of ore to cyclones (tonnes/hour)
MFW = mass flow of water to cyclones (tonnes/hour)
FOF = fresh ore feed (tonnes/hour)
where the ki values are the coefficients regressed for from sample data.
Initially, attempts had been made to include the two other main operating parameters, feed water and discharge water into the size prediction equation since previous experimenters had noted a relationship between tons of water reporting to the overflow and particle size. But when these water measurements were incorporated in the size prediction model, they caused a divergence of the regression. During the evaluation period, however, it did become apparent that the flow rate of water into the system did have an effect on the control sizing and this was incorporated into a correction. factor for the coefficient K1. This correction factor did work in bringing the sizings closer to the predicted value, but it worked best in the middle range of the total water being added indicating some form of non-linearity. Several attempts were made to incorporate this non-linearity into the model by changing the form of the model, but they failed. This failure supported the thought that the error was being introduced by the fresh ore feed sizing distribution since the amount of correction varied as the feed varied. Since the type of control system being used depends so heavily upon an accurate size prediction-model, many samples were collected for each of the grinding circuits as they were modified. It was felt that each grinding circuit might require its own size prediction model in order to provide the accuracy that had been attained on the test grinding circuit. This reasoning stemmed from the fact that the individual instruments and the physical nature of the circuit components would be different enough after calibration or during operation that an “overall” model using values from all six grinding lines would tend to average the expected results, keeping each mill from performing at its peak.
It had been realized that the orifice plate-dp cell readings for water measurement would not supply a highly accurate reading but that they would supply plus or minus two-percent of full-scale accuracy. This was felt to be an accurate enough measurement since this value was not used in the model and all that was needed was a trend or direction for the control system to act upon.
- Mill Load loop – This controls the total water added to the circuit to maintain the mass flow of ore to the cyclones at the setpoint value.
- Ball Mill Discharge Solids – This controls the discharge solids by adjusting water flow to the feed end of the mill.
- Fresh Ore Feed Rate – This controls the feed rate by the value of the predicted grind.
- Sump Level/Pump Speed – This controls the flow of material through the circuit, dampening pulsations from the mill.
After several mills came on-stream it was observed that the water measurements varied substantially between the different mills, and it became obvious that the amount of error was much larger than the expected plus or minus two-percent of full-scale. At this time, a concerted effort was made at collecting a large number of samples at various conditions so that the water measurement problem could be solved. In order to check these water values, samples were taken of the cyclone overflow in the same fashion as model development samples, but the overflow pulp density was calculated as well. The actual tons of water leaving the circuit was calculated from the samples and this water value was then compared to the values that the computer system measured coming into the circuit. The orifice plate calculations were then corrected by the appropriate factor and the process was started over again.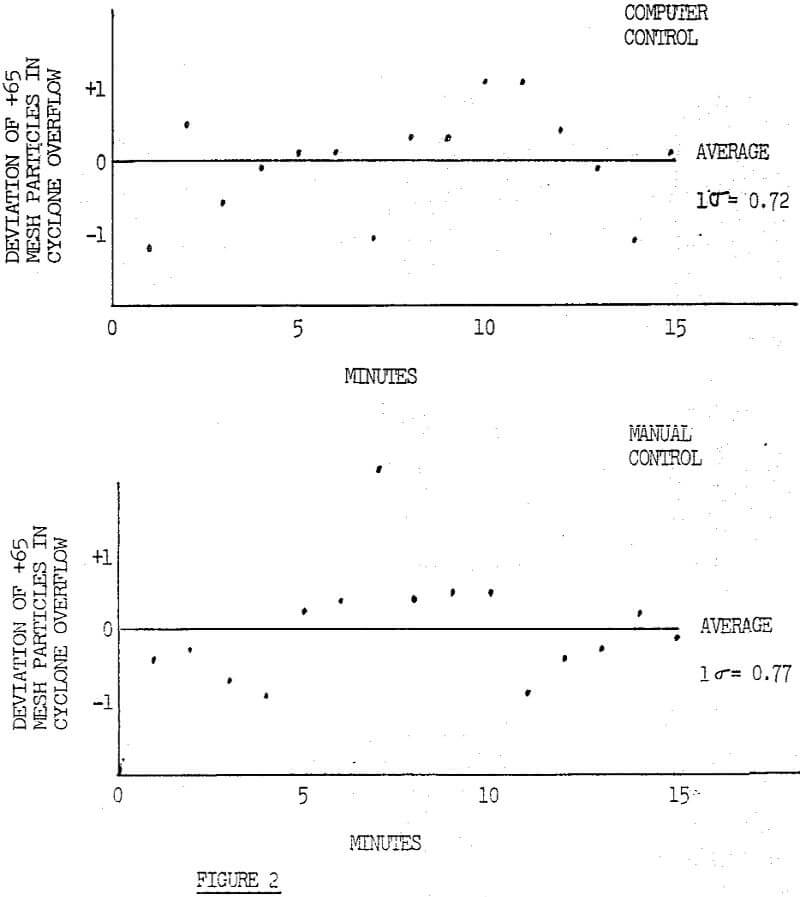
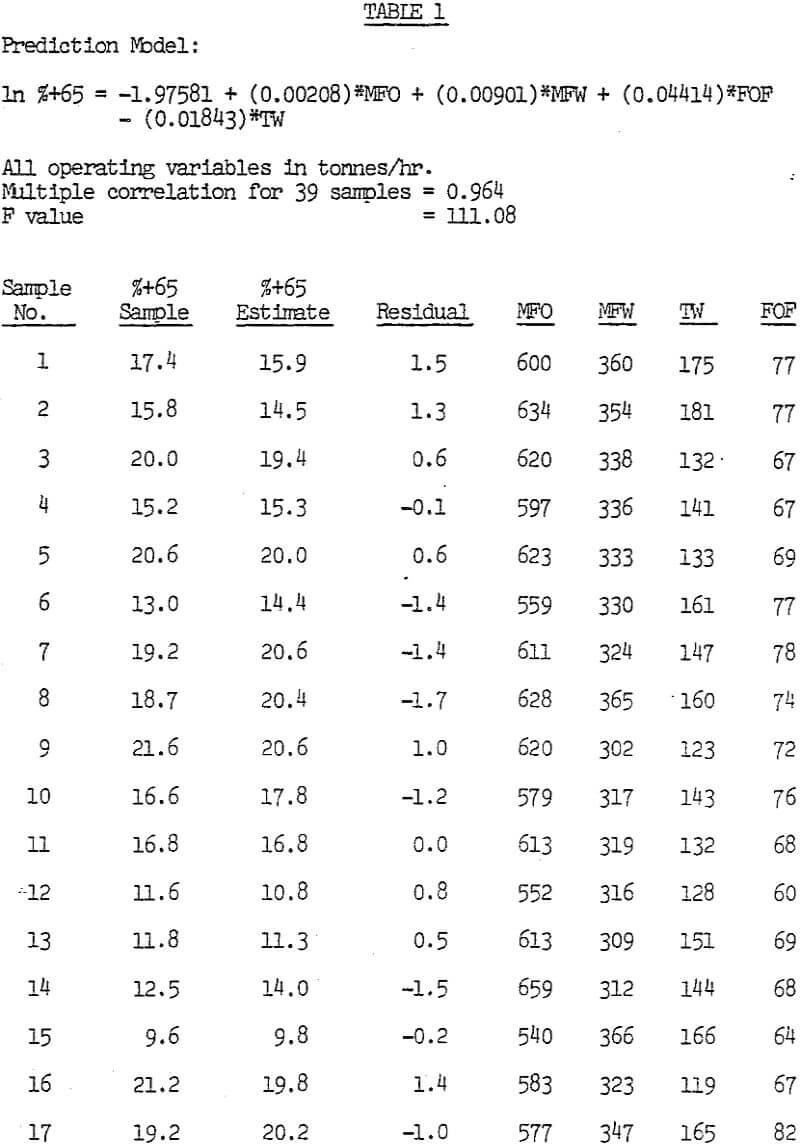
As a consequence of this water calibration program, it was decided to use the water values leaving the circuit as calculated by the samples in a regression equation for model development. It was realized that the measurement of water leaving the circuit would contain sampling errors and that the assumption of steady-state conditions would have to be made. The sampling errors would have to be minimized by taking extra, care in collection and preparation, and the assumption of steady-state is good when you consider the graph in Fig. 2 showing the short range stability of the computer-controlled circuit. Also, the operator inspects the circuit parameters to detect circuit changes, if there are any, before sampling is done. The model for the third grinding line using the total water (TW) as one of the measuring variables is:
ln %+65 = K1 + K2 MFO + K3 MFW + K4 FOF + K5 TW
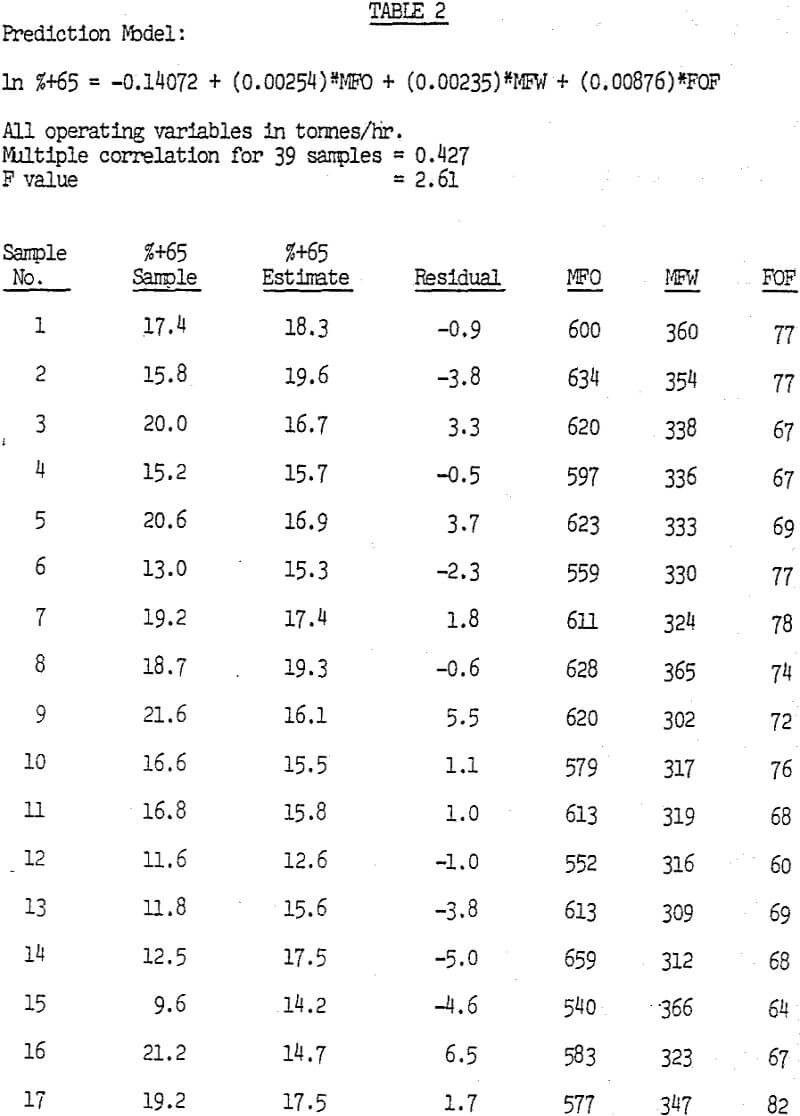
and a listing of typical samples is given in Table 1. For comparison, using the same data, a model is developed without the total water and is shown in Table 2. The typical data, as shown, was gathered about the circuit over a period of 18 months and the wide range of %+65 values were used to test the effective range of the model.
The new model has several important advantages over the original. Not only does it provide for a more accurate size prediction over a wider range of sizings, but it also de-emphasizes the importance of the mass flow instruments.
In the original model it was imperative that the mass flow instruments be in calibration in order to provide accurate values for model prediction. This is not the case with the TW model since the additional term reduces the effect of the other three by approximately one-third. This takes some of the emphasis off of the mass flow instruments whose calibration has been eased somewhat in the newer models, but the checking of these calibrations by sampling is still difficult. The measurement of the water flow into the circuit is a relatively easy one, provided a more accurate instrument is used than the orifice plate dp cell combination. At the present time a search for a more suitable water measuring instrument is being made.