
Table of Contents
Flotation is the most widely used beneficiation technique in the minerals industry. The kinetics of flotation is governed by the rates of bubble-particle attachment and bubble-pulp separation. Both processes interact significantly in a conventional flotation unit operation, making it virtually impossible to optimize one of the processes without sacrificing the effectiveness of the other. In most cases, the bubble-particle attachment is the slowest step in the flotation process, often requiring 5 to 15 min residence time to complete the mineral flotation. Ores processed in the future will be of lower grade and finer grained. As a result, the bubble-particle attachment will decrease significantly. Larger flotation circuits with much longer residence times will be required for the same production capacity. Therefore, a faster flotation process will be needed to efficiently process larger tonnages at smaller particle sizes.
Recent hydrodynamic flotation research by the Bureau of Mines has shown the importance of turbulent agitation on the recovery of fine particles. This research showed that the agitation caused by microscopic eddies contained within the turbulent fluid flow increased the particle-bubble collisions, produced faster flotation kinetics, and resulted in higher recovery of the fine particles. This research also showed that the most effective agitation within a conventional flotation cell occurred in only a small portion of the cell volume. Consequently, to optimize flotation kinetics, the agitation energy needs to be concentrated on the pulp only long enough to attach the particle to the bubble.
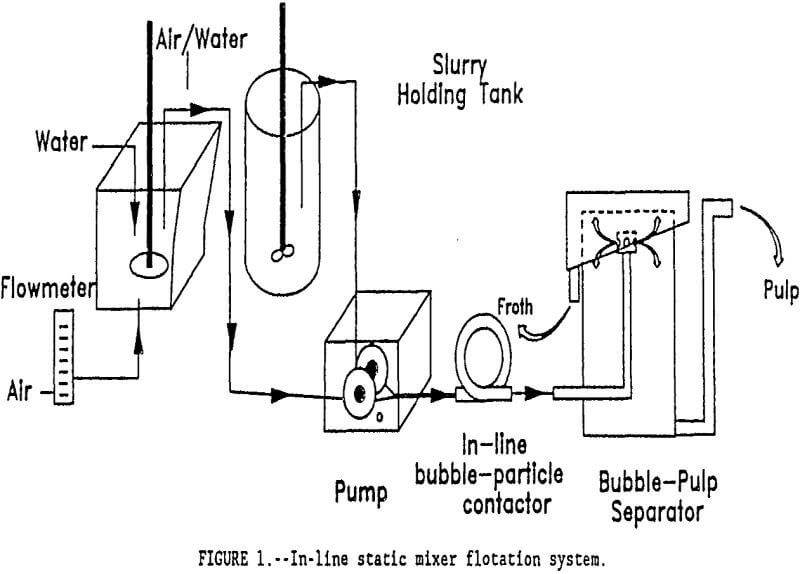
As a part of the Bureau of Mines’ effort to advance the technology of flotation beneficiation, an improved flotation system was developed made up of discrete unit operations for bubble-particle attachment and bubble-pulp separation. This system features an in-line static mixer for bubble-particle attachment and a shallow-depth unit for bubble-pulp separation. Bubbles of approximately 100 µm in size were generated externally using a spinning disk bubble generator. Sebba, showed that at very high rotational speed, a spinning disk shears air and water and forms fine-sized bubbles. Both the ore pulp and the bubble slurry were combined and vigorously mixed as they passed through the static mixer. After passing through the static mixer, the froth concentrate was recovered in the bubble-pulp separator.
The in-line static mixer flotation system was tested with a western porphyry copper ore to demonstrate flotation rate improvements on a common sulfide copper ore containing chalcopyrite. This paper presents the design parameters of the in-line static mixer flotation system and its application for recovering copper from a western porphyry copper ore.
In-line Static Mixer Flotation System
Apparatus
A semi-continuous flotation system was designed to agitate the bubble and mineral pulps as they flowed through an in-line static mixer and to continuously remove the mineral laden bubbles from the ore pulp. A diagram of the in-line static mixer flotation system is shown in figure 1. The bubbles are externally generated by a spinning disk generator. A dual head peristaltic pump was used to meter both the bubble slurry and ore pulp and to maintain a constant ratio of bubble-slurry to ore slurry over the range of feed rates tested. Both streams were combined in a 0.44 cm I.D., T-fitting positioned immediately ahead of the static mixer.
Several static mixers were tested. The basic static mixer was a 0.44 cm diam, stainless steel pipe with a spiral mixer inside. The spiral mixer protruded 0.2 cm inward from the pipe wall at about 0.05 cm width. The spiral completed one revolution every 0.5 cm throughout the length of the pipe. The agitation energy dissipated in the static mixer was equal to the headloss:
hL = f 1/d V²/2g……………………………………………………………………….(1)
where hL is the fluid energy headloss, f is the friction factor, l is the length of the mixer, d is the diam of the mixer, V is the flow velocity, and g is the gravitational constant. In the static mixer the flow resistance was caused by the drag of the spiral mixer as it projects into the flow stream within the pipe. The friction factor of the flow through the static mixer was determined by balancing the fluid energy headloss through the static mixer system. Using water, the friction factor of the static mixer was 0.038. Plotting this friction factor and the expected Reynolds number for the flow in the static mixer on a Stanton diagram indicates that the fluid flow within this static mixer is characterized as transition turbulent flow for all flow rates tested. This type of fluid flow generates dissipation eddies within the fluid that intimately mix the bubbles and particles as they flow through the static mixer.
Three mixer lengths (36, 84, and 204 cm) were tested. To conserve space each mixer pipe was bent into a 7.6 cm diam coil. The 36 cm long
mixer was colled 1.5 revolutions and the 84 and 204 cm long mixers were coiled 3.5 and 8.5 revolutions, respectively. Smaller diameter static mixers (0.22 cm diam) were constructed, but plugged repeatedly in subsequent testing. Larger (0.88 diam) mixers were considered, but the expected Reynolds number and relative roughness were low.
After passing though the static mixer, the bubble-pulp slurry entered a 20-cm-diam tank, 44 cm deep, where the froth concentrate was recovered. For rapid bubble separation from the pulp only a shallow depth was required. The mixture entered the separator through a central sparger that distributed the ore slurry radially throughout the tank. The sparger was positioned only 0.5 cm from the top of the tank. The bubbles rose quickly to the top where they overflowed at the outer edge of the separator. The effective volume of the bubble separator (315 cm³) was considered to be the height above the sparger plus an equal distance below the sparger. The remainder of the tank volume was used to collect the tailings product. An overflow weir pipe was used to discharge the tailings pulp beneath the effective volume of the separator. The froth height could be maintained by adjusting the height of this overflow weir pipe.
Sample Description
A sample of copper ore containing 0.67 pct Cu was obtained from a porphyry copper mine in Arizona. The major sulfide mineral was chalcopyrite with smaller amounts of pyrite. The gangue was mostly plagioclase feldspar with smaller amounts of biotite and magnetite. The chalcopyrite was widely disseminated throughout the ore pieces and the liberation size was around 210 µm.
Experimental Procedure
For each flotation test, the ore sample was ground with clear saturated lime water for 10 min in a laboratory rod mill at 70 pct solids and screened at 210 µm size. The plus 210 µm size fraction was reground for an additional 8 min. The ground ore pulp was diluted to 50 pct solids for flotation with clear saturated lime water (pH 12.5). The ore sample was conditioned with 0.1 g/kg potassium amyl xanthate for 5 min in a stirred tank. Then the conditioned ore suspension was pumped through the in-line static mixer, along with the bubble slurry, to the separator. Saturated lime water was used as the process water to maintain the pH. To stabilize the bubbles, Dowfroth 1012, at a dosage of 25 ppm was used in the process water. Reagent dosages in excess of those required to float the copper were used so that the resulting flotation kinetics would indicate the effectiveness of the flotation system. This scheme, however, did allow the flotation of some gangue materials which lowered some concentrate grades.
After pumping the conditioned pulp through the flotation system, the tailings product was repumped through the system three more times to simulate the effect of flotation staging. The froth concentrate from each of the four stages and the final tailings were weighed and analyzed for copper. The copper distribution after each of the four passes through the system was used to determine the flotation rate constant. The pressure drop across the static mixer system was measured to calculate the headloss and energy consumption of the system. The energy required to generate the bubbles was not included in this calculation.
Conventional laboratory batch flotation tests were conducted with a 500-g DR flotation cell on the Cu ore under the same reagent and pH conditions for comparison with the in-line static mixer flotation tests. Samples of the flotation concentrate were taken after 2 and 5 min to establish the flotation kinetics of the conventional laboratory flotation cell. Torque measurements were made on the impeller shaft to determine the energy requirements for the conventional laboratory cell.
Experimental Results and Discussion
The in-line flotation system was tested at pulp flow rates of 350, 600, and 1320 mL/min. The dual head peristaltic pump maintained the air to ore ratio at 0.44 mL/g, a value well in excess of the theoretical requirement. The bubble slurry contained 35 pct air by volume and the ore pulp was at 50 pct solids by weight. As shown in table 1, the combined flow rates of the
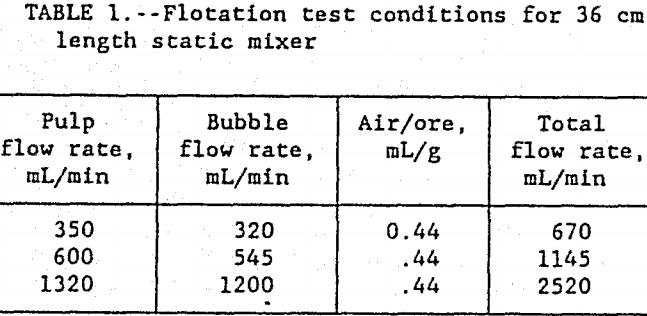
ore pulp and bubble slurry were 670, 1145, and 2520 mL/min. After combining both streams, the in-line static mixer contained 17 vol pct air bubbles, 69 vol pct water, and 14 vol pct ore. This is equivalent to a 35 wt pct solids ore slurry with bubbles.
It is generally accepted that flotation follows first order kinetics such that
![]()
where Rt is the Cu recovery at time t, R∞ is the Cu recovery at t=∞, and k is the flotation rate constant. Neither the conventional nor In-line static mixer flotation results exactly fit first order kinetics, however, in order to use a simple basis for comparison, the time required to obtain 90 pct recovery, t90, was determined graphically from the flotation data. The first order flotation rate, k90, was calculated as follows:
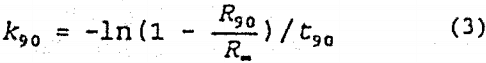
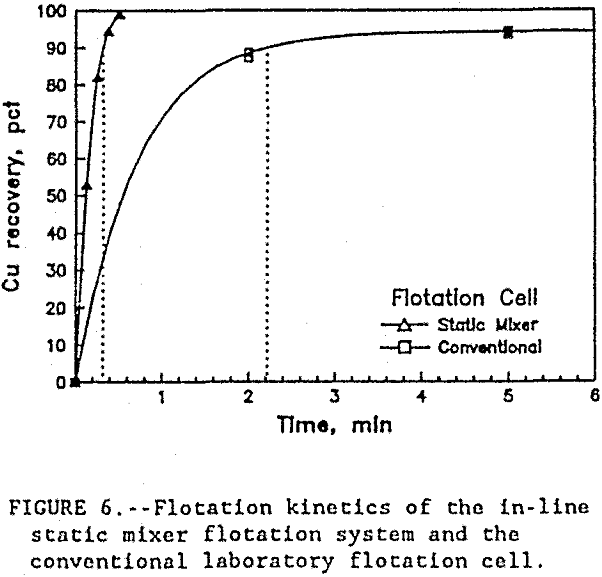
While the k90 is not a perfect fit to the data, it allows direct comparison of the flotation results from different flotation tests in an easily understandable fashion. For the conventional cell, 90 pct recovery was obtained after 2.2 min with a flotation rate (k90) of 1.0 min-¹.
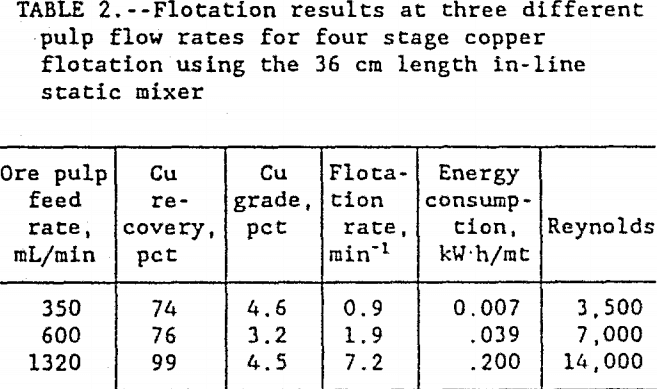
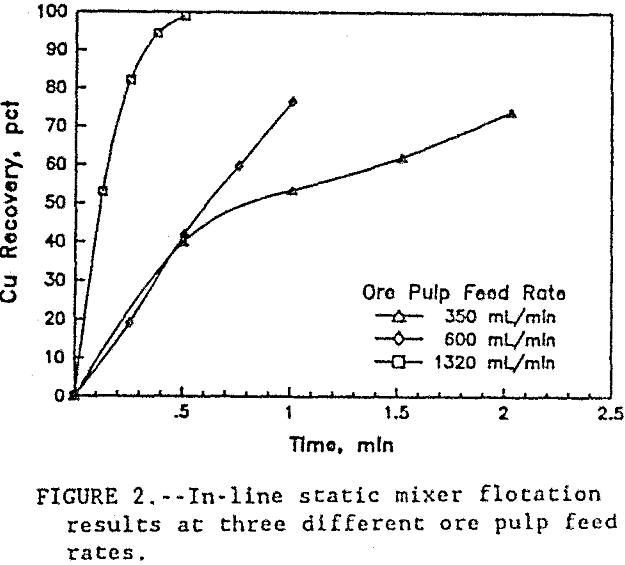
As shown in table 2, the best results were obtained at a pulp flow rate of 1320 mL/min with the 36 cm long static mixer. In four stages through the flotation system, over 99 pct of the copper was recovered in a 4.5-pct Cu concentrate at a flotation rate 7 times faster than conventional flotation. The flotation kinetics at each flow rate, shown as recovery versus time, are given in figure 2. The flotation kinetics at lower flow rates were both slower and less effective than those at the high flow rate. Flow rates above 1320 mL ore pulp/min were not tested, because that was maximum capacity of the present pumping system.
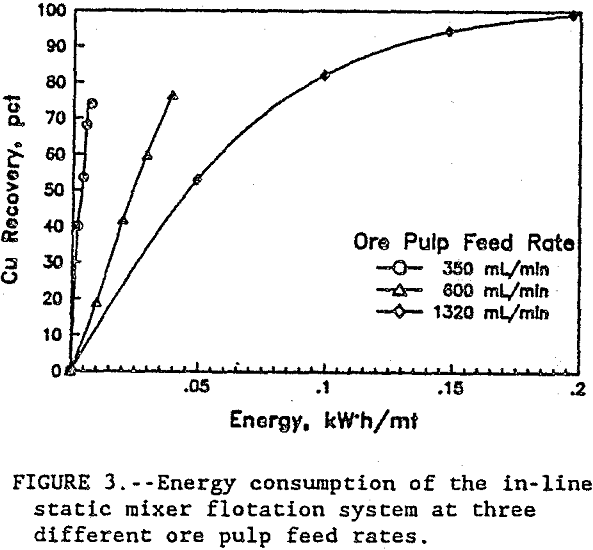
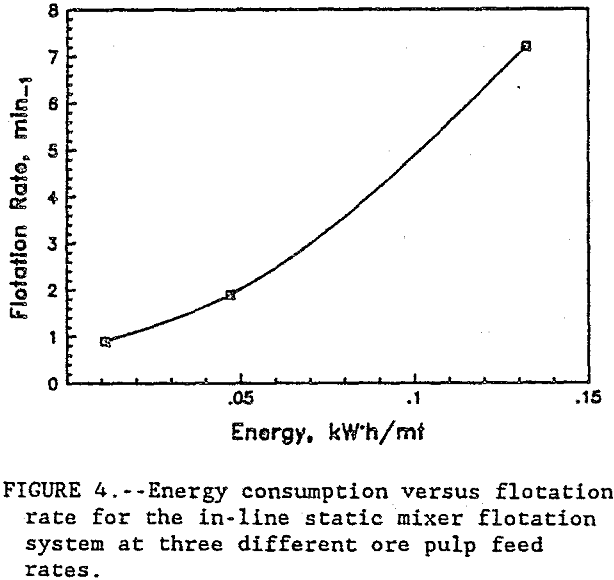
In figure 3, the energy consumption versus Cu recovery shows that, at the lower flow rates, the energy was more efficiently used co recover the Cu. At the 350 mL/min ore pulp feed rate, the first stage flotation recovered 40 pct of the Cu using only 0.0025 kW·h/mt. At 1320 mL/min ore pulp feed rate, the first stage flotation used 20 times more energy at 0.049 kW·h/mt to recover 53 pct of the Cu. Each data point in figure 3 represents a separate flotation stage. After four flotation stages at 350 mL/min ore pulp feed rate, 74 pct of the Cu was recovered. But at 1320 mL/min ore pulp feedrate, 82 pct of the Cu was recovered in just two flotation stages. Half as many flotation stages were required at the high feed rate to recover more Cu than at the lower feed rate. At 90 pct Cu recovery, figure 4 shows the relationship between the energy consumption and the flotation rates. The high ore pulp feed rates produced the fastest flotation, but at the highest energy consumption. Improved flotation kinetics were obtained only at the expense of higher energy consumption. In general, test results show that recovery was related to the number of bubble-particle collisions and the number of bubble-particle collisions was related to agitation intensity.
A plot of the Reynolds number and friction factor on the Stanton diagram showed transitional turbulent flow characteristics within tho mixer. The headloss through the static mixer system is due to the dissipation of the fluid energy in small eddies that mix the chalcopyrite and air bubbles. Based upon the calculated headloss through the mixer, the calculated mixing intensity in the static mixer at the high feed rate was 0.12 W/cm³. At tho 350 and 600 mL ore pulp/rain feed rates, the mixing Intensity was only 0.002 and 0.014 W/cm³, respectively. This lower mixing intensity resulted in fewer bubble-particle collisions and slower flotation kinetics. However, at 0.12 W/cm³ with the 1,320 mL ore pulp/min feed rate, the mixing intensity was sufficient for rapid attachment of the bubbles and chalcopyrite particles.
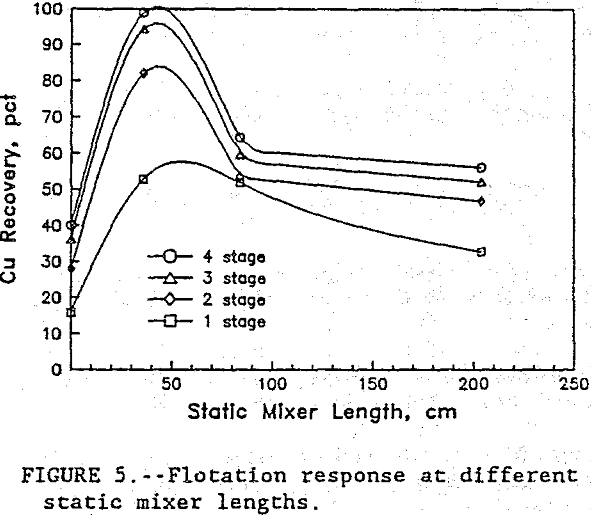
The effect of the static mixer length is shown in figure 5. Tests were conducted at 1,320 mL ore pulp/min without a static mixer (length = 0) and at each of the three mixer lengths. Without a static mixer some flotation did occur, but it was not very effective. The calculated mixing intensity in each mixer was the same, but the different lengths resulted in longer exposure to the mixing agitation. Both of the longer static mixers showed a significant decline in the flotation response. The froths recovered during the two long static mixer tests contained large slugs of air indicating that coalescence of the bubbles was occurring in those tests. Possibly, as the bubbles coalesced some of the chalcopyrite particles were detached resulting in lower Cu recovery. Based upon the flow rates, the residence time in the 36 cm long, static mixer was only 0.12 s and there were no signs of bubble coalescence. The residence times for the 84 and 204 cm long, static mixers were 0.28 and 0.69 s, respectively, and both of those static mixers did show signs of bubble coalescence.
Although 99 pct of the Cu was recovered in four stages, after three stages, the in-line unit had recovered over 94 pct of the copper in a 5.7 pct copper combined concentrate. A still higher grade combined concentrate was obtained with just two stages which produced a 8.7 pct Cu, combined concentrate and recovered 82 pct of the copper, as shown in table 3. The first two
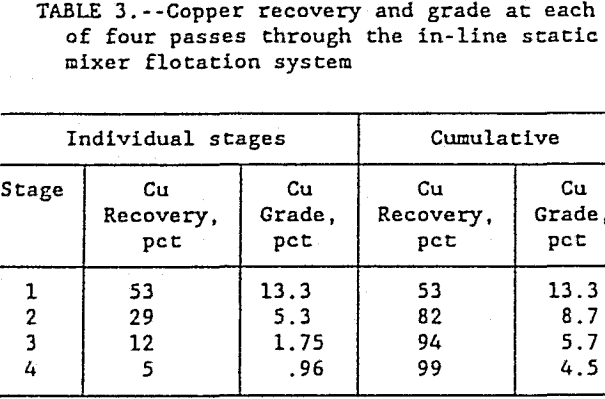
flotation stages recovered 82 pct of the copper in a high grade 8.7 pct concentrate and the third and fourth stages recovered the remaining 17 pct of the copper in a low grade, 1.4 pct concentrate. This low grade concentrate is best suited as a scavenger concentrate and should be recirculated to the first flotation stage. This demonstrates the flexibility afforded by multiple staging of the in-line flotation system to optimize the flotation circuit for recovery and grade.
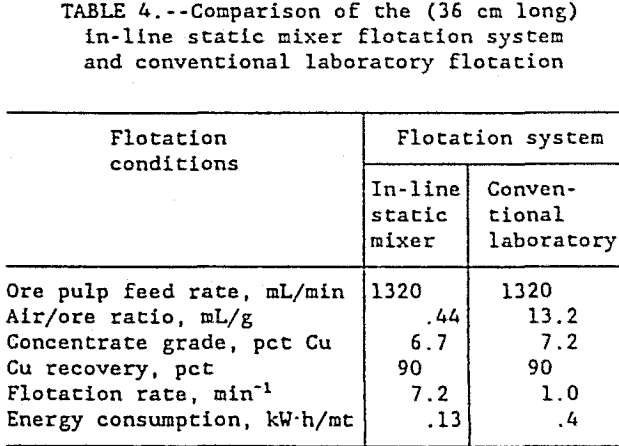
Finally, a comparison of the in-line static mixer flotation system and the conventional laboratory flotation cell is shown in figure 6 and table 4. The in-line static mixer flotation system recovered more copper, faster, and at lower energy consumption than the conventional laboratory flotation cell.
Concluding Remarks
In-line static mixer agitation effectively mixed the air, water, and ore to quickly attach tho chalcopyrite particles to the surface of the air bubbles. As the mixture entered the shallow-depth separator, the mineral-laden bubbles were quickly floated away from the ore pulp. The in-line static mixer flotation system
was effective for copper flotation at a flotation rate 7 times faster than conventional laboratory flotation, recovering 99 pct of the copper ore in a rougher concentrate containing 4.5 pct copper. This rougher Cu concentrate, which represents the combined concentrate from four flotation stages, could be increased to commercial grade by recirculating the lower grade concentrates to previous circuits for cleaning and upgrading. Also, the in-line flotation system has a higher capacity per unit volume of flotation cell than conventional laboratory flotation. Energy requirements for the in-line static mixer flotation were also lower than the conventional flotation cell, but only a laboratory scale system has been tested. Additional testing is needed with a larger system to more accurately measure the power consumption of the process.