
Table of Contents
In researching ways to improve the recovery of minerals from in situ leaching operations. Such operations are amenable to recovering low grade ore, reducing many of the typical mining operations cost, and presenting environmental benefits. Hydraulic properties and characteristics of copper ore are investigated to assess the impact of permeability on flow capacity during in-place, copper leaching operation. The Lakeshore deposit at Casa Grande Mine provided an excellent test example for this investigation. The Lakeshore copper oxide ore is a heterogeneous, unsaturated, and fractured medium in which the permeability is dominated by a network of macrofractures, defining blocks of rock of various sizes. Upon saturating the macrofractures, these act as a network of distributed sources and sinks for flow of solution into and out of the rock matrix. Since copper is disseminated throughout the rock matrix, understanding and exploiting permeability conditions are essential for successful leaching operations in both the matrix and fracture system. This study provides insight into fluid flow behavior within the rock blocks, following saturation of macrofractures.
In general, it is difficult to quantify unsaturated flow in a heterogeneous rock mass. Moreover, few direct measurements of permeability and flow characteristics have been made. One problem hindering direct measurement is associated with the excessive time involved (months or years). Another problem stems from limitations in test equipment.
The approach used to assess transient migration of fluids at the Casa Grande mine site first estimated hydraulic properties indirectly, using models that account for dependence of saturation on water pressure head (also known as matric potential, negative capillary pressure, and negative suction head). Empirical relationships associated with retention properties of the porous medium are then combined with theoretical models of unsaturated flow to approximate permeability and hydraulic conductivity relationships. In turn, this information and appropriate boundary conditions are combined for input into a two-dimensional, unsaturated, finite-element flow code called TWOD. Results are used for the development and optimization of a site-specific hydrologic design for in situ leaching in heterogeneous, fractured, and initially unsaturated copper oxide ore deposits.
Copper Oxide Ore
Moisture Retention Properties
Understanding the transient nature of fluid migration associated with the leaching of an unsaturated copper ore deposit, requires characterization of its moisture retentive properties (or moisture capacity). Insight into the copper ore moisture capacity can be gained through knowledge of the size and distribution of its interstices. In an unsaturated medium, the hydraulic pore radii and/or fracture aperture are changed by variations in the pressure head, which, in turn, causes changes in the saturation, S, or moisture content. The graphical expression is called the moisture retention, capillary pressure, or characteristic curve. The slope at any given point on the moisture retention curve represents the specific moisture capacity of the medium.
Methodology
Before the late 1970’s, methods for determining moisture retention curves in porous media were classified into two main categories. One method involved the removal of fluid (drainage), or introduction (imbibition) of fluid in a core using a high-displacement pressure, porous diaphragm. The second method removed fluid from a sample by subjecting it to centrifugal forces. Both the diaphragm and centrifugal approaches, however, have limitations. The diaphragm method suffers due to limitations of displacement pressure. Conventional testing is limited to a maximum of about 200 psi (about 140 cm of equivalent water pressure head). Since the air entry value for rock typically exceeds hundreds of centimeter pressure head, this application is not expected to yield a complete retention curve. Compounding this problem is the time, several days to several weeks, usually required to achieve steady-state equilibrium for a given pressure increment. Hence, the test duration is likely to be at least a month. Although the centrifuge method offers a distinct advantage over the diaphragm method by arriving at saturation equilibrium in a comparatively short time, the method has the disadvantages of the tedious reduction of data to arrive at water retention curve, has comparatively high cost, and only the drainage portion of the moisture retention curve can be obtained.
Recent advances in property testing, however, have led to the development of a miniature thermocouple psychrometer and mercury porosimetry techniques for characterizing the moisture retention properties of porous media. Unfortunately, the thermocouple psychrometer testing has a major disadvantage in that information is deficient for those pores associated with water pressure head values between 0 to -20 m. Conversely, the mercury porosimetry approach has been demonstrated to yield reliable results to pressure head values equal to or greater than -3,500 m.
Considering the foregoing, the mercury porosimetry method was selected for application in this study over alternative approaches for the following reasons. First, the experimental data can be obtained in a matter of tens of minutes, since steady-state equilibrium is achieved in seconds. Second, pressures between 1.2 – 60,000 psi (equivalent to pressure head values of -0.844 to -42,000 m) could be employed making it useful for the assessment of copper ore samples. Third, the expense incurred is one third less than that for a conventional centrifuge test. The mercury porosimetry derived saturation curves, moreover, generally agree well with other methods, such as the thermocouple psychrometer tests, for equivalent water pressures to about 5,000 m in rock.
Mercury Porosimetry
The following describes the methodology used to obtain data concerning the functional relationship between saturation and pressure head for the Casa Grande copper ore, and comments on assumptions and limitations incorporated in the analysis of mercury porosimetry data analysis.
Mercury porosimetry provides an indirect method for obtaining the moisture retention curve. The technique is based on that principle that mercury behaves as a non-wetting fluid in a mercury-air filled void. Consequently, it does not penetrate the openings (i.e. pores and/or cracks) unless pressure is applied. The pressure applied to the mercury, PHg, compensates for the pressure difference over the mercury meniscus in the porous body, and it is given by
PHg = -δPc = σHg (1/r1+ 1/r2)………………………………………………………..(1)
where δPC is the capillary pressure, σHg is the surface tension of the mercury surface. Since the principal radii of curvature of the meniscus (r1, r2) are not known a-priori, the equation is written as
P = σ C……………………………………………………………………………………..(2)
where C is the curvature of the meniscus, and P is pressure. The curvature is dependent on the contact angle, and on the geometry of the pore space. For cylindrical capillaries, the expression is
C = 2 Cos θ/rc…………………………………………………………………………(3)
where θ is the contact angle, and rc the radius of the capillary tube. For a meniscus existing between two flat plates, as in a microfracture,
C = Cos θ/rf…………………………………………………………………………….(4)
where rf is the half width aperture assuming a planar microfracture. Combining equations 2 and 3 yields
P = (2 σ Cos θ)/rc……………………………………………………………………(5)
for capillary tubes. Similarly, combining equations 2 and 4 yields
P = (σ Cos θ)/rf……………………………………………………………………(6)
for microfractures. While only half the pressure is required to inject fluid into a fracture of a given width, compared with a capillary of the same diameter, the volume injected at a given pressure is presumably much greater. Although there are few cylindrical pores in a porous media, equation 5 is almost universally used to calculate pore-size distribution from moisture retention data. Even without microfractures, this expression implies that there is a linear dependence of pressure on Cos θ.
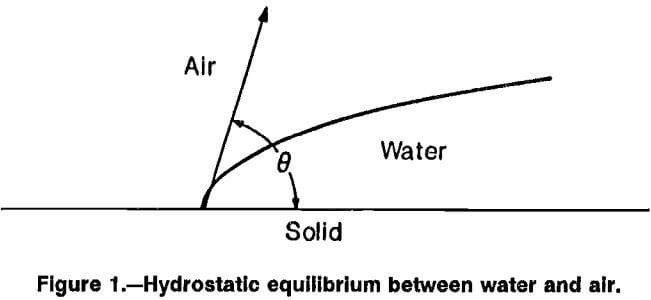
Mercury porosimetry assumes that the contact angle of mercury is larger than 90° (nonwetting phase). A graphical portrayal of hydrostatic equilibrium between two liquid phases, i.e. mercury and air, or water and air, is shown in figure 1. A problem in these contact determinations is that the solid surface is assumed to be smooth and constant. In reality, however, most solids have a rough pore and/or fracture surface. The roughness can be expected to increase the effective contact angle for nonwetting fluids. Furthermore, if the pore space does not have a circular cross section, it is expected that the contact angle will depend on the curvature in micropores. It is also likely that the contact angle will display hysteresis, depending on whether the meniscus is retreating or advancing.
Sources may act to change the tension between the wetting and nonwetting fluids present. The foregoing represent a few of the conditions when the ideal assumptions in the mercury porosimetry method differ from the actual physical conditions in the rock. Other considerations in interpretation of results when using mercury porosimetry are that the sample is small (usually 2.54 cm diameter by 2.54 cm length), and that it is possible to mechanically damage the sample, if there are a significant number of closed pores.
Sample and Petrographic Description
Representative samples of copper ore were obtained from drillholes at the 336 m level (mean sea level) of the Cyprus Casa Grande mine. These samples were used to assess the spatial variability in hydraulic properties between these boreholes. Six 2.54-cm-diameter by 2.54-cm- length samples were prepared from each drillcore and tested for saturated hydraulic conductivity and mercury porosimetry testing. Larger 2.54- by 5.08-cm samples, were also prepared for determination of porosity, Mohr-Coulomb strength parameters (cohesion, normal, and shear strength), Young’s modulus, and Poisson’s ratio. These properties are summarized and shown in table 1.
Thin sections were prepared for determining the pre-dominant mineralogy, texture, and porosity of the copper ore. Examination of these sections was aided by using a standard axioplan microscope at 3X magnification with a full-wave gypsum filter. The typical mineral assemblage consisted of fine grained rounded quartz mass, with phenocrysts of altered plagioclase feldspar (now kaolinte), biotite, hematite, and quartz.
By using an X-ray, electron microprobe, elemental distribution maps were prepared. These maps demonstrate that aluminum was present among the primary elements associated with plagioclase feldspars. This suggested that a portion of the feldspars were altered to kaolinitic clay. Copper was found to be associated with both the altered plagioclase feldspar and biotite minerals.
The mineralization suggests that preexisting microfractures once served as preferential pathways for the primary deposition of copper and quartz. These ancient microfractures now appear as solid red stringers, or meanders, throughout the sample. The quartz, however, showed no association with either the mica or clay minerals.
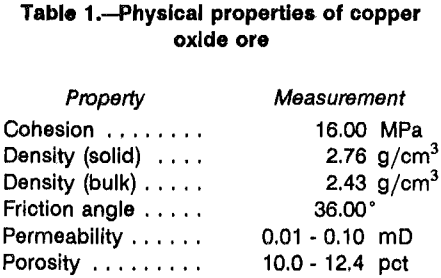
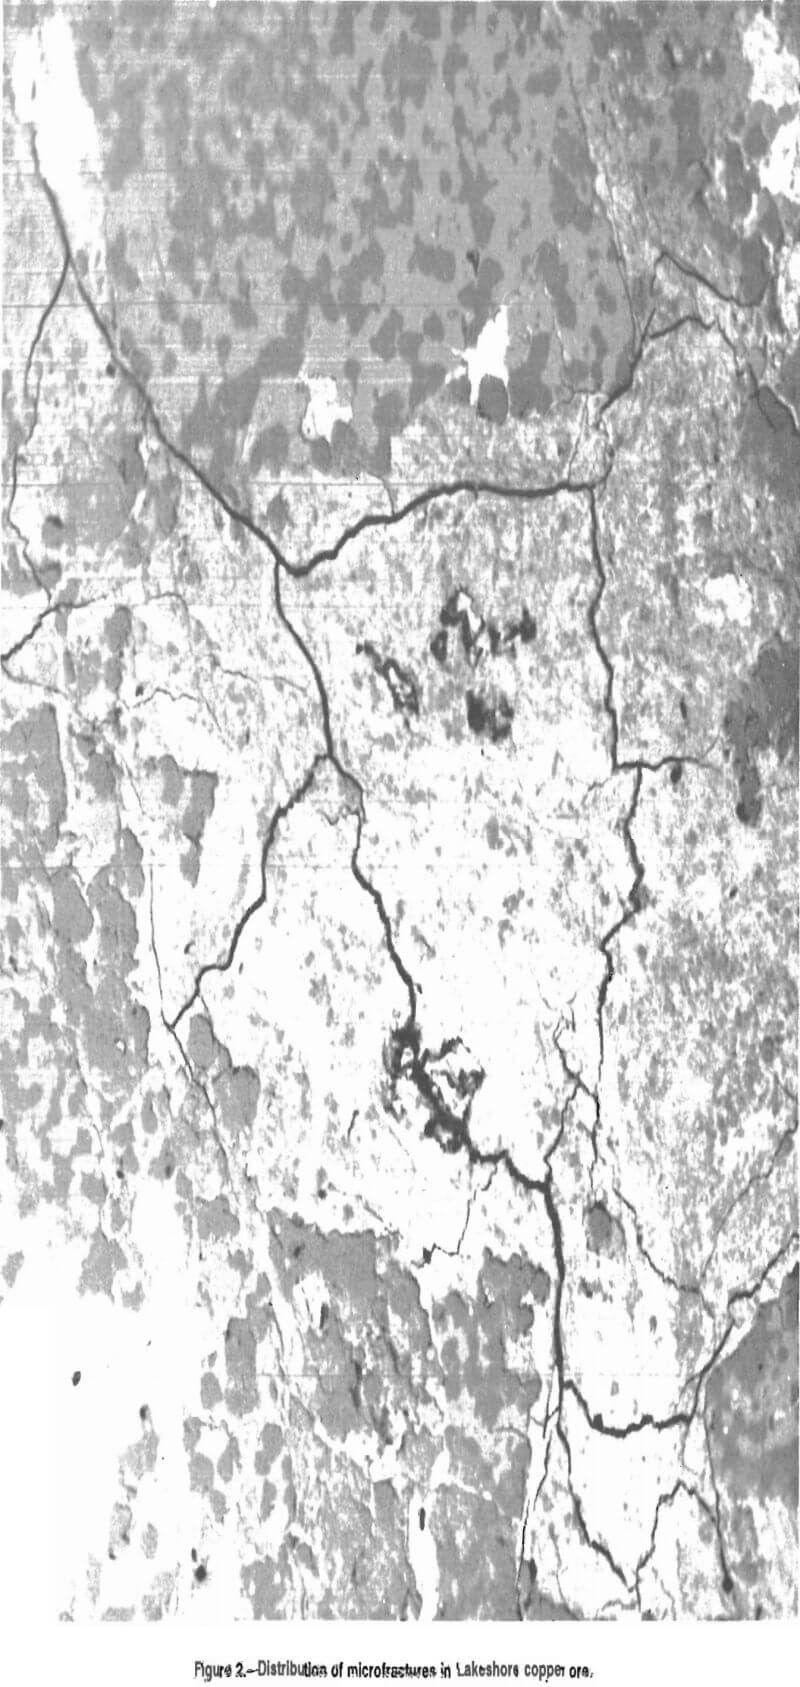
Discontinuities are evident in all the copper ore samples, as a result of two distinct porosity systems. The bimodal distribution of pores is comprised of both microfractures and micropores. The distribution of microfractures appear as dark black meanders (fig. 2). These tensional microfractures are believed to represent a distinct phase, since they transect fractures previously filled with copper and quartz. These microfractures provide a network for the lixiviant to access copper hosted minerals, increasing the relative surface area for contact. The microfactures appear to have similar aperture range (5-15 µm) in both the feldspar and biotite minerals, while smaller apertures exist in those cracks transecting the quartz mass. Examination of back scattered X-ray images at 3,000X magnification also revealed the existence of micropores at grain boundaries (fig. 3).
Mercury Porosimetry Testing
A total of six mercury intrusion tests were performed on 2.54- by 2.54-cm copper oxide ore samples, three from each drillhole. Prior to testing, all the samples were oven dried at 100° C for a minimum of 48 h. The samples were placed in the porosimeter, evacuated, and filled with mercury. The mercury level is indicated by a contact sensor with a digital readout.
Estimation of Pressure Head and Saturation
The mercury intrusion data were adjusted to account for the differences between the properties of mercury and water for use in the unsaturated fluid flow model. Assuming that capillary bundle theory holds, the equivalent water pressure head, Ψw is calculated as follows:
Ψw = (pHg σw Cos θw) / (γw σHg Cos θHg)…………………………………………….(7)
where PHg = pressure of mercury, psi;
σ = surface tension for between fluid and copper ore, dyne/cm;
θ = contact angle between fluid and copper ore;
γ = unit weight of water;
w = subscript denoting water phase;
and Hg = subscript denoting mercury phase.
The values of surface tension and contact angle were estimated to be 72 dynes/cm and 15°, and 480 dyne/cm and 135° for water and mercury, respectively.
To obtain the equivalent water saturation, the relative mercury saturation must first be calculated. This relative mercury saturation, SHg, can be determined by dividing each of the cumulative mercury intrusion, or extrusion, volumes by the total intruded volume.
where VHg = volume of mercury,
N = total number volume increments,
and i = ith increment.
The relative water saturation can now be determined by subtracting subsequent mercury saturation values from unity. This relationship is given by
Siw = 1 – SiHg…………………………………………………………………………..(9)
A water saturation of 100 pct occurs at a pressure head of zero gage magnitude. This represents a convenient reference datum where increasing positive pressures are indicative of the saturated solution domain. The point of saturation, between zero gage pressure and that where saturation begins to diminish, is interpreted as the zone of capillarity. In this fringe zone, the material is completely saturated, but bound under tensional forces. The capillary fringe extends a distance away from the saturated plume equivalent to a pressure head (air entry value), where saturation begins to diminish (below 100 pct). At increasingly negative values of water pressure head, the saturation diminishes in a nonlinear fashion; hence, this is denoted as the unsaturated zone.
The water saturation as a function of pressure head curve is most often referred to as the moisture retention (or material characteristic) curve. When referring to unsaturated media, the water pressure head sometimes is called the matrix potential, or suction head. The former two are plotted as negative values, while the latter is by convention a sequence of positive values. In this report, the term, “water pressure head” is used.
Mercury saturation occurs at a maximum positive pressure, whereas, water saturation occurs at a maximum negative pressure. This phenomenon reflects the fundamental difference between a wetting and nonwetting fluid. In the two-phase mercury-air system, the mercury is the nonwetting phase (air is wetting), while in the two-phase, air-water system, air is the nonwetting phase (water is wetting).
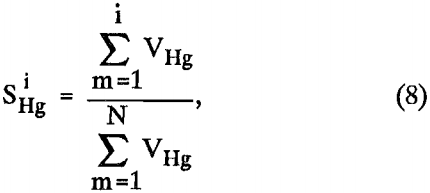
Figure 4 depicts the equivalent water retention drainage curves derived from mercury intrusion data for the copper oxide ore obtained from coreholes A and B. The two curves display similar moisture retention properties, typified by a similar shape over the same range of pressure head. Conformity of these retention curves implies structural homogeneity over the distance spanned by these coreholes. Hence, any one sample would suffice for the analysis.
The shape of a drainage curve often reflects the relative homogeneity of the pore-size distribution. If the pressure head remains constant over a large water saturation interval, the related pore dimension is considered homogeneous. Conversely, a variation in pressure head as a function of saturation implies that pore dimensions are relatively heterogeneous.
Figure 5 depicts the equivalent moisture retention drainage curve for copper oxide sample 2BI. Two prominent pore distributions are obvious; the first reflects microfractures at low, negative pressure head values associated with relative saturation of 0.8095 to 1, while the other reflects micropores at pressure head values associated with saturations from 0 to 0.8095. These results are consistent with interpretations based on the axioplan and scanning electron microscope analyses observed earlier.
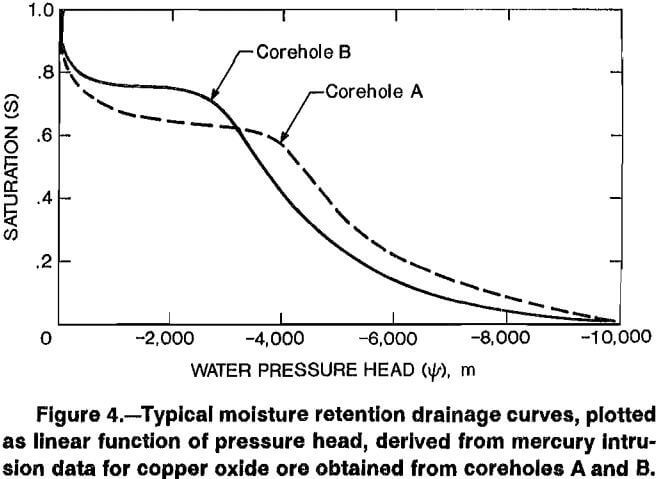
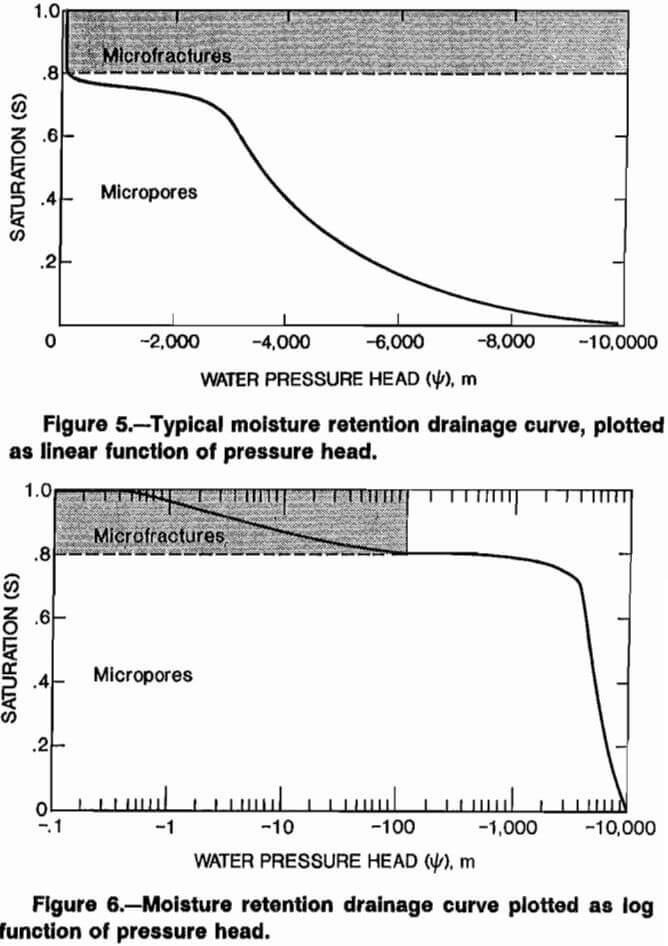
To better assess the range of pressure head values over which the saturation varies, the saturation is plotted against the log of pressure head (fig. 6). Micropores in the saturation range between 0.8095 to 0 are associated with pressure head values ranging from -150 to -10,000 m; while saturation of microfractures between 0.8095 and 1 correspond to pressure head values of -150 to -0.1 m, respectively. Test results beyond a water pressure head of about -3,500 m should be considered inaccurate because of the inability of the mercury intrusion method to penetrate micropores less than about 0.002 nm. This limitation is further reinforced because residual saturation does not, as expected, reach an asymptotic value when slightly above zero (field capacity).
Hydraulic radii, reflecting the pore-size distributions seen while draining (or drying), are calculated and displayed in figure 7 as a function of effective saturation for each of the systems observed based on the expressions,
r(Ψ) = (2 σ Cos θ) / Ψ γ…………………………………………………………………………(10)
Se(Ψ) = [S(Ψ) – Sr(Ψ)] / [Ss(Ψ) – Sr(Ψ)]…………………………………………………(11)
where r is the hydraulic radius; σ, θ, r, and Ψ are as previously defined; Se, Sr, and Ss represent the effective, relative, saturated and residual saturations, respectively. In the mercury porosimetry testing, Ss represents 100 pct saturation (S = 1). When the residual saturation is equal to zero, the relative saturation is equivalent to the effective saturation.
The microfractures appear to have the broadest pore-size distribution (greatest slope) with hydraulic half width apertures ranging from 0.15 to 33 µm. The most uniform
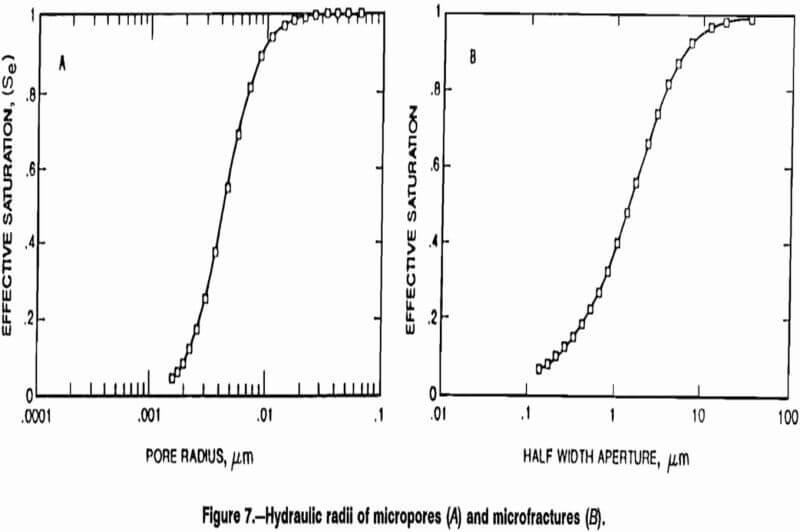
hydraulic half width aperture distribution exists between 1 to 4 µms, which is consistent with that observed using the microscope. The hydraulic radii associated with the micropore distribution ranges from about 0.0015 to 0.05 µm; however, it is uniform between 0.0025 to 0.0075 µm.
Estimating Hydraulic Properties
To be able to study the behavior of injection and recovery of leach solutions in an unsaturated setting, knowledge of permeability, or preferably the hydraulic conductivity (also known, as the coefficient of permeability, or capillary conductivity), and its relationship to moisture content is needed. The most direct way to obtain this relationship is by experiment. Reliable estimates of unsaturated hydraulic conductivity are difficult to obtain, mainly because of difficulty in obtaining representative samples and the time and expense involved. An estimate of the permeability function can be obtained, however, from the moisture retention properties already discussed, i. e., saturation as a function of pressure head. Although fluid flow phenomena in partially saturated media normally involves two-phase flow of a wetting and nonwetting fluid, usually air and water, the flow of air is seldom of major significance. Hence, the present investigation is restricted to the permeability of the water phase only.
Several unsaturated permeability models have been developed that are based on probability functions describing the relationship between the measured moisture content and water pressure head. Using the Brooks and Corey, and Brutsaert power functions, it was found that their two dependent parameters did not yield reasonable results for fitting the moisture retention curves associated with Casa Grande ore. On the other hand, the closed form expression developed by Van Genuchten seemed to provide reasonable results, requiring three dependent coefficients to be estimated. The methodology for the establishing of these constants is outlined in the following section.
Moisture Retention Curve Estimation
The Van Genuchten procedure requires plotting the effective saturation as a function of log water pressure head. By noting the saturation point, S½, located halfway between the maximum effective saturation and residual saturation point, and its corresponding water pressure value Ψ½, the slope, Sp can be evaluated. The slope is necessary to be able to determine the m coefficient given by
Next, the n coefficient is calculated (Maulem theory) using
n = -1/(m – 1)…………………………………………………………………..(13)
At this point, the m and n coefficients can be combined with an appropriate expression, equation 13 to give the relative permeability, Kr, and hydraulic conductivity, K, as a function of saturation. The modeled coefficients then can be compared with those derived from the laboratory curves. To obtain a theoretical retention curve for comparison, the a parameter must be calculated using
α = 1/[Ψ (Se-1/m – 1)1/n]…………………………………………………………..(14)
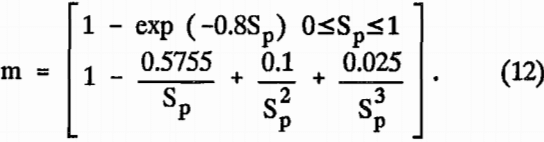
At this point, the three parameters, n, m, and α, can be substituted into the equation,
![]()
to yield a theoretical retention curve based on the chosen model.
Estimation of Fluid Permeability Function
The equation used to determine hydraulic conductivity, K(Se), as a function of effective saturation is
K(Se) = Ks Kr(Se)………………………………………………………………………(16)
where Ks represents the saturated permeability, and the relative permeability Kr(Se) is described by
![]()
A complete derivation of equations 12 through 17 is given by Van Genuchten.
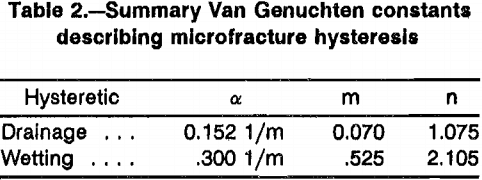
A plot of the nonlinear relative microfracture permeability distribution is presented in figure 8. This permeability function was calculated using expression equation 17, and the Van Genuchten constants: α = 0.30 1/m, m = 0.525, and n = 2.105. It is noteworthy that permeability is nonlinear and observed to decrease one order of magnitude with a 20-pct reduction in saturation. Figure 9 depicts the saturation plotted as a log function of permeability. By inspection, the permeability diminishes
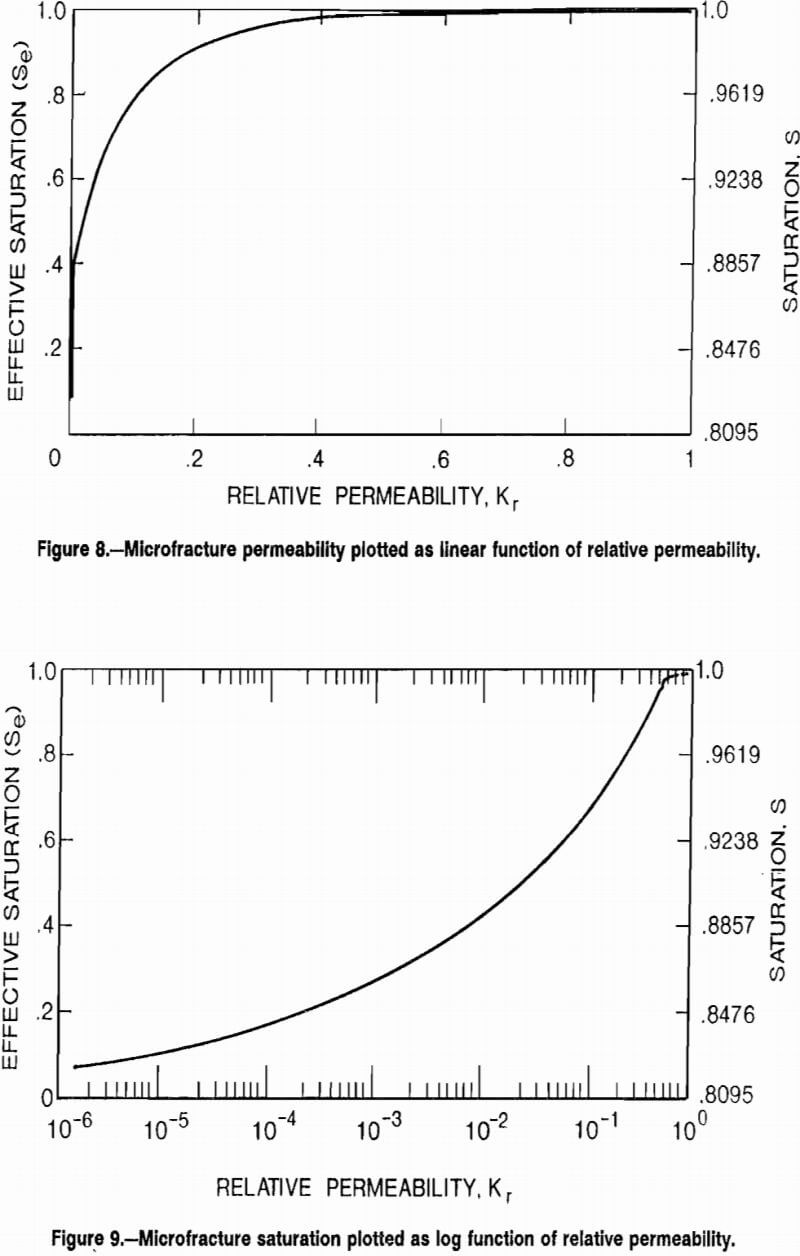
with decreasing saturation ultimately spanning six orders of magnitude. The maximum rate of permeability decrease for the Casa Grande ore occurs at saturations below 45 pct. Using the range of saturated permeability values, 10-² to 10-¹ mD, corresponding conductivity values can be obtained from the product of the relative permeability and saturated permeability. Assuming a best case, the range of permeability would be 10-¹ mD (Se = Ss = 1) to about 10-6 mD (Se = 0, Sr = .8095). While the absolute permeability for the micropores cannot be firmly established, it appears to represent the end of the microfracture continuum about 10 -6 mD. Therefore, fluid in micropores can be assumed to be immobile for the purposes of this study. Hence, the remaining portion of this study investigates only the fluid movement in the microfractures.
One obvious conclusion from the foregoing is that a decrease in saturation results in decreasing the permeability in the medium, thereby inhibiting fluid flow. From an environmental viewpoint, leach mining in an unsaturated setting presents a tractable scheme under which lixiviants may be better contained. From a production standpoint, however, permeability enhancement may require high-pressure injection, hydrodilation, hydrofracing, and/or in situ rubblizing. For either objective, site-specific modeling is required to assess injection-recovery pressure requirements.
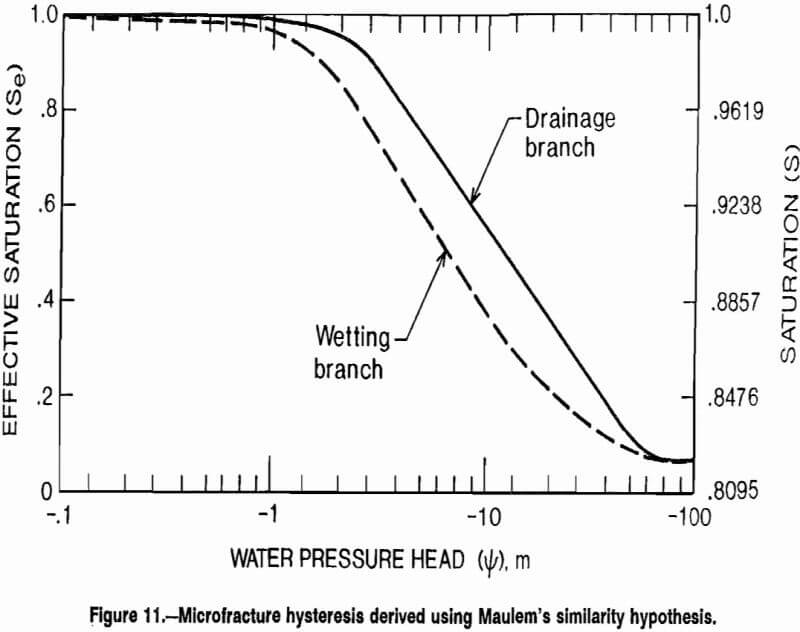
Hysteresis
Unsaturated porous media typically displays a hysteretic behavior. The two branches of the hysteretic loop (drainage and wetting) therefore see a different average effective pore-size distribution, depending on whether the sample is being saturated or desaturated. Two main causes for the hysteretic behavior are from a change in contact angle, or from the so-called, “ink bottle effect.” The former results from asperities existing along the pore wall, while the latter occurs from changes in pore radii along a given flow tube.
Since the drainage branch exhibits higher moisture content than the wetting branch at any given pressure head, the porous media becomes more retentive during the drying cycle. Hence, the average effective pore-size distribution during a drainage experiment shifts toward smaller values of pore radius than one for the wetting branch. This may, in part, explain why the half width apertures calculated from a drainage experiment are slightly less than those observed when using the microscope approach.
For modeling fluid flow from the injection into unsaturated copper ore, knowledge of the wetting boundary curve is required. Since a mercury extraction curve was not obtained during porosimetry testing, an equivalent wetting boundary curve was not originally determined.
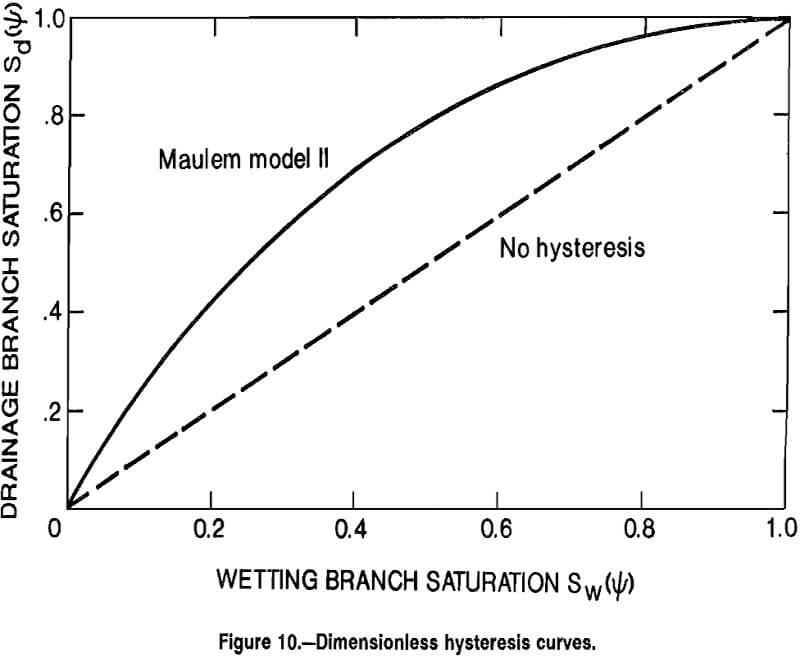
The similarity hypothesis, however, can be used to establish two models that provide the wetting branch saturation curve, Sw(Ψ), based on knowledge of the drainage branch saturation curve, Sd(Ψ). Of the two models, the Maulem model II more accurately reproduced results comparable with laboratory analysis. For this reason, the Maulem model II, given by the quadratic relationship
Sd(Ψ) = Sw(Ψ) [Sw(Ψ) – 2]……………………………………………………………(19)
was used to derive the wetting branch saturation curve. The dimensionless hysteresis curves for the hysteretic model II, or for the case when hysteresis is not present is depicted in figure 10. When there is no hysteresis effect, a linear relationship exists and flow, either drainage or wetting, follows the same path. The Maulem model II, however, produces an expected departure from the straight line flow path. Since hysteresis is normally present in rock, it is incorporated in the finite element, unsaturated flow model. Figure 11 compares corresponding hysteretic loops for microfractures. Using the Van Genuchten approach, both the drainage and wetting branch constants could be calculated. These are summarized in table 2.
Computer Modeling of Underground in Place Leaching
Mathematical Modeling
Modeling the movement of water in a partially saturated porous medium has been discussed by many authors. A review of the state-of-the-art can be found in a recent text edited by Evans. Basically, the movement of water must consider the movement of liquid water, water vapor, air, and the medium itself. The simplified approach taken here invokes the assumption of single-phase flow.
Hence, the water is considered mobile, while the air is assumed immobile.
An equation describing partially saturated and unsaturated flow of water in porous media, neglecting air-water interactions, can be derived by the principle of conservation of mass and the constitutive relationship given by Darcy’s law. Variably-saturated flow in a vertical plane, and anisotropic media, is given by
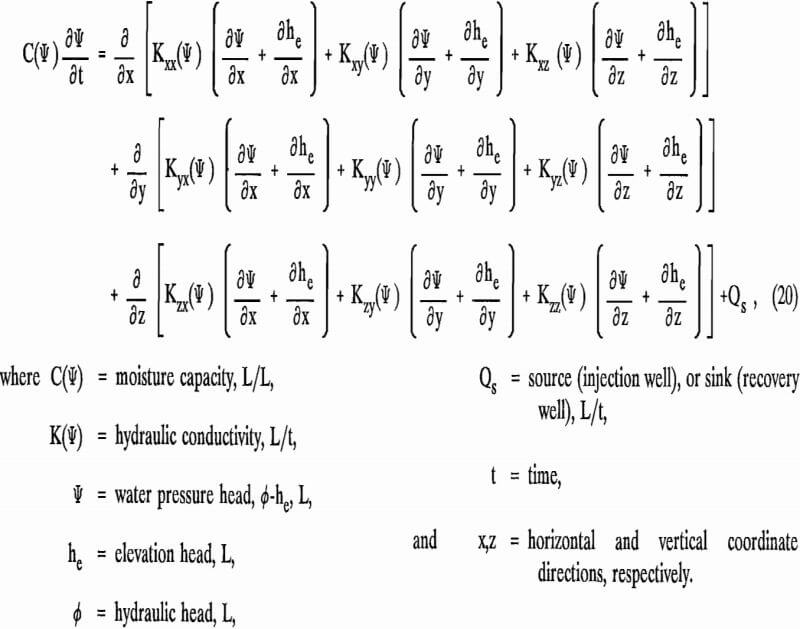
Under isotropic conditions, this expression simplifies to the familiar Richards equation. The nonlinear nature of the equation limits the availability of analytic solutions. As a consequence, the computer code TWOD was developed using the Galerkin finite-element approach. While the code has no provision for handling deformable material, both heterogeneity, anisotropy, and hysteresis can be incorporated using this flow simulator.
Finite-Element Mesh and Flow Boundary Conditions
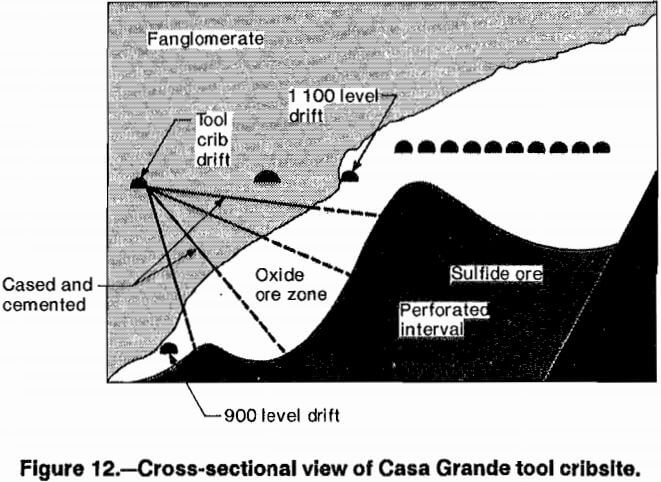
The nature of fluid flow is generally a three-dimensional phenomenon, however, a two-dimensional representation of the Casa Grande tool crib operation can be approximated by considering radial flow in the region perpendicular to a well. That is, the sin-face that exists along the contact between the fanoglomerate (cemented gravel) and copper oxide ore is considered. This surface undulates in cross section (fig. 12), but can be characterized in a two-dimensional plan view by projecting each well onto this plane. This approach appears justified, since only the interval spanning the copper oxide ore is perforated. Figure 13 gives a cross-sectional representation of the total well field for the hanging wall. Wells related to a given fan pattern are depicted by connecting each group of wells by a dashed line.
The corresponding finite-element (FE) grid for the hanging wall cross section is given in figure 14. The FE solution domain is represented by a 100- by 100-m mesh with 512 simplex triangular elements and 300 corresponding node points. The x-direction represents the horizontal distance along the tool crib drift, while the y-direction denotes the vertical distance along the hanging wall. The lower, left-hand corner represents the 0, 0 m
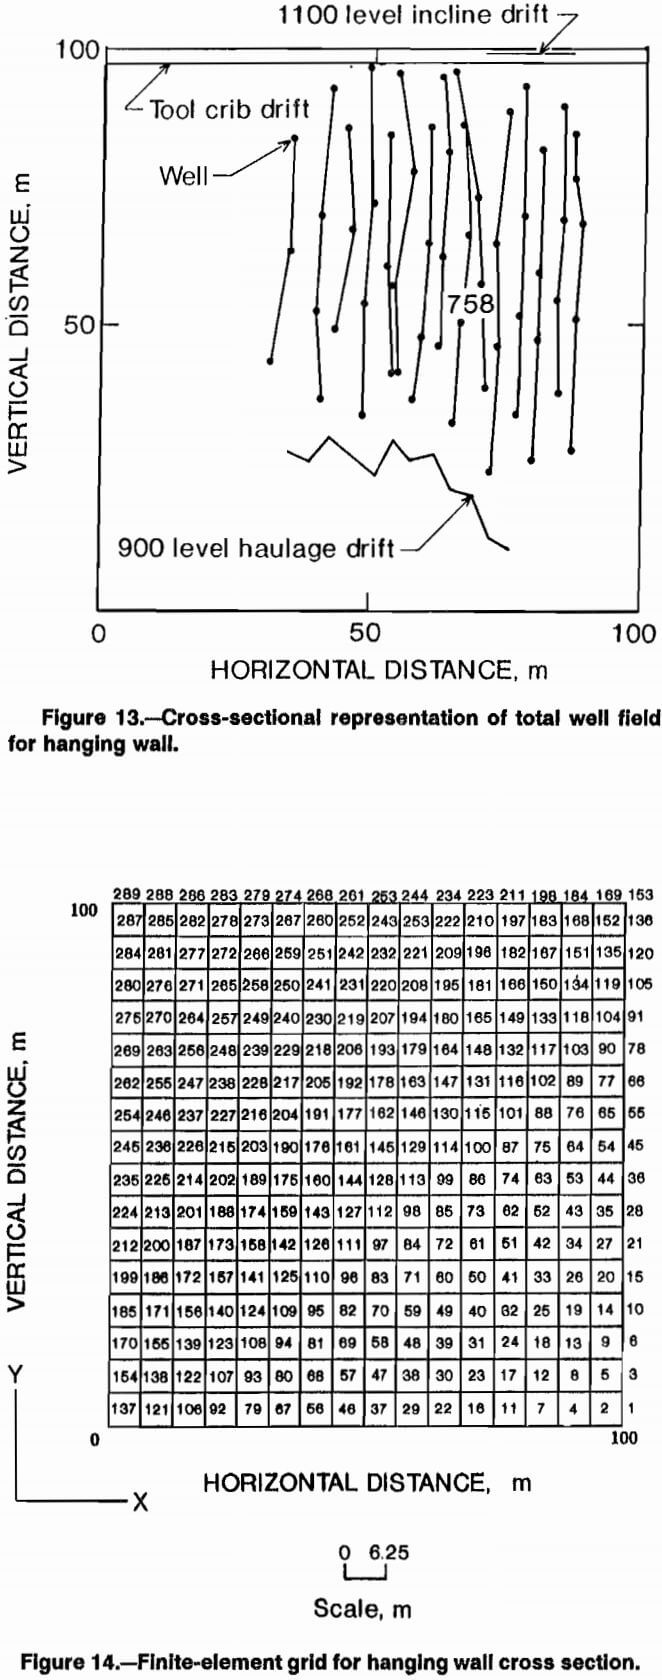
mesh coordinate, and the upper, right-hand corner represents the 100, 100 m coordinate. The distance between any horizontal or vertical pair of node points is 6.25 m. The complete solution domain was chosen to be large enough so that there would be no interaction between the surface and sides of the solution domain. If interactions exist, then the calculations of both pressure and flux would be inaccurate.
To properly describe flow during the in situ leaching process, the governing equation must be supplemented with a set of suitable boundary conditions. In general, the boundary conditions employed for the site-specific simulations included no flow at the upper and side boundaries, a unit hydraulic gradient along the lower boundary, and a point source or sink at the interior of the mesh (node point 145). The physical problem outlined involves a mixture of boundary conditions, of both Dirichlet and Neumann types. Mathematically, these boundary conditions are expressed as follows:
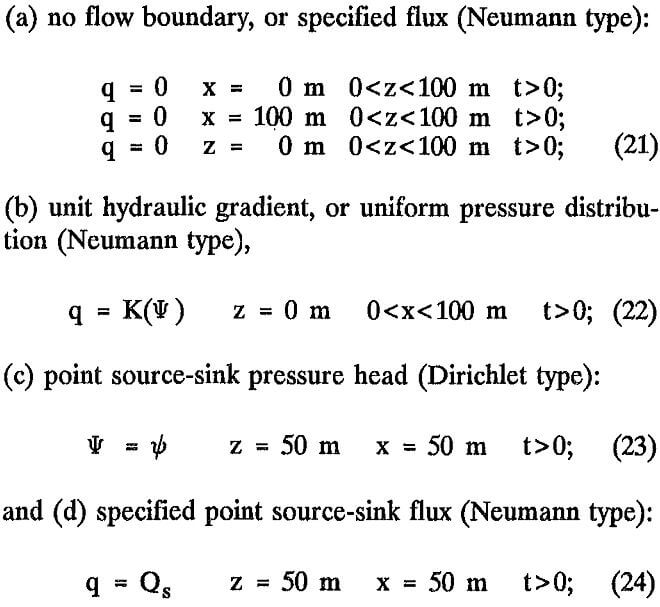
A schematic depicting these boundary conditions with respect to the finite-element mesh is shown in figure 15.
To solve the transient flow problem, an initial value of capillary pressure head must be specified in addition to those outlined above. While this condition might be manifested in a steady-state flow, or transient flow condition, these simulations used a uniform static water pressure. The initial condition given for specified pressure head is represented by
Ψ (x,z,0) = Ψ0(x,z)…………………………………………………………..(25)
Inverse Modeling
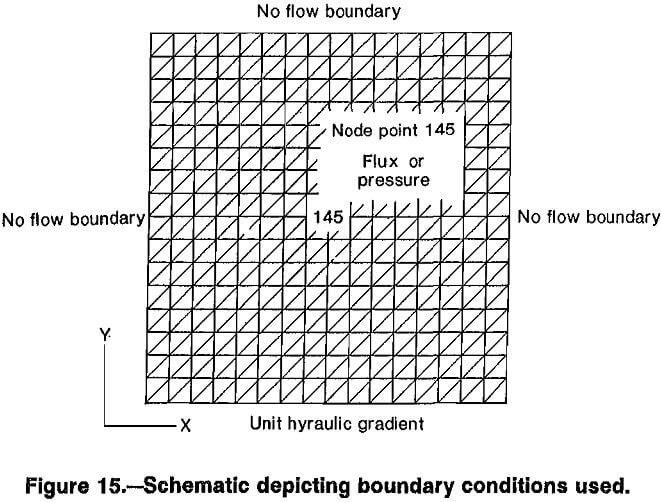
Since the Casa Grande tool cribsite is known to have macroscale fractures linking various wells, it is necessary to identify a tight well. A tight well, defined as one that had minimum observed flow rates, is used to represent fluid flow through the rock matrix. Since the Casa Grande site has had extensive permutations in pressure conditions over a 1-year period, an additional requirement is to select an interval from the onset of leaching to the first permutation in well conditions.
Figure 16 depicts the flow rate and corresponding pressure history recorded for the first 100-day period in well 758. The mean flow rate and injection pressure are calculated to be 0.315 gpm and 528 psi, respectively. These values are used during subsequent inversion of the FE model to determine the appropriate saturated permeability and ambient degree of saturation.
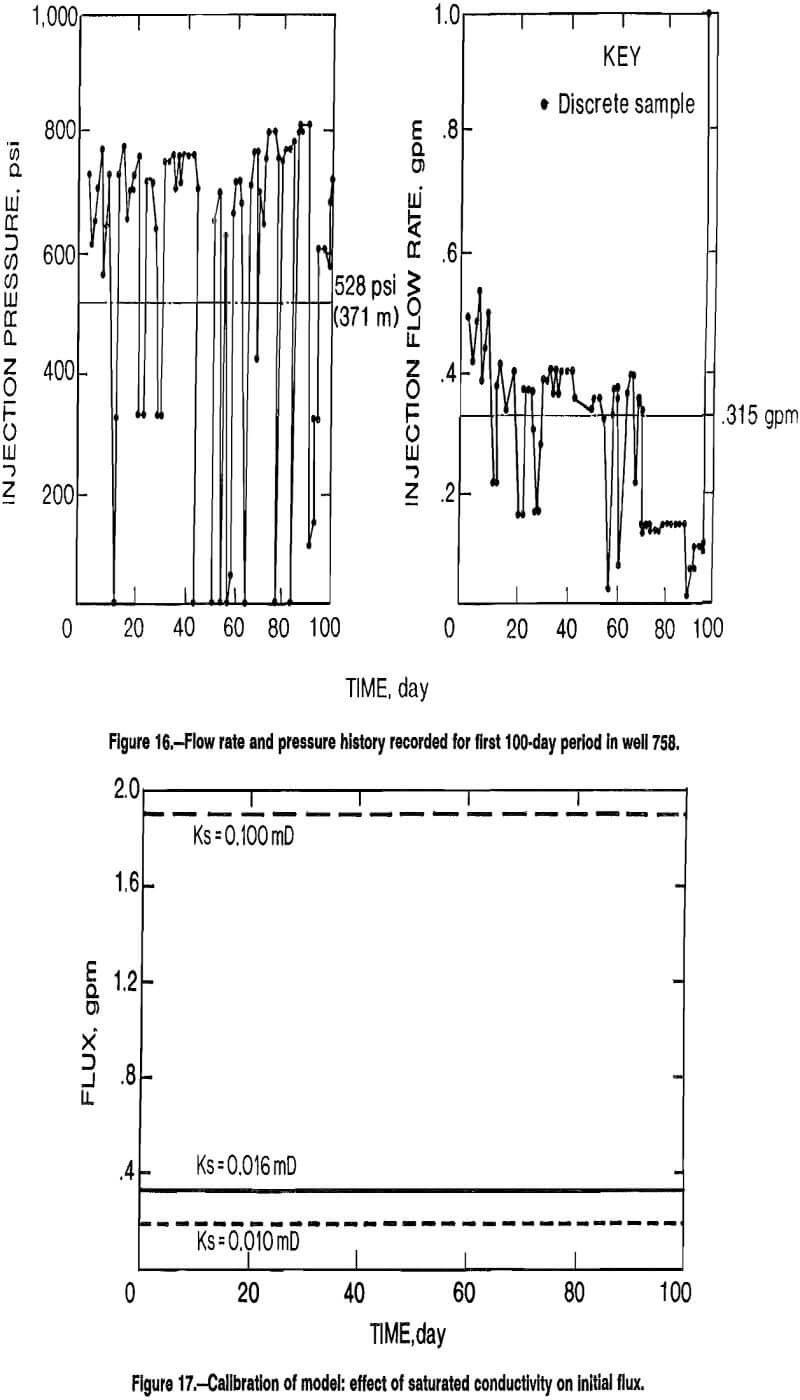
The first inversion involved calibrating the model by adjusting the saturated permeability until the computed initial flux matched that observed in the field. Figure 17 gives flow rate (flux) for a range of saturated permeability values. The maximum permeability of 0.1 mD resulted in a maximum flow rate (1.92 gpm), while the minimum value of 0.01 resulted in a minimum flow rate (0.19 gpm). The saturated permeability value of 0.016 mD matched the flow rate (0.315 gpm) observed in well 758; consequently it was used in subsequent forward model simulations. This agrees with the value 0.0177 mD from using a geostatistical analysis used to estimate permeability under the saturated conditions assumed by Schmidt.
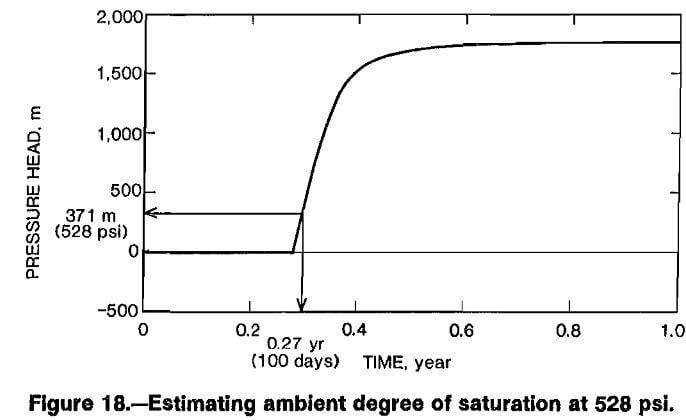
The second simulation involved estimating the ambient degree of saturation by direct inversion. The ambient degree of saturation is defined as that saturation which existed prior to in situ leaching. Estimating the ambient degree of saturation was accomplished by changing the initial pressure condition until the transient pressure response matched the results observed in well 758, i.e. where injection pressure was equal to 371 m at the 100th day. The initial pressure condition (zero time) was decreased incrementally beginning with 0 m until transient pressure conditions were matched (fig. 18). The -1 m initial pressure condition corresponds to an ambient saturation of 95 pct.
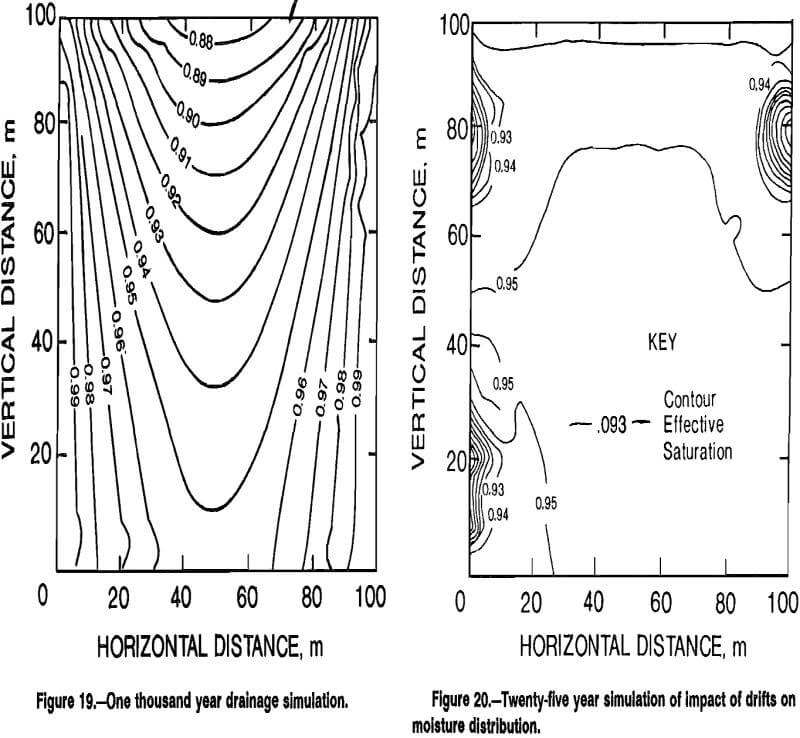
Since laboratory moisture determinations were not available, it was not possible to verify this ambient degree of saturation. An alternative approach was used, however, to qualitatively check the calculated minimum saturation, based on draining the initially saturated domain. From the 1,000 year simulation based on the Van Genuchten microfracture drainage constants, a permeability of 0.016 mD correspond to a minimum saturation of about 88 pct. The gravity effect is clearly evident from the moisture tongue in center of figure 19, demonstrating that, at least
qualitatively, the derived ambient degree of saturation appears believable.
The effect that localized drifts, i.e., the tool crib and other drifts at the 900 (274 m) and 1100 (335 m) levels have on fluid distribution in the rockmass situated between them is shown in figure 12. This analysis was necessary to assess whether the boundary conditions associated with these drifts would need to be integrated into the forward model. Figure 20 gives results for a 25-year simulation approximating the time frame since these drifts were created. Van Genuchten constants again reflect the drainage curve, with a saturated permeability of 0.016 mD and ambient degree of saturation of 95 pct. The net effect of imposing drifts essentially increases the moisture gradient in a region of about two and a half times the radius of each drift. The regional effect on ambient degree of saturation, however, is largely unaffected.
Forward Modeling
The primary purpose of transient variably-saturated flow modeling is to provide insight into the hydrologic design of in situ leaching operations in deposits where copper mineralization is disseminated in segmented blocks of ore. Forward (predictive) modeling is performed with reference to a single injection or recovery well drilled into a homogeneous block of ore, or equivalently with reference to a single linear fracture which acts as a source or sink for a single block of ore. Well 758 is seen as an
example of a well in the tool crib pattern that is drilled entirely within a single ore block. The in situ permeability estimate obtained from well 758 (0.016 mD) matches that obtained from core samples.
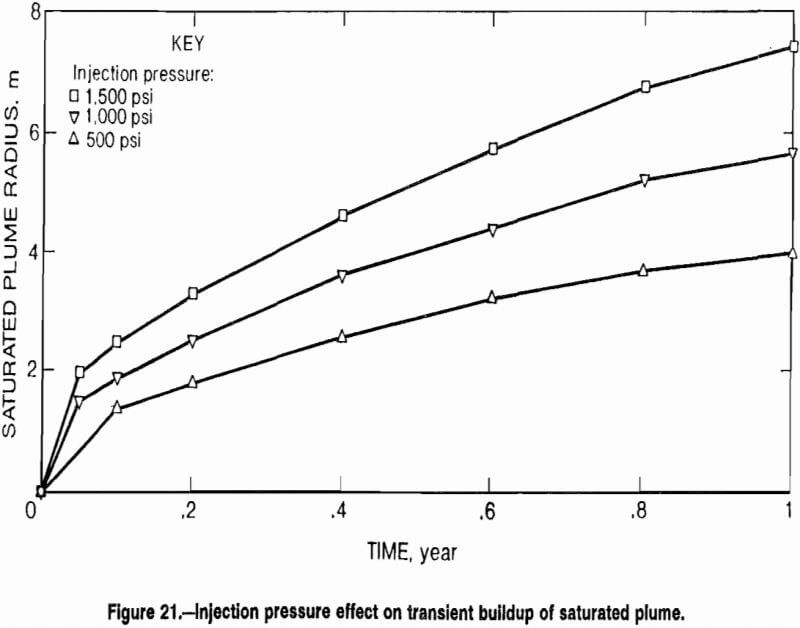
Values of ambient degree of saturation (95 pct), and saturated permeability (0.016 mD) derived during the inversion process, and those Van Genuchten constants previously described, were the parameter specifications used to simulate fluid flow in forward modeling. The effect of injection pressure on the transient buildup of a saturated plume in an ore block is shown in figure 21. For early analysis of plume development, the solution domain was reduced to 25 by 25 m, corresponding to an internodal distance of 1.56 m, while using the same mesh (fig. 14) and boundary conditions (fig. 15).
Flow simulations showed that an injection pressure of 1,500 psi (currently the practical limit at the tool cribsite) sustained for a 100-day period is required before a circular block of ore with a radius of 5 m becomes completely saturated. While lesser pressures could be employed, the waiting period for solution penetration would be correspondingly longer. Pressures at or below 500 psi would effectively contain solution within a 2-m radius around the injection source.
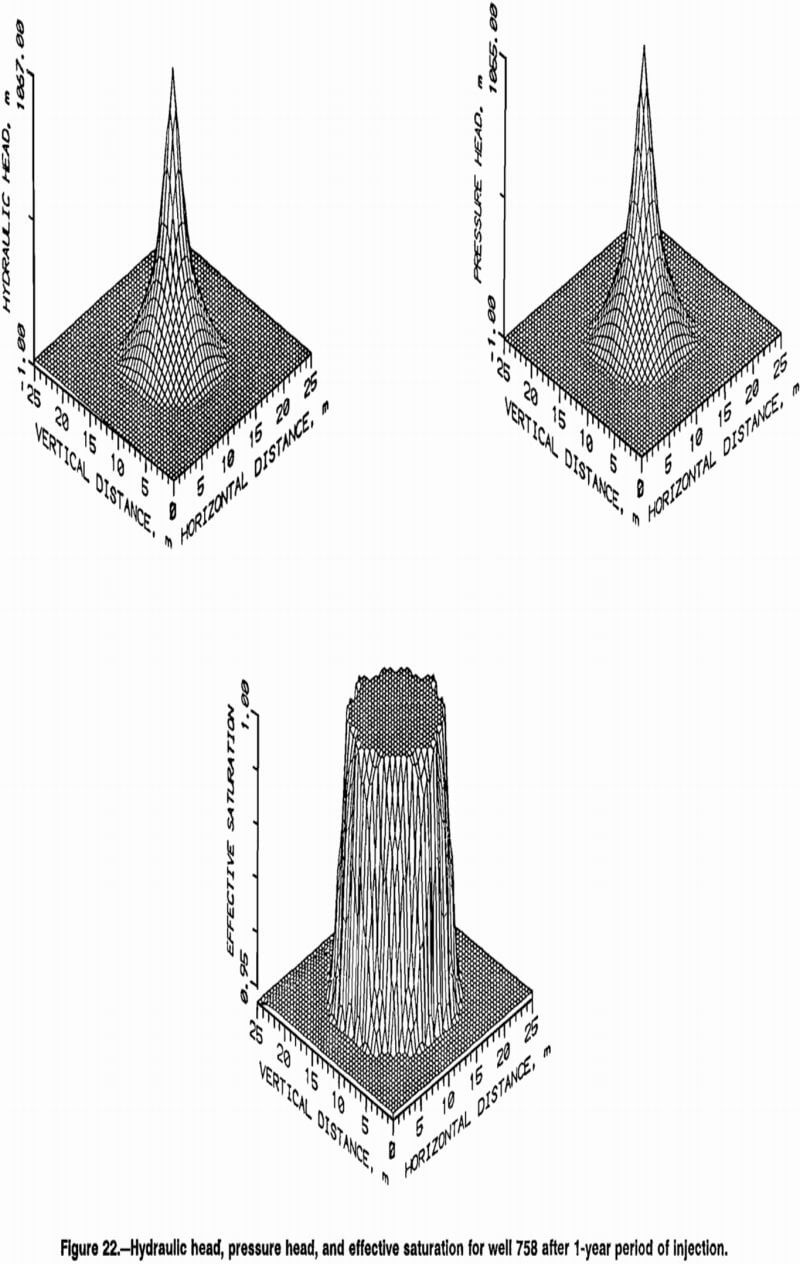
Forward modeling demonstrates that it is possible to penetrate and saturate ore blocks with leach solution, allowing contact between leach solution and disseminated copper minerals. The hydraulic head, pressure head, and fluid distributions for an injection source (such as well 758) after a 1-year period, while subjected to an injection pressure of 1,500 psi, are given in figure 22. The symmetry of the pressure plume in these figures reflects the assumption of homogeneous and isotropic conditions within an ore block. The steepness of the cone is attributed to the large moisture gradient existing about the source.
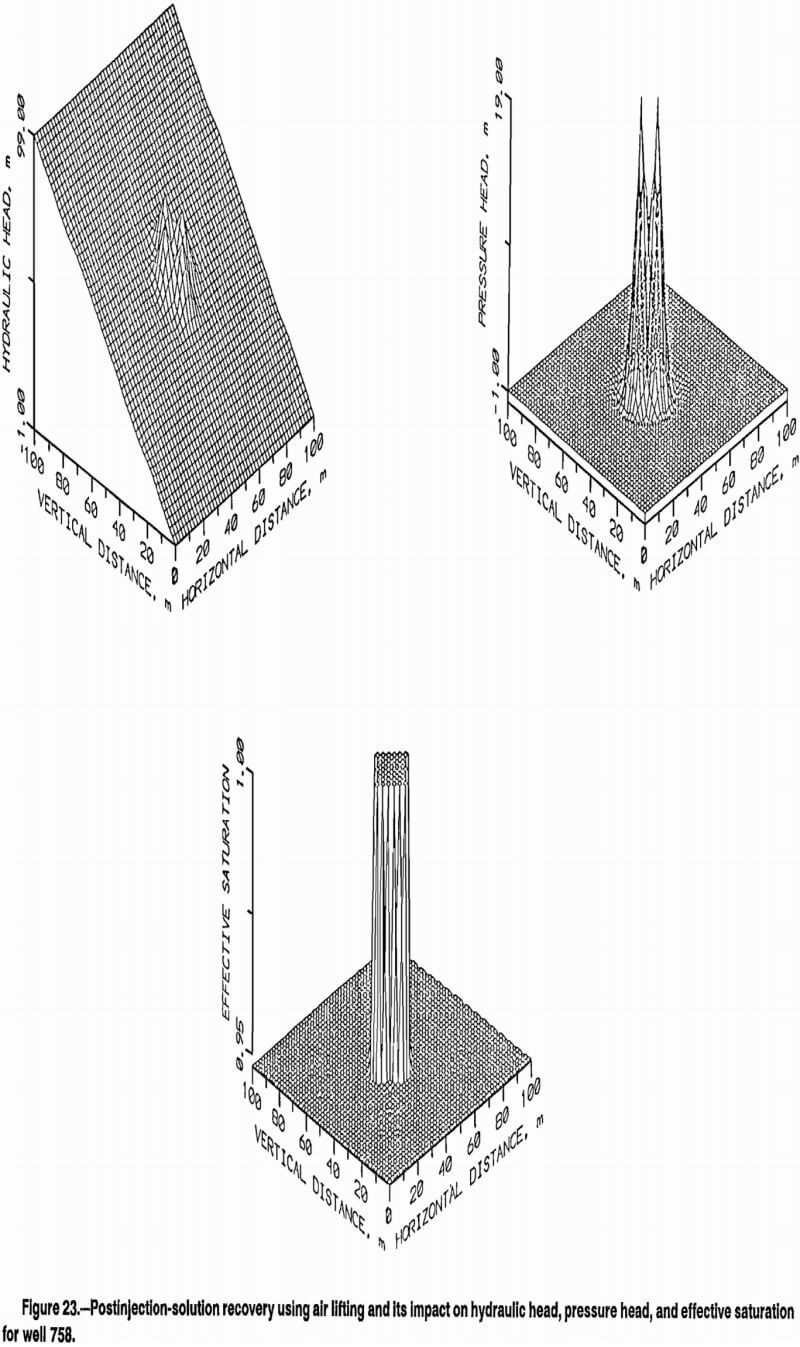
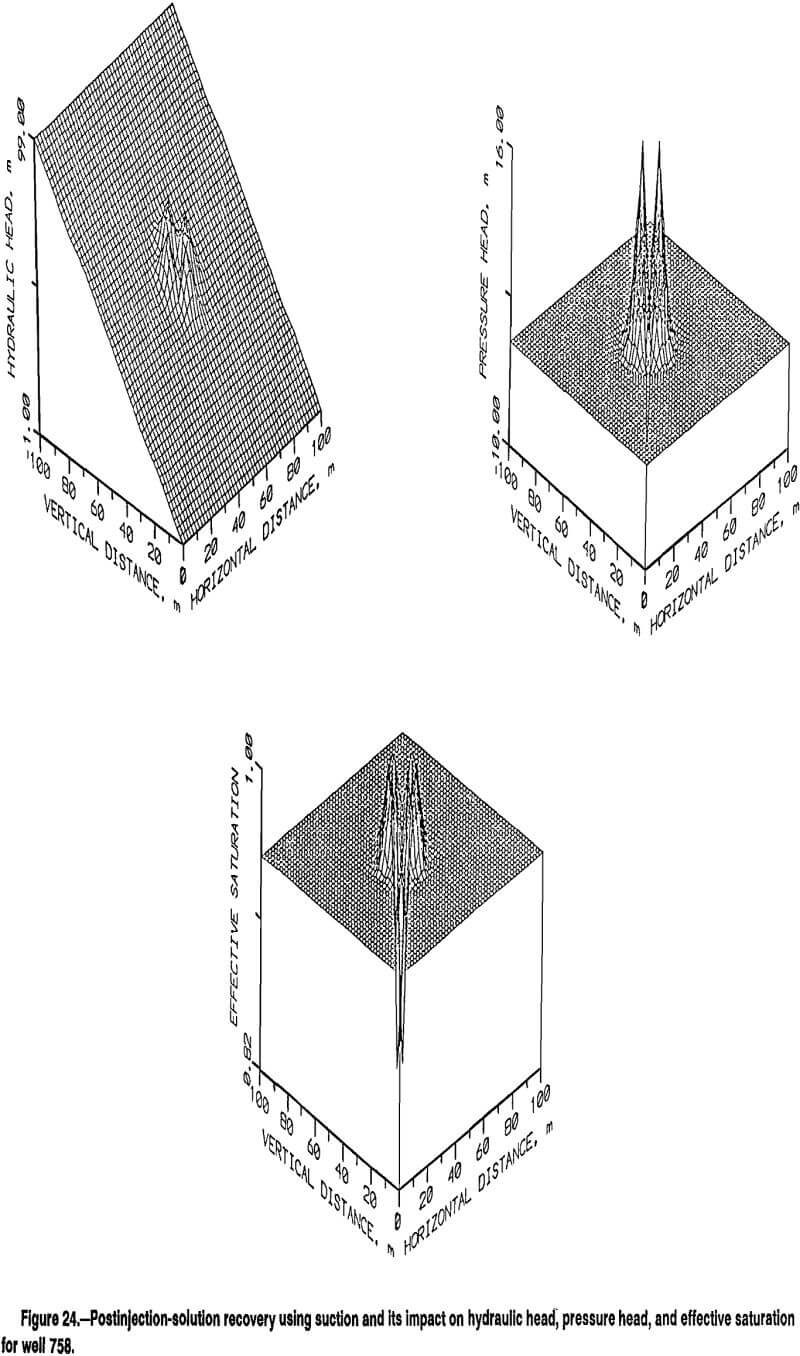
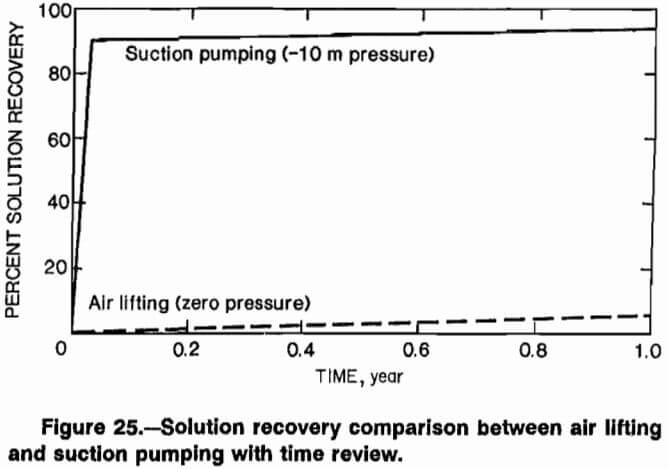
Converting the injection source after a 1-year period to a recovery sink, with a zero gage pressure or a negative (suction) pressure affects the head and fluid distribution, as shown in figures 23 and 24. In each case, the pressure plume around the sink is reduced. However, since the zero gage pressure would not be less than or equal to the air entry value (about -4 m) of the medium, only 1 pct of the injected solution can be recovered by the sink. The bulk of the solution remains captive in the rock by capillary tension. Because of the capillary effect, a dramatic increase in solution recovery, i.e., about 95 pct, can be achieved by inducing a suction head of -10 m at the sink as shown in figure 25.
Hydrologic Design
Forward modeling shows that solution penetration into ore blocks can be achieved, despite the reduced permeability associated with unsaturated conditions, if well injection pressures are of sufficient magnitude. From an operational standpoint, if the target ore zone were a single homogeneous ore block, a flux rate of .05 m/d would be unacceptably low. At the closest spacing, wells in the tool crib pattern are 5 m apart.
The observed breakthrough times for flow of solution between injection and recovery wells at the tool cribsite
ranges from 1 to 100 h, after the start of injection, indicating that the network of macro fractures which transect the target ore zone is, initially at least, the dominant flow path through the ore zone.
A hydrologic design suggested by the results of forward modeling is a variant of the push-pull test method. Injection in a core region of the tool crib wells at pressures of 1,500 psi is maintained for a 30- to 60-day period. The injection interval serves to saturate the ore blocks and build pressure in the saturated macrofracture network. Following the 30- to 60-day interval wells are selectively converted from injection to recovery mode. Suction pressure is applied, if practical. Otherwise, the lowest possible head condition should be imposed. To ensure that there is ample residence time to impregnate the injected leach solution with copper, and that the sorption of copper, and/or precipitation of gangue minerals does not occur, flow rates during recovery can be regulated by shutting in the well to some degree. The advantage of applying backpressure in the well is to prevent the established pressure plume from dissipating too rapidly. The concentration of copper and gangue minerals in solution would need to be continuously monitored to adjust the recovery flow rate.
A hydrologic design involving rubblizing of a mineralized zone could be expected to improve fracture permeability in the ore zone by orders of magnitude. Rubblizing conducted in a manner similar to that used for in situ oil shale retorting is just one possibility. A factor of central importance for determining the desired degree of rubblizing (or the average block size) is the penetration rate of leach solution into unsaturated ore blocks.
Forward modeling suggests that maintenance of injection pressures of 500 psi, or below, would effectively confine solutions to a rubblized zone in which the average block diameter is 4 m or less. Flow in blocks larger than this, on the periphery of the rubblized zone, would be unlikely without large-scale fractures, under the permeability constraints imposed by a partially saturated setting. The undisturbed (and unsaturated) rock would therefore serve to confine the solution plume within the rubblized zone, providing a safeguard against environmental contamination.
Conclusions
The Casa Grande copper oxide deposit is characterized as a variably-saturated trimodal porosity system. A network of macrofractures segment the copper ore into blocks which have a bimodal distribution of microfractures and micropores. Once the macrofractures are saturated they act as a source-sink to these ore blocks.
Moisture retention characteristics indicate that a microfracture-micropore permeability continuum exists in the rock blocks. The microfracture permeability diminishes nonlinearly with decreasing saturation, spanning six orders of magnitude; hence, fluid flow in the saturated micropores is essentially immobile. Since the microfractures provide internal access to copper-hosted minerals, the unsaturated condition (ambient saturation of 95 pct) will be the dominant control on flow capacity.
Forward modeling demonstrated that solution penetration into ore blocks can be achieved, despite the reduced permeability associated with unsaturated conditions, if well injection pressures are of sufficient magnitude and time permits. Post injection-recovery simulations demonstrated, however, that the bulk of solution injected at 1,500 psi for 1 year (roughly 98 pct) is held captive in the rock by capillary tension, when using the conventional air-lifting technique. Conversely, inducing a suction head of -10 m (air entry value – 4 m) for a 2-week period immediately following the injection period increases the capacity to recover leach solution (roughly 95 pct).
By specifying proper time and pressure constraints, forward modeling can be used to optimize a mine design by determining the maximum block diameter to be derived through rubbilizing. Upon rubbilizing a zone to an average block diameter of 4 m, and sustaining an injection pressure of 500 psi for a 100-day period, leach solution could be distributed effectively at the Casa Grande copper oxide tool cribsite, while inhibiting flow outward into the surrounding rock mass.