
Table of Contents
Liberation data were obtained from polished mounts made from the various size fractions produced during the batch grinding experiments. Representative portions of each size fraction were first treated with ethanol and then mounted in a cold setting resin (EPOFIX Epoxy). To minimize segregation of particles on the basis of mass or density, the particles were thoroughly mixed with a small amount of resin and set aside to harden for about 30 minutes. The remainder of the mold was then filled with resin and allowed to harden for approximately 24 hours. Since previous work had shown that this procedure allowed the heavier sphalerite portion of a composite particle to orientate toward the bottom of the mold, vertical cuts were made from each sample. These slices were then remounted and allowed to harden for 24 hours.
This procedure provided a truely random distribution of particles for Image analysis. After hardening, samples were polished using a 600-grit metal-bonded diamond lap, and then on a canvas using 600-mesh silicon carbide. The final polishing was accomplished over a period of 24-72 hours using 0.05- micron alumina in a Syntron polishing machine.
Liberation from a Multi-sized Feed
Previous work showed methods of determining model parameters and results of the simulation of batch grinding of monosized feeds. Some important conclusions were as follows:
- Selection functions for all components are affected by the grinding environment and must be determined from the total ore.
- Breakage functions are the same whether determined separately or with the total ore.
- Breakage functions for all components can be normalized with respect to feed size.
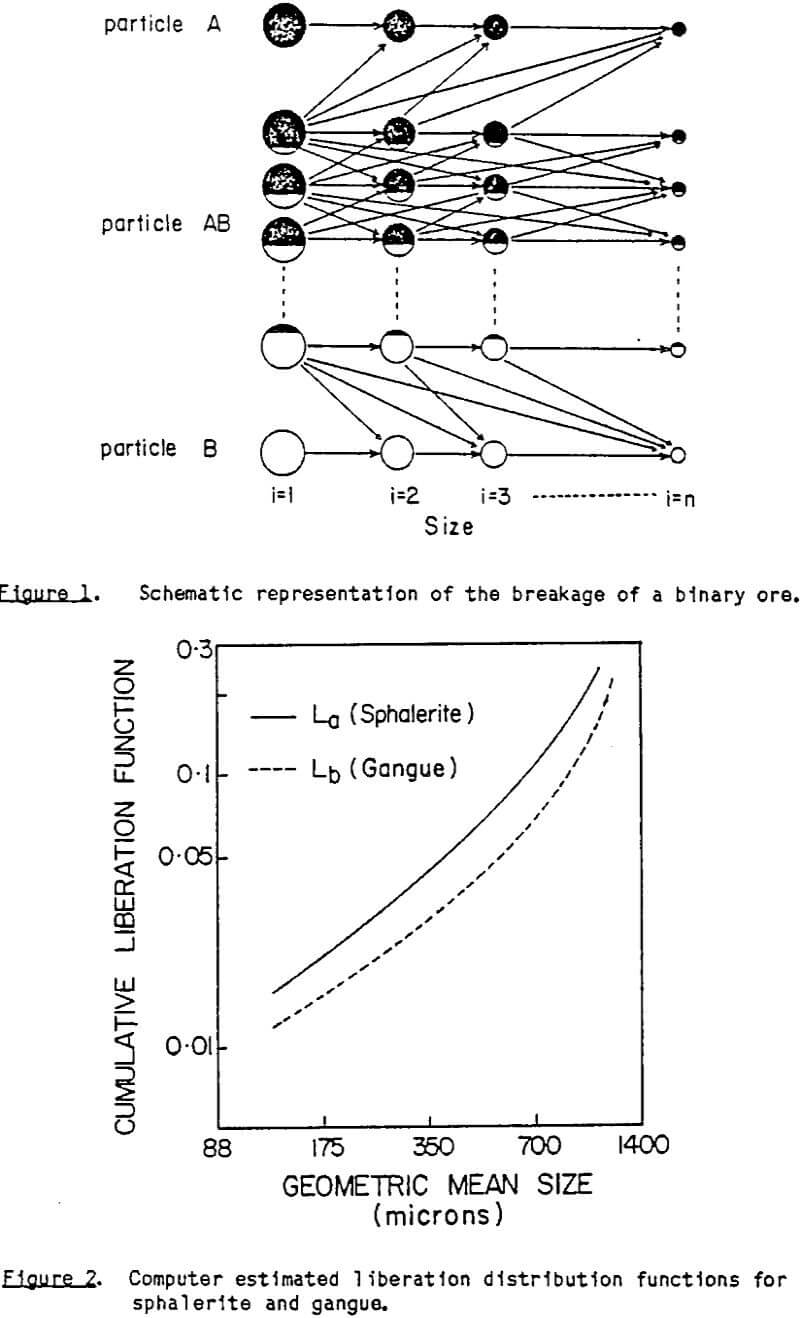
The cumulative liberation functions estimated from the previous work are shown in Figure 2. It is quite clear from this figure that sphalerite has a greater tendency to liberate than does gangue. This may be due to the more friable nature of sphalerite, allowing it to be more easily broken away from the gangue in a composite particle. The manner in which the liberated particles distribute, however, appears to be similar for both materials since the curves parallel each other.
In the previous work, the model was found to have an excellent fit with the experimental data for the batch grinding and liberation of a mono-sized feed material. However, since the model parameters were determined from the monosized grinding experiments, this was not a rigorous test of the validity of the model. Therefore, the same model parameters determined previously were used to simulate the batch grinding and liberation of an arbitrary multlsized feed.
A three-dimensional representation of this feed distribution, showing the weight percent of material of a given size and having a given sphalerite composition, is shown in Figure 3. As mentioned previously, a material having a coarse liberation size was chosen for ease of analysis. Therefore, the amount of composite material in the feed was small compared to the free gangue and free sphalerite present. Figure 4 shows the product distribution after 4 minutes of grinding. The percentages of liberated particles are shown to have increased as compared to Figure 3.
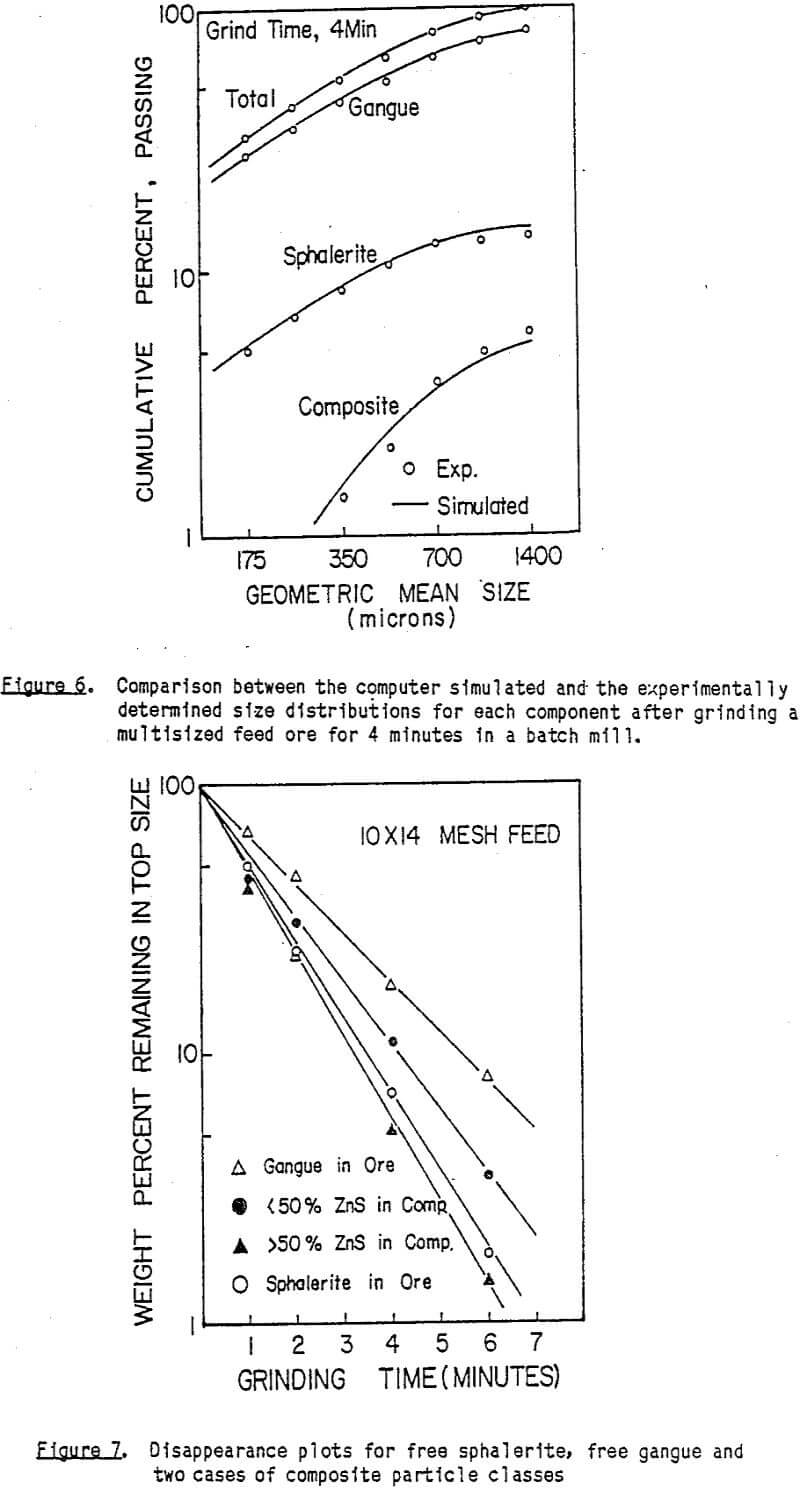
The mineralogical assays reported in Figures 3 and 4 were directly taken from the area fractions determined by image analysis. A comparison of the areal assay to the chemical assay of zinc for each size fraction is shown in Figure 5. There is excellent agreement between the areal assays and the chemical assays for this particular sample. A major reason for this close agreement is probably that the majority of the material in each size fraction was already in a liberated form. This minimized the amount of error which could arise from the overestimation of free particles. A second important factor is that the sample preparation technique minimized the bias due to the different settling rates of particles in the Epoxy resin during the mounting procedure. The simulation results for the multisized feed are shown in Figure 6 along with the experimental data. Excellent agreement between the experimental and computer simulated size distributions can be seen for all types of materials including free gangue, free sphalerite, composite particles, and the total product. This simulation is a much more rigorous test of the validity of the model, since the model parameters used in this simulation were determined independently from the present work.
Liberation with Multiple Composite Classes
As an initial attempt to use the model for more than one class of composite particles, the case of two composite classes was chosen. The composite classes were divided into i) particles containing less than 50% sphalerite, and ii) those particles containing greater than 50% sphalerite. First-order disappearance plots for these two classes, along with the free gangue and free sphalerite, are shown in Figure 7. All parameters were determined “in-s1tu”. i.e. the fate of each class of particles was followed during breakage of the ore itself rather than through the breakage of isolated classes of particles. The grinding rate for free gangue material is clearly the slowest. This is followed by the material containing loss than 50% sphalerite. It is interesting to note that particles containing a small amount of gangue actually grind faster than those containing pure sphalerite. These results may suggest a preferential breakage along grain boundaries.
Model of Liberation from a Binary System
One of the most difficult conceptual and mathematical problems occurring in mineral preparation is that of constructing a model for- liberation. In simple form, the problem is this. Consider a given ore containing valuable occluded mineral. If the ore is reduced in size in a certain manner, how is the valuable component distributed in the various sizes of particles according to varying weight fractions of valuable to gangue components? The term “liberation” is loosely used to indicate that finer grinding will produce some particles which are so enriched in the valuable component that they can be separated from other particles containing less of the component, thus leading to a concentrate. Clearly, the degree of liberation depends on the process of separation, since each process will concentrate different sizes and amounts of valuable material in different manners. The advantage and function of a model for liberation is the prediction, from limited experimental data on the ore, of the expected behavior of the separation process for different degrees of-size reduction.
It is presented a preliminary model based on the simple binary system of component B occluded in a matrix of component A, for the case where fracture planes can pass with equal ease through A or B. By assuming that the volume fraction of B in AB in the overall matrix is small, which is realistic for many practical systems, the problem is reduced to a one-dimensional treatment which is conceptually easy to understand. The model uses elements from the previous models combined to give a simple but realistic system for analysis. Preliminary experimental confirmation using a synthetic “mineral-host matrix” of known amount and size of B in AB is presented.
Proposed Model
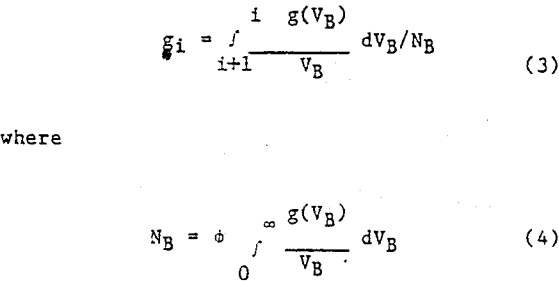
The model postulates a hypothetical primogeniture material of large sizes compared to the sizes which will be used in the separation process. The size distribution of grains of B present in this source AB material is represented by the function g(VB), where g(VB)dVB is the fraction of volume of B which lies in the grain volume size range of VB to VB+dVB. Let ∅ be the overall volume fraction of B in AB, then the volume of B in the grain size range of VB to VB+dVB in unit volume of AB is ∅g(VB)dVB. It is assumed that grains of B are randomly dispersed in the space AB. It is assumed that the primogeniture material is reduced in size to an experimentally determined size distribution of fragments by a process which acts like one overall step, without preferential grinding of one component with respect to another. Let this volume size distribution of fragments be denoted by p(VAB), where p(VAB)dVAB is defined as the volume fraction of particles which fall in the size range VAB to VAB+dVAB. It is assumed that the fracture pattern creating these fragments is randomly imposed on the primogeniture material, with no preferential breakage at grain boundaries.
Mathematical Treatment Monte Carlo Simulation
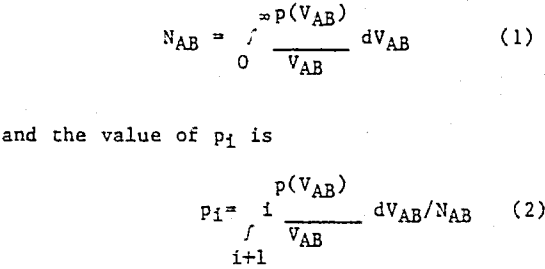
This simplified system was first treated by a computer Monte Carlo simulation, using finite size intervals to cover the range of product sizes of interest. Briefly, this approach consists of splitting the size range into n intervals (numbered 1 for the top size), and defining the numbers p1, p2, pn as the fractions by number of particles of each size range in unit total volume of the product size distribution: the total number of particles is
Similarly the fraction by number of B grains in size i is denoted by gi,
In addition, special information can be collected and listed on the origin of the total B in a given AB fragment size interval. For example, an AB fragment having 50% of B can be created from a large number of different combinations of B grain inclusions and fractures. The total B component could come from one B grain wholly contained in AB, or a part of one B grain created by the AB fragment edge, or several B grains wholly contained, or several B grains wholly contained plus one or two portions of B grains that were intersected.
It is assumed that the probability of two or more large occlusions of B being interacted by an AB fragment is small. This restriction will be removed in a later paper by the Authors, but a comparison of results from the Monte Carlo method and the more restricted analytical treatment given here has shown the validity of the treatment under some conditions.
Mineral Liberation Analysis Computer Simulation
In Mineral Processing, the objective of most processes is the separation of mixtures of minerals, which are originally associated in composite particles. Feed preparation processes grinding for instance, which take place before beneficiation or separation processes do not usually break particles at the boundary between mineral phases. They produce composite (“middlings”) as well as liberated particle. It is therefore necessary, in a particulate system, to determine the proportion of particles which are liberated as well as, ideally, the size distribution of minerals which remain associated in composite particles.
Theorical Study and Computer Simulation
The model which has been taken for analysis here is the following :
– particles are cut by a random plane (which can be obtained practically by preparation of a polished section after mounting the particles in a medium, in a randomized manner in position and orientation),
– the sections are scanned by test lines or by areal analysis.
In the particular case of composite grains, the mean volume of a given component will be obtained for instance through the component size distribution in the different composite grains, or the proportion of liberated grains.
For this purpose the following derivation was carried out let Vp be particle volume and v the total volume of Np particles, V the total volume (including medium).
In order to obtain a section to be scanned by test lines, particles are supposed to be contained in a volume which is cut by a random plane. From the DELESSE and DELESSE-ROSIWAL theorems we have Vv = Ll or in this case v/V = μ’1p/Lt where Lt is the total intercept length and μ’1P the first order moment of the particle intercepts ; therefore
If particles consist of Nb blue particles, Nw white particles and Nm mixed blue-white particles, we have Np = Nb + Nw + Nm. The mean volume (or first order moment) of the blue component (and by an index change of the white component) is
(μ’1B is the first order moment of the blue component intercepts).
Computer simulation
Two types of measurements have been simulated : lineal and areal analysis. In the two cases, the particles were symbolized by means of spheres having a uniform radius and cut by a plane to define two phases : a blue and a white one. It must be pointed out that shape does not appear as a parameter in the reconstruction procedure outlined above.
In the areal analysis the simulation is simple : starting from a sphere and having its own tri-axial co-ordinates system and taking the origin point at the center of the sphere, a random cut by a plane is obtained by rotating the sphere at random and taking a plane direction as x0y plane.
In this case, blue and white areal distributions are determined. But it has not been attempted to reconstruct from these measurements since there is no general shape independent theory for phase assessment. Surface area per unit volume, volume per unit volume and the mean components intersection area were also calculated.
It is worth remembering that, the smaller the volumetric proportion of a given component, the larger the error on the moments of its intercepts is. This is due to the low probability for this component to be crossed through by a test line.
Determination of the proportion of liberated grains and the component size distribution
Function volume is derivated from the previous relationships. Liberation curves obtained from the upper limits of liberated grains, true curves of each component distribution, and liberation curves obtained from the true values of liberated grains, are drawn on these graphes. Liberation curves obtained from the true values of liberated grains and from fited β-incomplete distribution give satisfactory representation of the curves. Liberation curves obtained from the upper limits of liberated grains (NB and NW) from fited β-incomplete distribution give a less satisfactory representation of true curves. Nevertheless it is a rather good approximation.