Table of Contents
Some are developing fragmentation technology for in situ extraction systems. An in situ extraction system is attractive because it can be applied to deposits that are presently too low grade to be mined by conventional methods, thereby increasing domestic reserves. In situ extraction also reduces exposure of workers to health and safety hazards, minimizes detrimental environmental effects, and lowers energy consumption during mining and beneficiation. The objective is to develop fragmentation processes to effectively fragment rock in place and economically prepare low-grade deposits for in situ extraction. This experiment evaluates the fragmentation created in a 10-hole test blast having blasthole spacings of 25, 20, and 15 feet. While initial research is directed primarily at porphyry copper deposits, much of the information developed will be applicable to in situ extraction of other mineral deposits.
In situ leaching has been practiced at the Miami mine, Miami, Ariz, to take advantage of fragmented zones of rock created by block caving operations. The Old Reliable mine near Mammoth, Ariz, was the site of a 4,000,000-pound AN-FO coyote blast to prepare the ore body for in situ leaching. The blast, a joint effort of Ranchers Exploration and Development Co. and DuPont, was detonated in March 1972. Rangers also detonated a borehole blast with 400,000 pounds of explosive to break and move ore into the pit for in situ leaching at the Big Mike mine near Winnemucca, Nev., in July 1973. McAlester Fuel Co. detonated a 4,150-000-pound AN-FO blast in vertical boreholes at its Zonia mine near Kirkland Junction, Ariz., in April 1973; an 890,000-pound AN-FO blast in March 1974; and a 1,544,000-pound AN-FO and water gel blast in May 1974. Initial results at the Old Reliable, the Big Mike, and the Zonia mines have been encouraging. The concept of using nuclear explosives for in situ leaching has received much attention, although public opposition to the commercial use of nuclear explosives and difficulties in leaching deep-lying primary sulfide ores have delayed its application. However, Kennecott and the AEC continue efforts to solve the environmental and technical problems associated with this method.
Although industry activities in in situ extraction are increasing, many problems remain to be solved. Improved techniques for determining in situ rock properties and in-place characteristics of ore bodies are needed to properly evaluate potential deposits for in situ extraction. Also needed are blasting methods that produce ideal fragmentation to permit maximum recoveries, more sophisticated solution injection and recovery systems, and improved environmental controls.
This report is concerned with the Bureau of Mines efforts to optimize rock fragmentation for in situ leaching. In order to optimize rock fragmentation the following must be evaluated: (1) The zone of blast damage for different blast spacings (15, 20, and 25 feet) and (2) the degree of fracturing for each blast spacing’. Multiple techniques were used to make these evaluations. These techniques overlapped in that they evaluated the same or similar parameters of the blast (that is, size distribution and zone of blast damage). This overlap was designed in the test program to evaluate the best techniques for future tests. Results from acoustic core logging methods developed and applied in assessing blast damage are described in a separate report.
The zone of blast damage was defined for each blast spacing in order to quantitatively describe the extent of fracturing above, below, and coincident with the charge column. These data are needed for calculating volumes of crushed rock in an ore body fragmented by blasting. The degree of fracturing was determined because it is a critical parameter controlling the leaching process. In general, the larger the fragments, the slower the leaching. Size distribution, however, is not the only parameter controlling leaching. Other controlling parameters such as mineral composition, amount of available oxygen, amount of pyrite, the type of bacteria present, in situ temperature of the rock, and location of the ore body with respect to the water table must be considered when designing for the adequate fragmentation of a particular ore body. A simple example of such a consideration can be given.
Copper oxides (tenorite, cuprite) and copper carbonates (azurite, malachite) dissolve faster than copper sulfides such as bornite, chalcocite, and chalcopyrite. Copper silicates are an intermediate case between oxides and sulfides. “At temperatures of 20° to 40° C, the dissolution of chalcocite may take years and dissolution of chalcopyrite takes decades”. Fraction recovery for coarse-grained ores composed dominantly of chalcopyrite is very low; however, if the grain size of the ore is decreased, the fraction recovery will increase. It is possible, therefore, to control recovery by controlling the size distribution of the blasted ore, and it is critical to optimize the amount of fragmentation. This optimization for any site is best made if a quantitative study of fragmentation is made at all scales. This report describes such a study.
Acknowledgments
The authors wish to acknowledge the cooperation of the Duval Corporation, Tucson, Ariz., and particularly that of four of its employees–Thomas Jancic, manager-mine planning; John Curran, formerly mining research engineer; Calvert lies, geologist; and Chet Oakley, geologist.
Test Site
Geology
The test site is located at the Sierrita open pit copper mine in Pima County, Ariz., approximately 25 miles south of Tucson. The property is owned
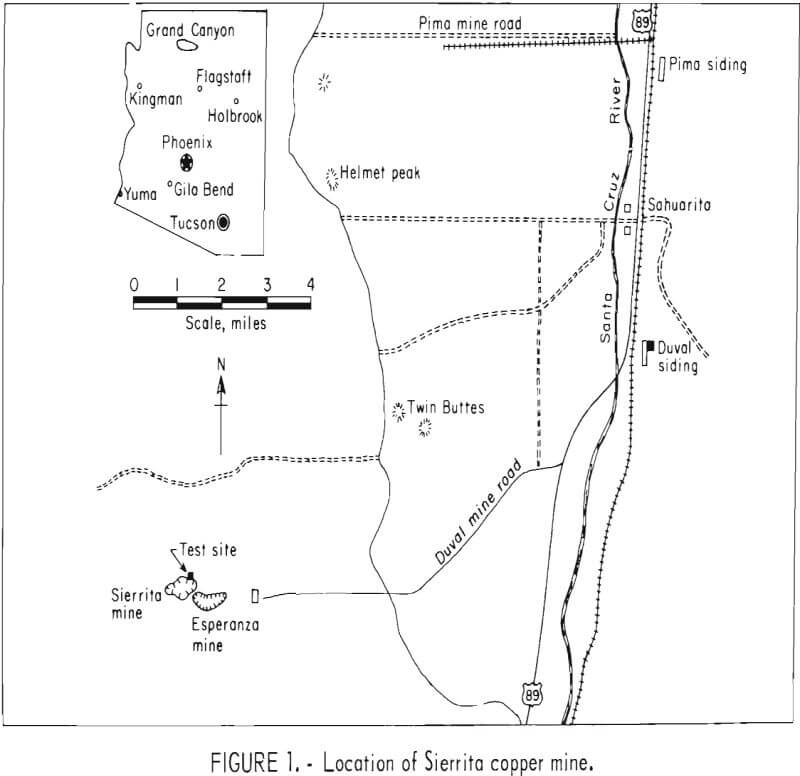
and operated by the Duval Sierrita Corporation) a subsidiary of Duval Corporation. The pit is on the southeastern flank of the Sierrita Mountains at the extreme south end of the Pima Mining District (fig. 1).
Generally, the igneous rocks in the Sierrita pit are Triassic-Tertiary age. Cretaceous-Tertiary rocks such as the quartz monzonite porphyry, Ruby Star granodiorite, the quartz diorite, and the breccia pipe were intruded and extruded in a series of individual, but related tectonic events. The Harris Ranch quartz monzonite occurring in the south half of the Sierrita pit, is Jurassic-Triassic. The Oxframe volcanics are Triassic and occur on the east side of the Sierrita pit. All of these rock types contain sulfide mineralization in varying amounts. Generally, metallization in the Sierrita pit consists of chalcopyrite, molybdenite, pyrite, and minor amounts of chalcocite. Covellite and native copper are rare. Other minerals such as the copper carbonates (malachite and azurite) are present in minor amounts around the pit perimeter.
The location of the test site is on the northeast side of the Sierrita pit, approximately 1,500 feet from the pit boundary (fig. 2). The test site
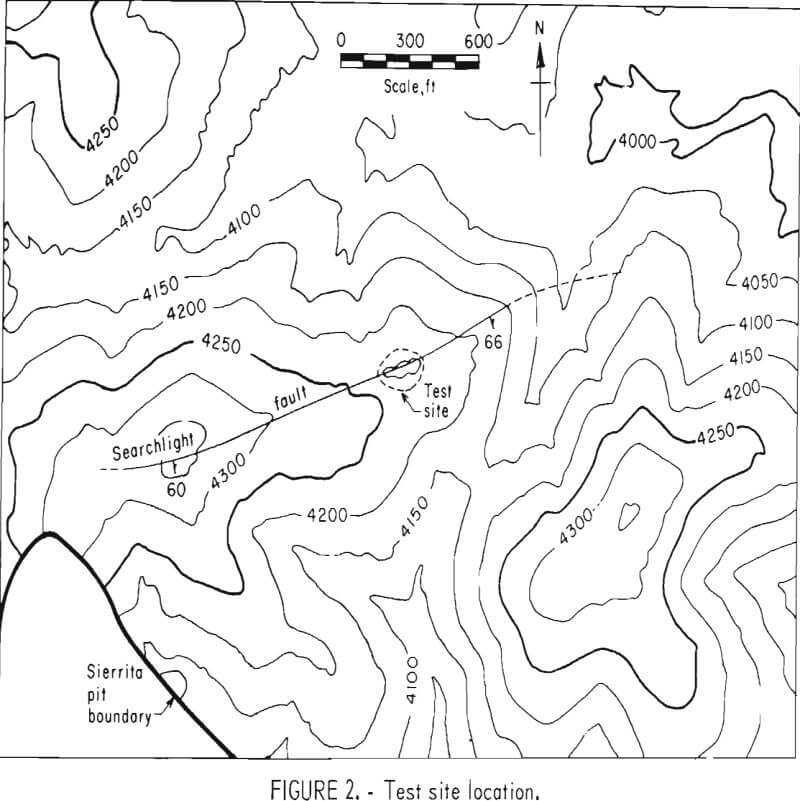
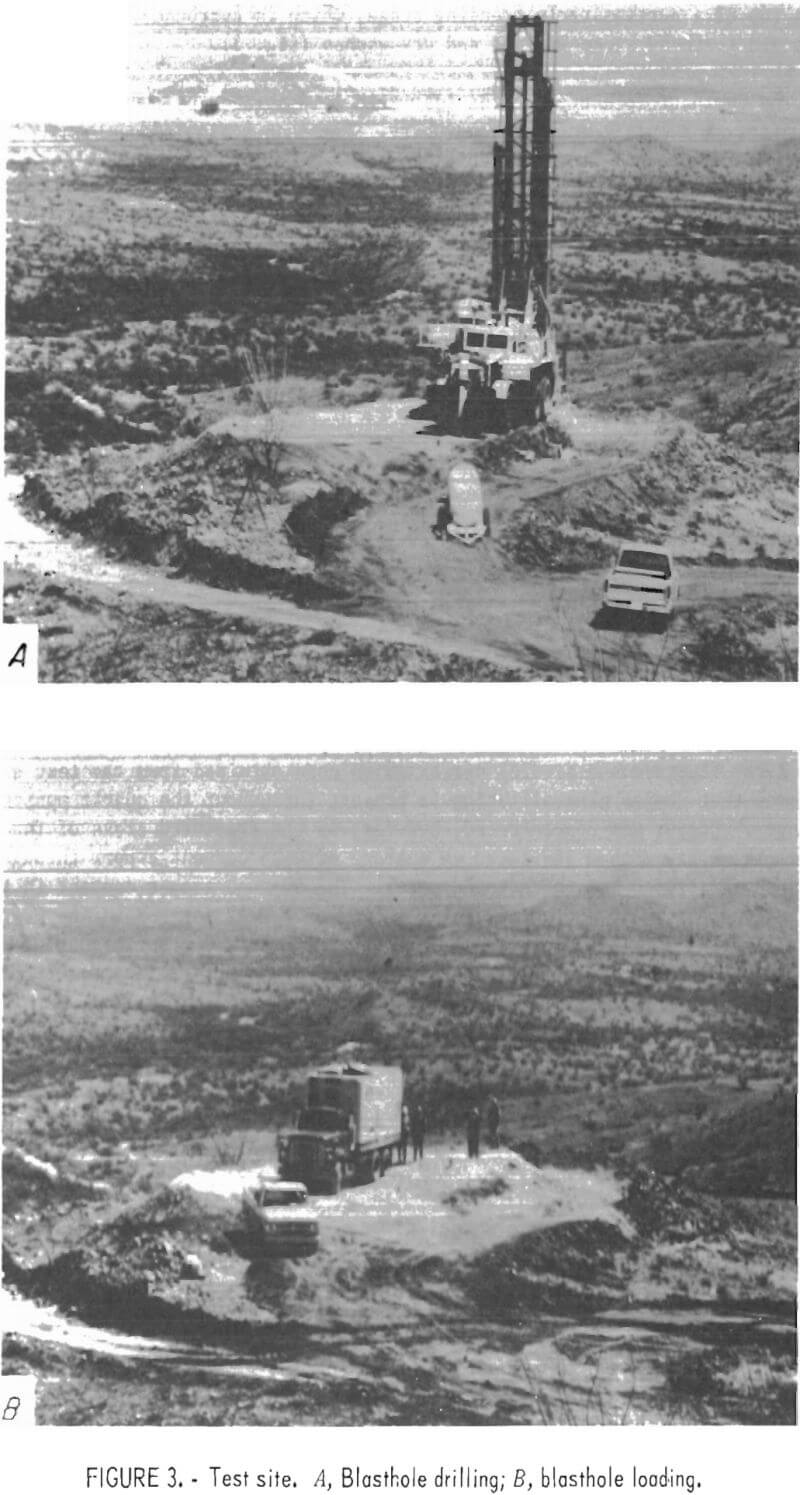
is on top of a northeasterly trending ridge, which is surrounded to the north, east, and south by steep gullies and dry washes (fig. 3).
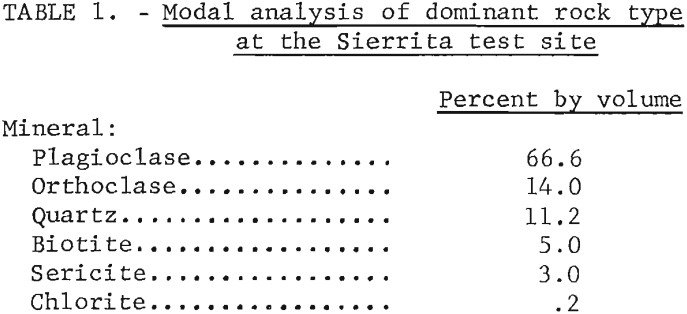
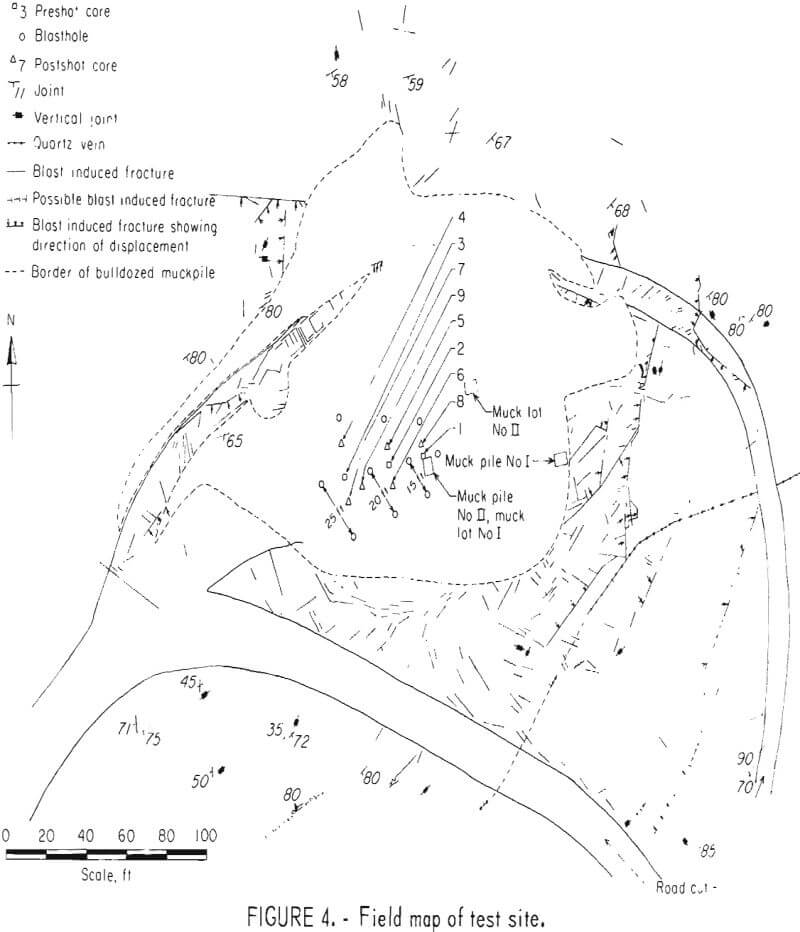
The dominant rock type at the test site is described by the mine geologists as a quartz monzonite porphyry. Based on a single modal analysis of rock core obtained from the test site, the rock was found to have the composition shown in table 1. A rock having this composition is classified as a granodiorite porphyry according to Travis. The discrepancy in composition between Travis classification and the mine geologist’s is slight and is most likely due to the limited sampling; therefore, the more common term (quartz monzonite porphyry) will be used throughout the text. The quartz monzonite porphyry pervades the entire test area; however, it is cut at several locations by quartz veins (fig. 4).
X-ray fluorescence studies performed on core obtained from the test site indicate that copper mineralization is present throughout the quartz monzonite porphyry. Copper was concentrated, however, in the fractured areas of the core. The X-ray method indicated an average of 0.23 percent copper throughout the core (fractured and unfractured core). The average copper content in the fractured areas was 0.33 percent while it was only 0.12 percent in the unfractured core. Assays of other samples taken by the Duval Corporation during blasthole drilling of the test area yielded an average of 0.138 percent copper (0.130 percent acid soluble copper).
Fractured and faulted areas of the core were also examined by X-ray methods to see if they contained material that would swell and thus inhibit the flow of a leaching fluid. There was some indication of the presence of clay minerals (montmorillonite or kaolinite). However, the sample did not swell when glycolated.
The major geologic structure at the test site is the Searchlight Fault (fig. 2), having an approximate strike and dip of N 70° E, 60° SE. Paralleling this feature is a set of quartz veins (fig. 4). In addition, multiple sets of joints are found in the area.
Laboratory Leaching Tests
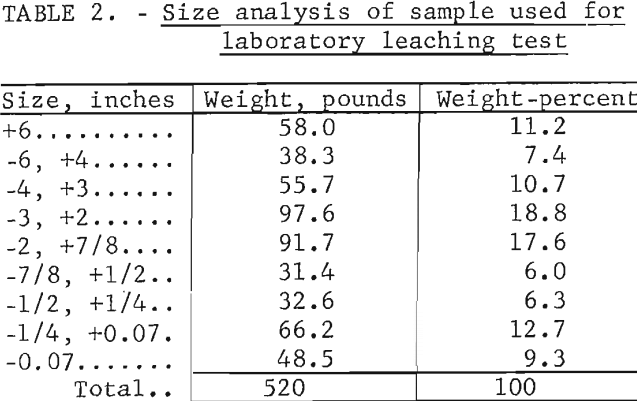
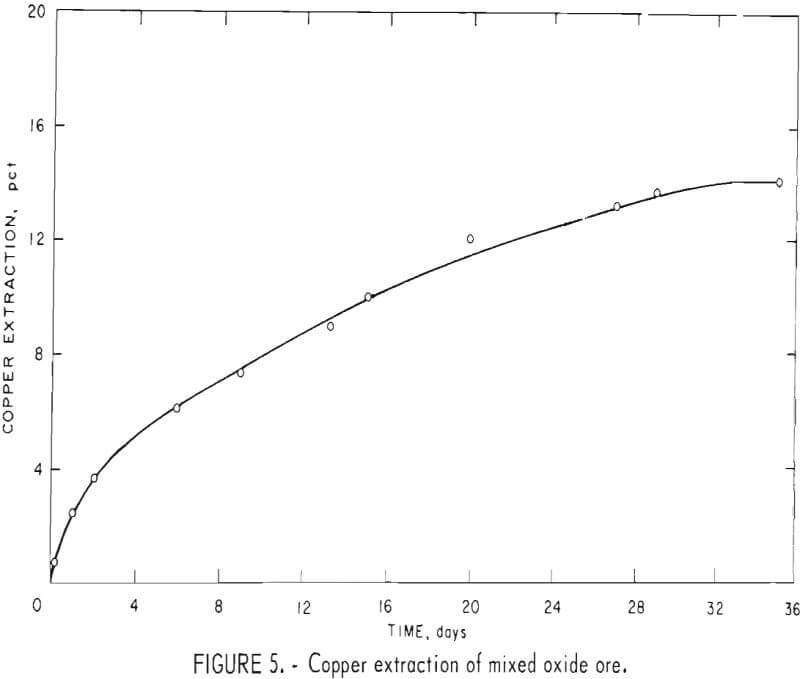
Laboratory leaching tests were conducted on a 520-pound sample of surface material collected after the blast. Table 2 shows the results of a screen analysis of this sample, which averaged 0.090 percent copper and 1.21 percent iron. The sample was loaded into a 55-gal stainless steel drum for trickle leaching. The leach solution was dilute sulfuric acid at a pH of 2.0. The volume of leach solution in the surge tanks was 40 liters and was circulated at a rate of 170 ml/min. After 71 days of leaching, the copper content in the solution reached 1 g/l and the copper was removed using cementation of copper on metallic iron. Figure 5 shows the copper extraction during the first 35 days of leaching. Leaching was continued with the barren copper solution and after 201 days the solution was at 0.66 g/l of copper and 34.5 percent of the copper had been recovered. Sulfuric acid was periodically added to maintain a pH of 2.0. Acid consumption averaged 15.3 pounds acid per pound of copper extracted.
Physical Properties of the Quartz Monzonite Porphyry
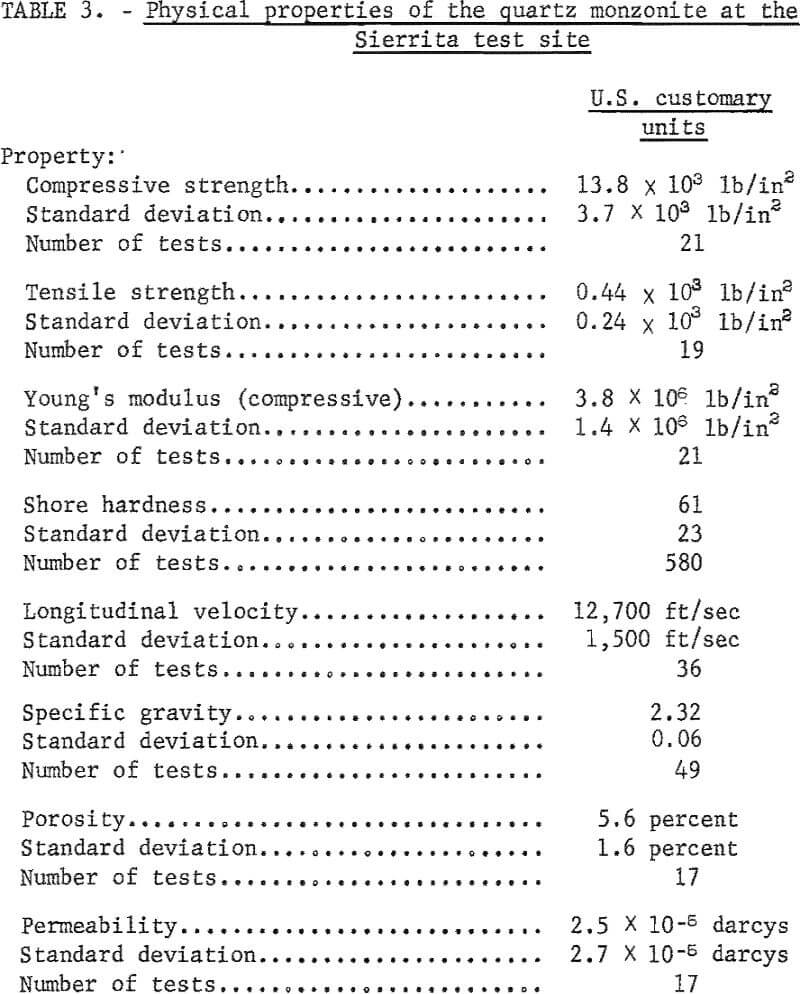
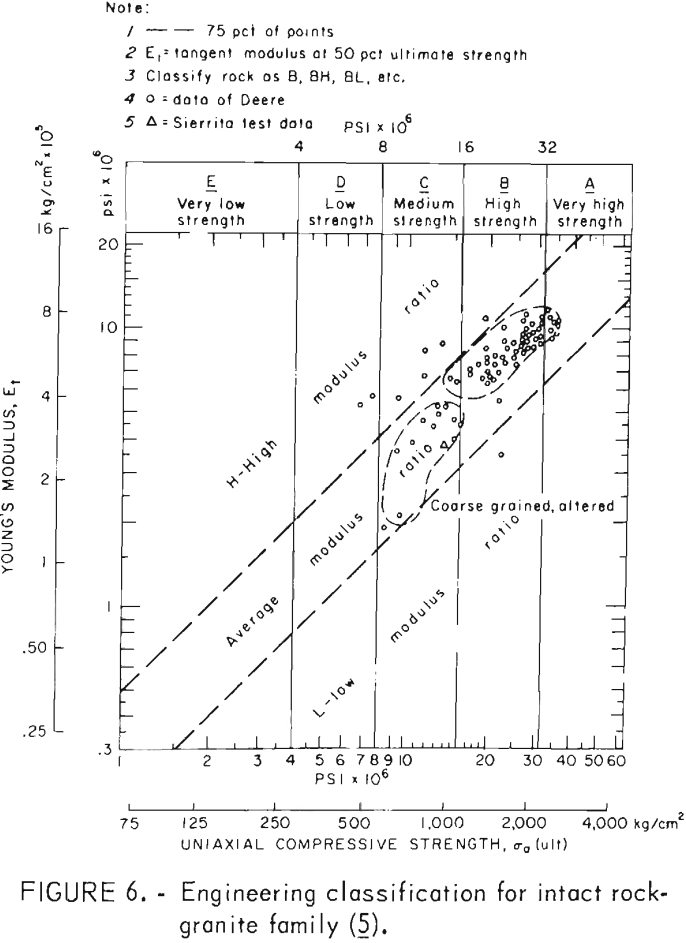
Physical-mechanical property tests were completed on the preshot core. Tests included uniaxial compressive and tensile tests, Shore hardness, porosity and permeability, ultrasonic pulse velocity, and specific gravity determinations. Young’s modulus was calculated from the uniaxial compressive test data. Test results are summarized in table 3. Porosity and permeability tests were run on intact laboratory samples and do not necessarily represent the in situ porosity and permeability of the rock formation. A plot of the compressive strength versus Young’s modulus shows that, according to Deere,
the rock has an engineering classification for intact rock in the granite family of C (medium strength) with an average modulus ratio (fig. 6). Note that the plot falls within Deere’s altered, coarse-grained category.
Preblast Field Operations
Topographic Mapping
Detailed topographic surveys were run to allow an accurate measure of elevation changes produced by the blast. Wooden stakes established 68 permanent survey points so that pre-shot and postshot elevations could be measured at the same point and elevation changes could be determined to within ±0.2 foot. The elevation change data were used to compute a swell factor for the blast.
Core Drilling Operations
The three preshot diamond drill holes were located in the middle of the 15-, 20-, and 25-foot blast-hole spacing areas as shown in figure 7. These holes were drilled with an NQ double barrel wire line system and produced drill core about 2 inches in diameter. Over 330 feet of core was obtained.
Blasting Procedures
Hole Loading and Delay Intervals
Figure 7 shows the bias thole locations and the blast delay sequence. This pattern was selected to test spacings based on equilateral triangles of 25-, 20-, and 15-feet. Ten 9-inch-diameter blastholes were all 110 feet deep with 60 feet of stemming and 50-foot powder column. The blastholes were connected with 50-gr/ft core load detonating cord and were bottom-initiated with 1-pound cast primers. Although it was felt that instantaneous initiation would improve fragmentation, ground vibration considerations dictated that the blast be delayed with 9-msec detonating cord delay connectors. The blast contained a total of 17,440 pounds of 10-percent aluminized slurry blasting agent. This site-mixed slurry had a specific gravity of 1.20 and a heat of detonation of 1.00 kcal/g. Each hole contained about 1,700 pounds of slurry and the maximum charge weight per delay was 5,300 pounds. Powder factors, assuming infinite
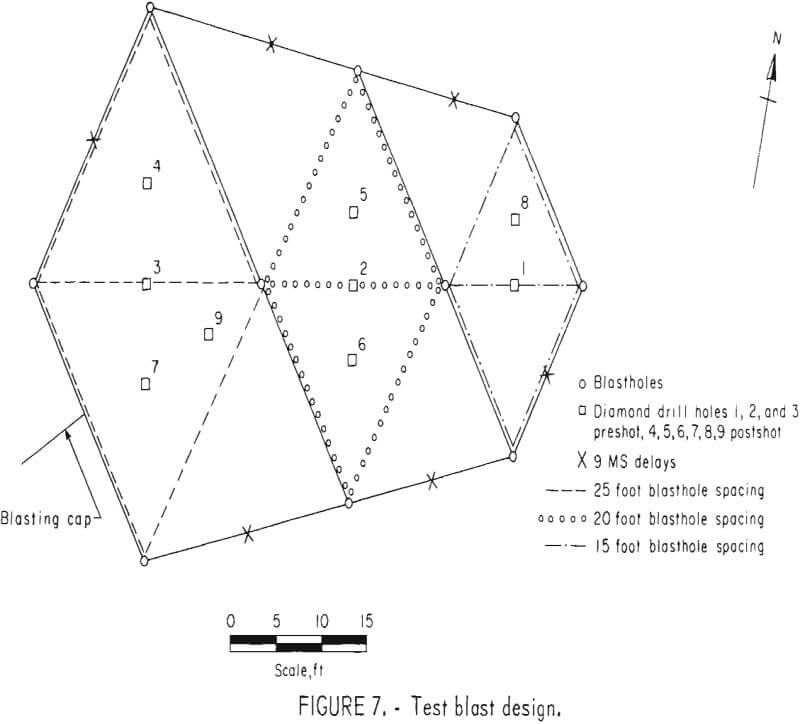
patterns, were 0.79, 1.24, and 2.20 lb/cu yd for the 25-, 20-, and 15-foot patterns, respectively. On a weight basis, powder factors were 0.41, 0.64, and 1.13 lb/ton.
Blast Vibrations
A portable three-component particle-velocity-recording seismograph measured ground vibrations at a distance of 800 feet from the blast. The maximum peak particle velocity recorded on the three-component portable seismograph was 0.95 ips at a distance of 800 feet. This value was lower than expected and indicated that the rock was weathered and fractured.
Blast Damage Analysis
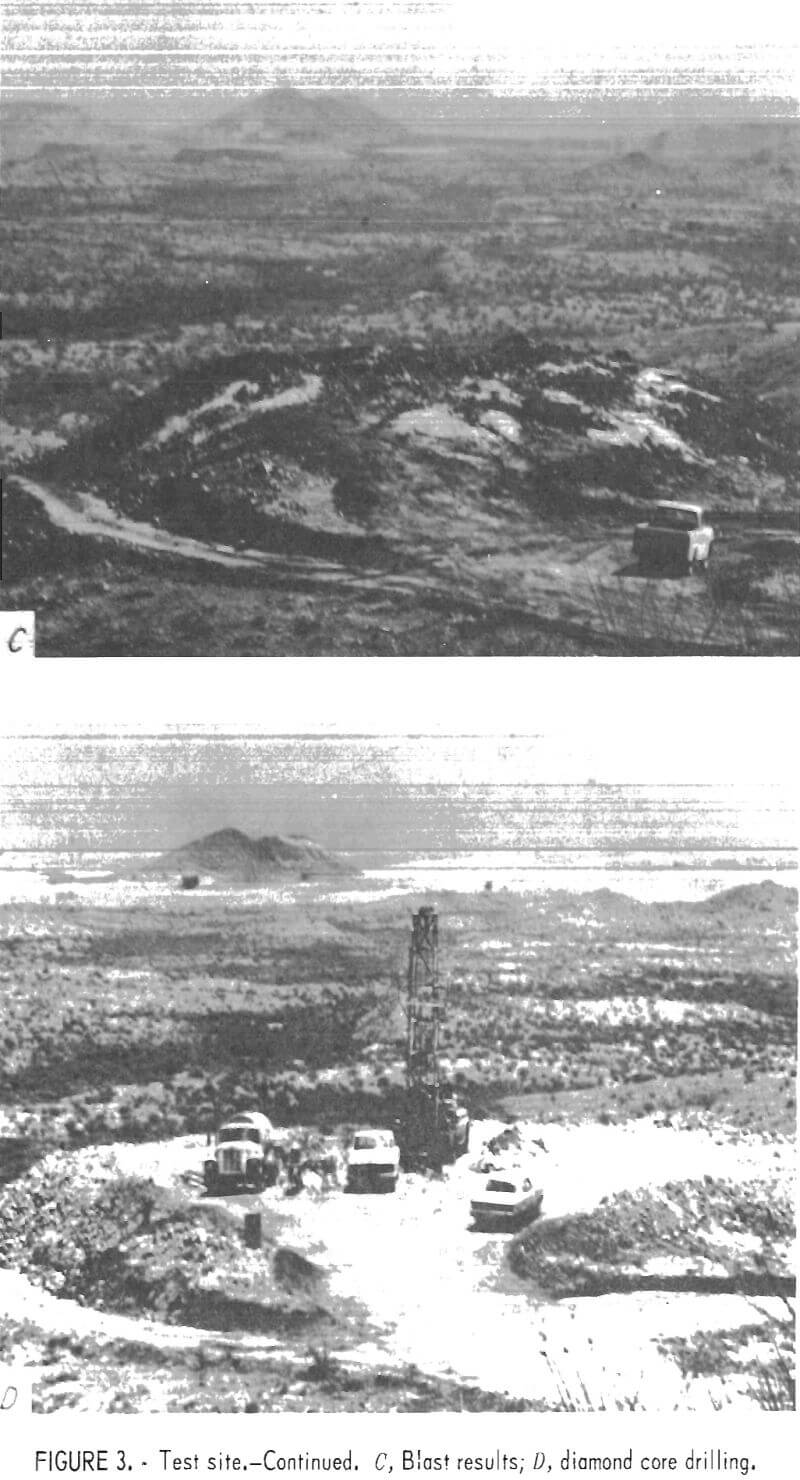
Postshot studies at the test site included a topographic survey, detailed mapping of surface fractures, fragment-size distribution measurements of broken rock on the surface, and drilling of six NQ-diameter core holes into the broken zone. Laboratory measurements on the rock core were used to determine core recovery by length and weight, RQD index, and fragment size distribution. Results of the postshot studies are presented with those of the preshot studies to compare both conditions of the ore body easily.
Topographic Mapping and Surface Swell
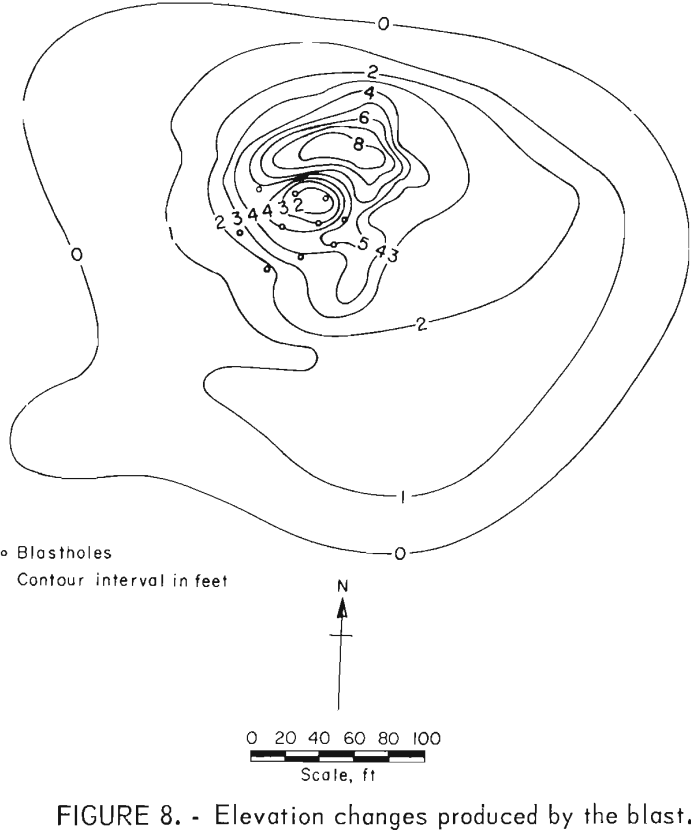
A detailed postshot topographic survey allowed an accurate measure of elevation changes (swell). The 68 permanent survey points were resurveyed. Figure 8 shows that the greatest elevation changes were caused by rubble material being piled up about 50 feet to the north-east of the center of the blast. Three factors contributed to this irregular muck pile distribution: (1) The pattern changed from 25- to 15-foot blasthole spacing toward the northeast; (2) the blast, initiated in the southwest, proceeded to the northeast; (3) the surface fell off in the northeast direction. The surface rise in the disturbed area averaged about 5 feet, and the total volume increase produced by the blast was 5,100 cu yd. A swell factor, defined as the final volume divided by the original volume, was difficult to determine because of uncertainty over the proper areas to use. Assuming an overbreak region of 12.5 feet around each blasthole the original volume was 16,800 cu yd and the resulting swell factor was 1.30.
Fracture Surface Mapping
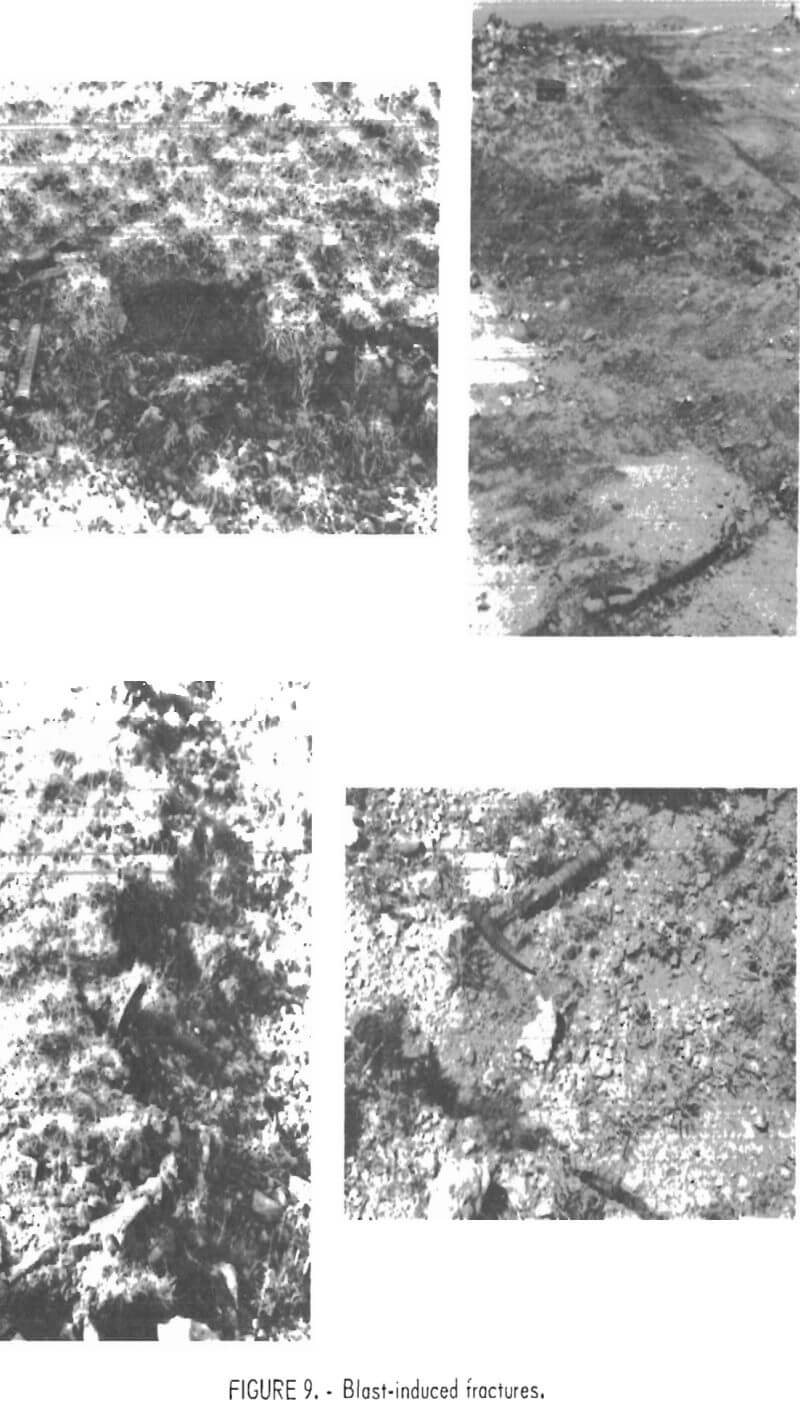
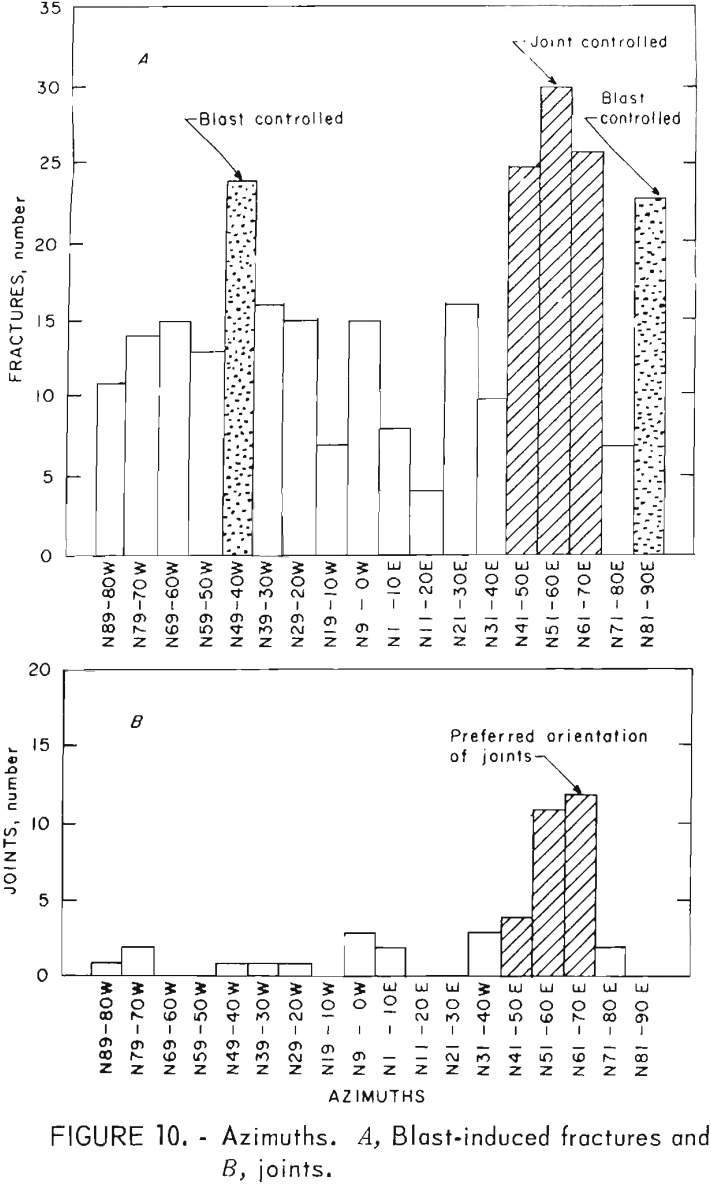
In order to study the effects of blast damage on surface geologic structures, azimuths of joints and quartz veins as well as blast-induced fractures were measured and plotted (fig. 4). Typical fractures are shown in figure 9. Azimuth of all fractures mapped were plotted in histogram form (fig. 10). The histograms show that the joints and quartz veins have a preferred orientation of N 40° to 70° E (fig. 10B). The blast-induced fractures (fig. 10A) have three preferred orientations, one of which is N 40° to 70° E and which is interpreted as being “controlled” by the geologic structures. The other two orientations (N 80° to 90° E and N 40° to 50° W) are attributed to the blast-induced doming of the rock mass. Doming is indicated by the elevation change survey.
Postblast Drilling Procedures
The locations of the six postshot diamond drill holes are shown in figure 7. These holes were drilled in the center of equilateral triangles formed by the 25-, 20-, and 15-foot blasthole spacings with an NQ double barrel wire line system. Minimum breakage would be expected in the center of these equilateral triangles with fragmentation improving near the bias tholes. In an attempt to establish how the fragmentation changed away from the center of the 25- foot pattern, hole 9 was drilled in the 25-foot pat-tern, but only 7 feet from a blasthole.
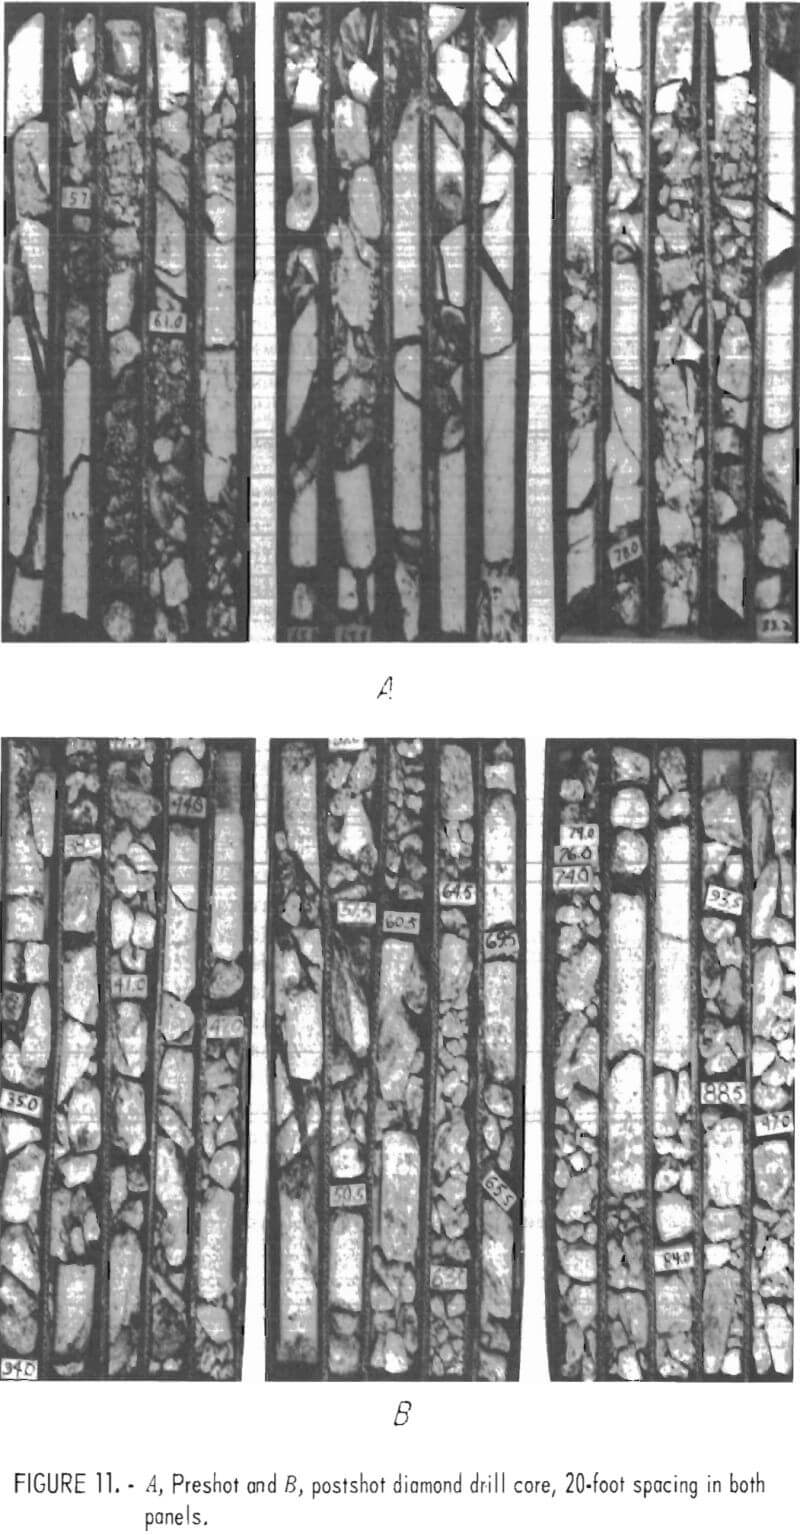
Diamond drilling into the broken zone presented problems. The postshot holes were all drilled without return circulation of drill muds, and bit life averaged only 67 ft/bit. However, six postshot holes were successfully drilled to depths of 100 to 120 feet and no holes were lost from caving. A comparison of preshot core (No. 2) and postshot core (No. 6) taken from the 20-foot blasthole spacing is presented in figure 11A and figure 11B, respectively. Fractures in the core induced by the coring process could not be differentiated from blast-induced fractures; therefore, size analysis data obtained from examination of the core are considered minimum values.
Length Recovery
Percent core recovery by length was used as a quantitative measure of fracturing. After receipt of the core at the Bureau’s Twin Cities Mining Research Center, the core was photographed in its core boxes, and core lengths
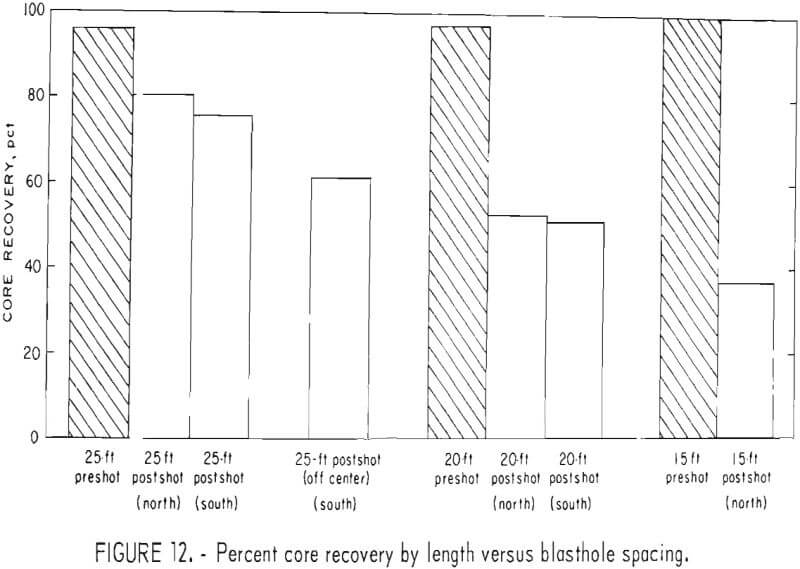
were measured from the photographs. Figure 12 presents data on the percent of core length recovery versus blasthole spacing for the preshot and postshot cores. These are average values for the entire core and were based on the following formula:
Percent recovery = Core length/Drill hole length x (100)
Figure 12 shows:
- The similar values for preshot cores (96.4 percent, 97.9 percent, and 100.6 percent) are relatively higher than the values from the postshot cores.
- The postshot values decrease with a decrease in blasthole spacing.
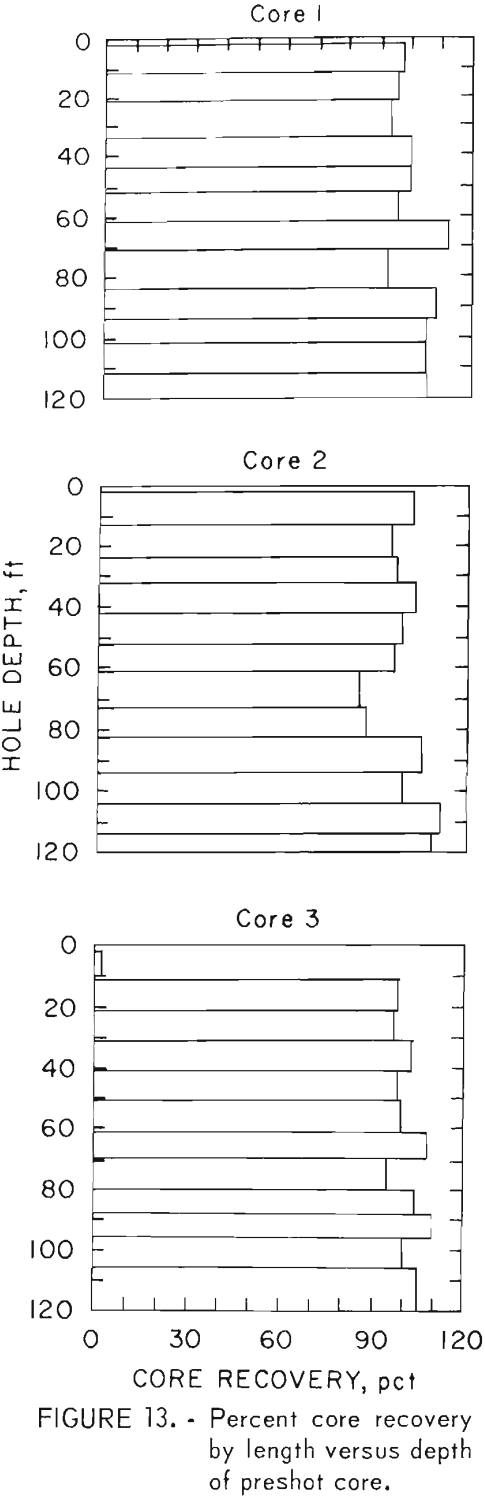
Note that in the data presented in figure 12, the value for the 15-foot preshot core exceeds 100 percent and values for the 25-foot postshot cores were not as closely reproducible as those for the 20-foot postshot cores. In order to further evaluate this result, percent core length recovery was plotted per 10-foot interval for the three preshot cores (fig. 13). Each of the preshot cores contained some 10-foot intervals that exceed 100 percent, caused perhaps by inaccuracies in measuring the “core runs” in the field or measuring the core lengths from the photographs. However, the high values could have come from shifting of the core during transportation in its core box (that is, the rubble was shifted slightly and attained a greater apparent length in the box). To solve this problem, weight, rather than length recovery, was measured.
Weight Recovery
Percent core recovery by weight does not suffer from the measurement inaccuracies of the length recovery method. In the weight recovery method, the following formula was used:
Weight of core per foot of drill
hole (lb/ft) = Weight of core (lb)/Length drill hole (ft)
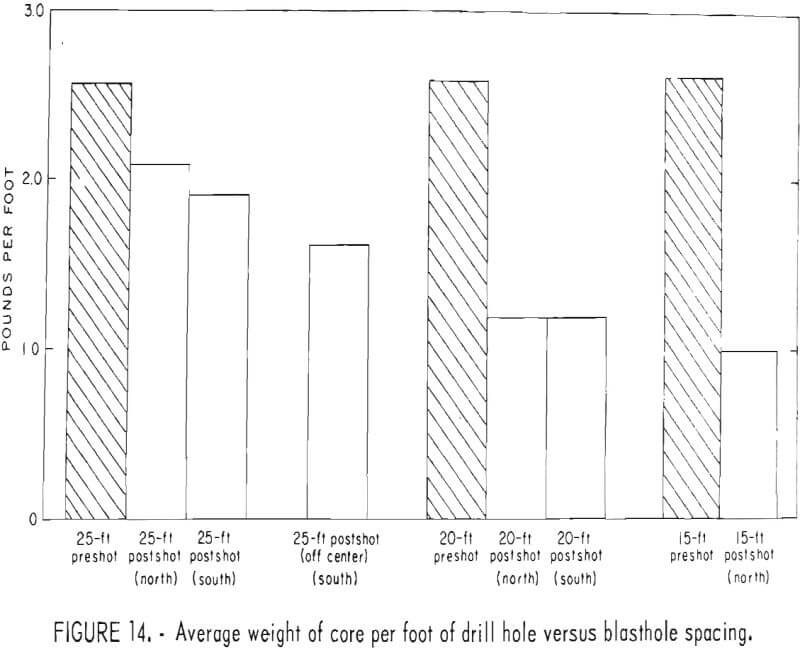
The maximum value from the core using the above formula is 3.16 lb/ft. This value was obtained by first determining the rock’s specific gravity (table 3) to be 144.84 lb/ft³ (2.32 g/cm³) and multiplying times the volume of a 12-inch-long cylinder having the diameter of 2 inches (the volume of a 1-foot length of NQ core). This maximum value gives a base to compare the measured values with the blast-damaged cores.
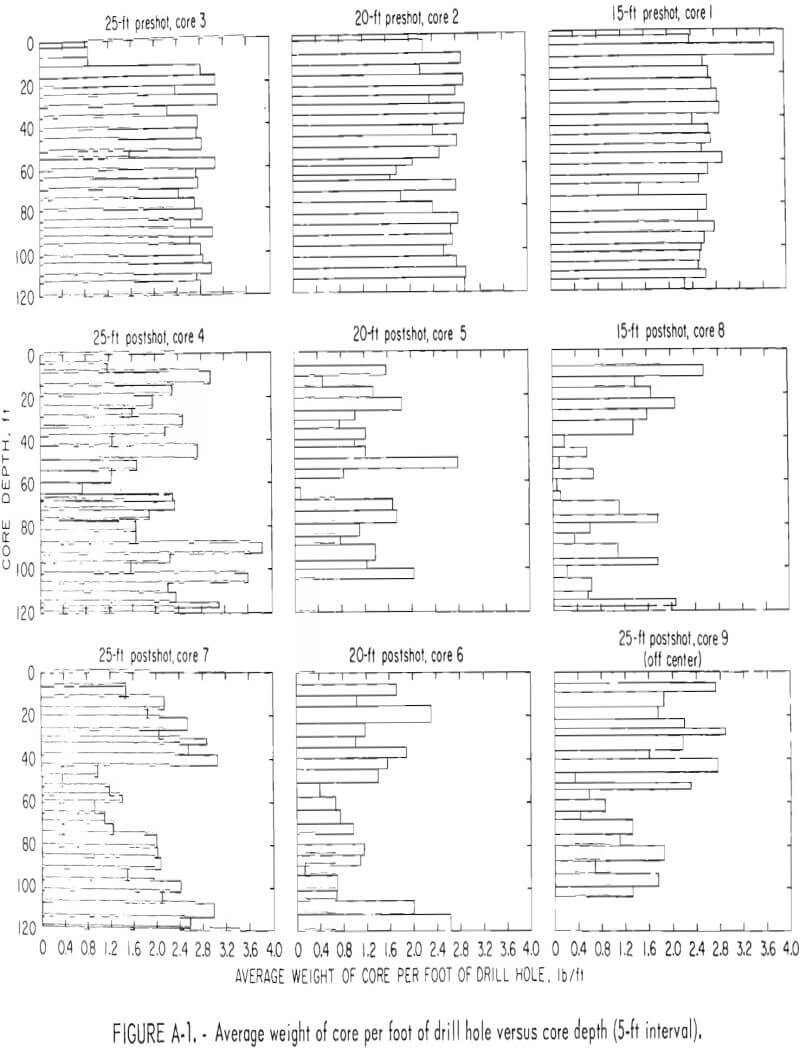
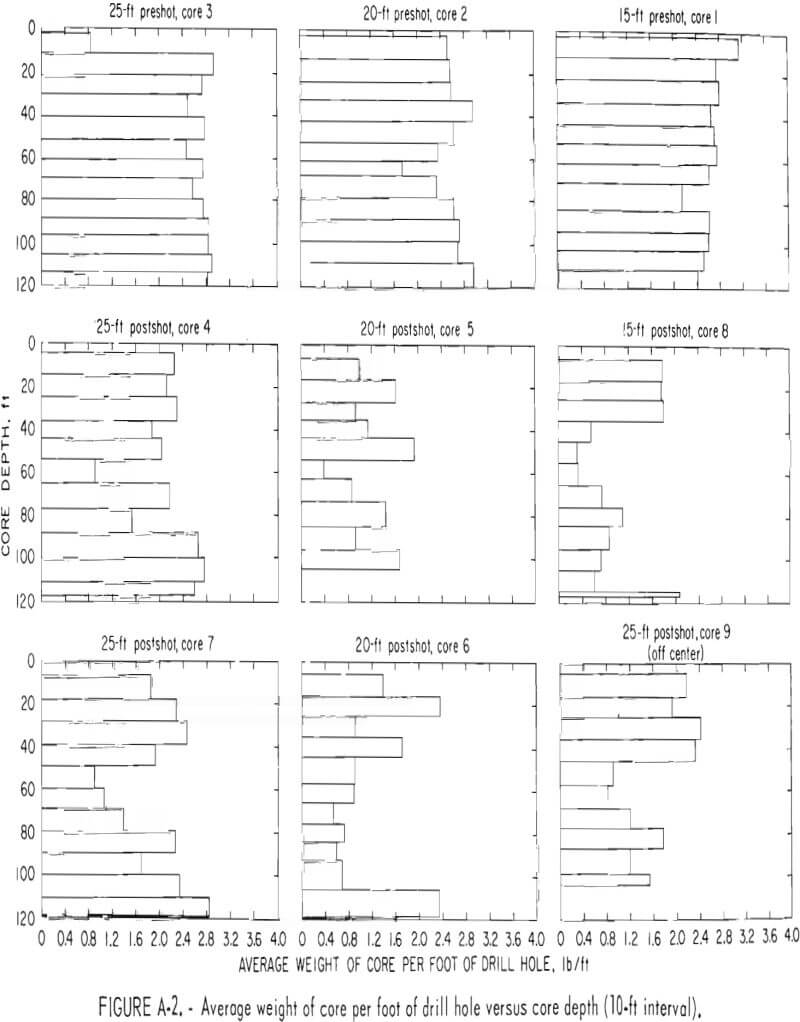
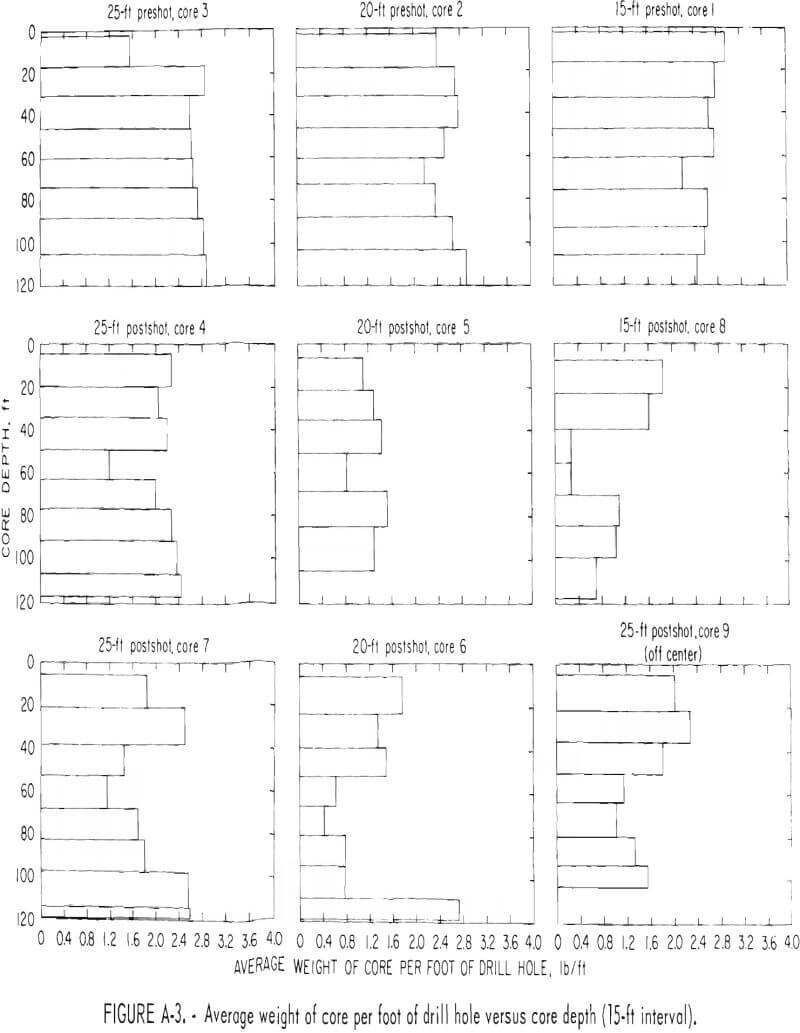
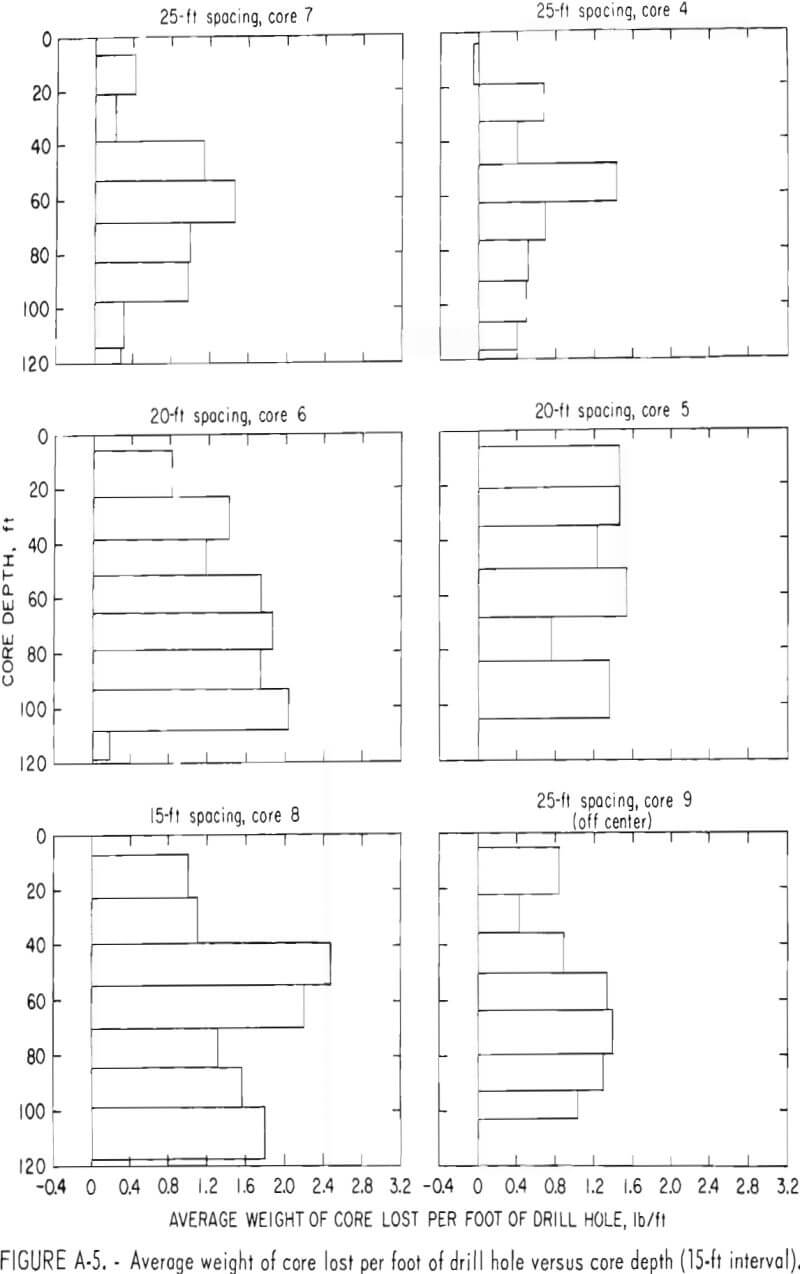
Histograms in figure 14 show the average weight of core per foot of drill hole for the preshot and postshot cores. All values are below the maximum of 3.16 lb/ft. Values for the three preshot cores are nearly identical (2.58, 2.58, and 2.63 lb/ft). Values for postshot cores decrease with decreased blasthole spacing (25-foot spacing, 1.61 lb/ft; 20-foot spacing, 1.20 lb/ft and 1.20 lb/ft; 15-foot spacing, 0.99 lb/ft). These data show that weight of core per foot of drill hole is a good measure of blast damage and the method was extended to pinpoint the location of maximum blast damage in each core. Average values of the weight of core per foot of drill hole were obtained for 5-, 10-, and 15-foot intervals for each core (figs. A-1 to A-3).
Some values obtained for 5-foot intervals exceeded the maximum of 3.16 lb/ft. This inconsistency is probably due to the inaccuracies of measuring core runs in the field. The effect of these inaccuracies is decreased in the larger (10- to 15-foot) intervals. However, data from the 15-foot intervals lack detail and appear “smoothed.”
For these reasons, analysis of the weight recovery data is based primarily on the 10-foot intervals.
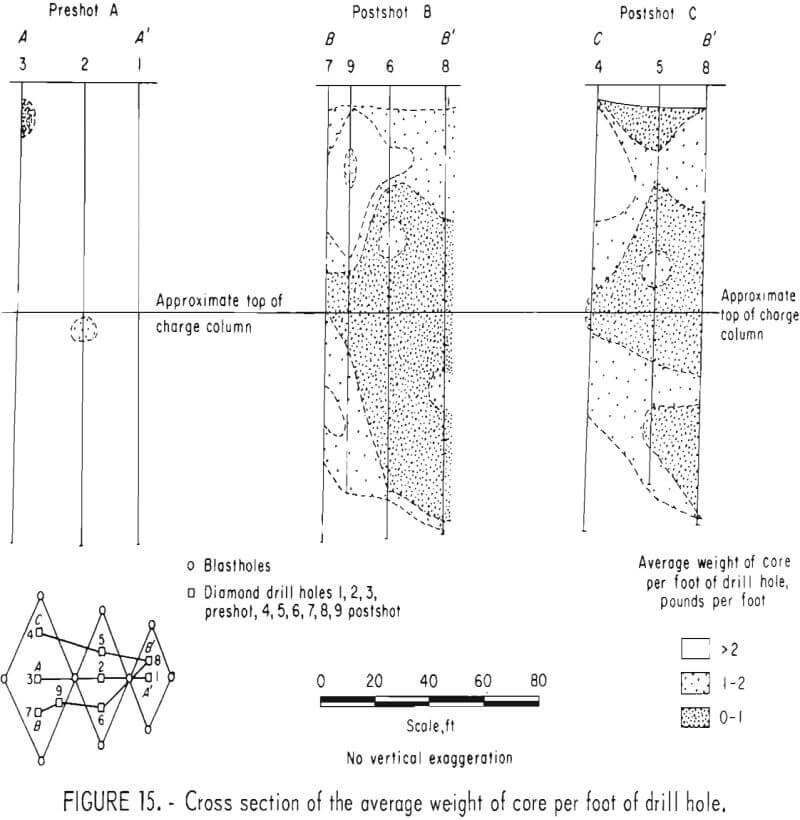
Data from the 10-foot interval histograms, plotted in cross section form (fig. 15), show the spatial distribution of the average weight of core per foot of hole for the preshot (cross section A-A’) and postshot cores (cross sections B-B’ and C-B’). The cross sections were made by selecting the points on the histograms where the bars exceeded values of 1 and 2 lb/ft. The position of these points and their values in pounds per foot were plotted on the cross sections and the values were contoured.
Examination of these cross sections suggests that:
- Preshot core recovery was dominantly in the >2-lb/ft range, but was below the 3.16 lb/ft maximum value, indicating geologic fracturing of the rock
- Postshot core recovery was dominantly in the 0- to 2-lb/ft range. Blast damage is shown since these values are below the preshot values.
- Postshot core recovery, below the top of the charge column, decreases from the core obtained in the 25-foot spacing to that recovered in the 15-foot spacing. This indicates increased blast damage with smaller spacings.
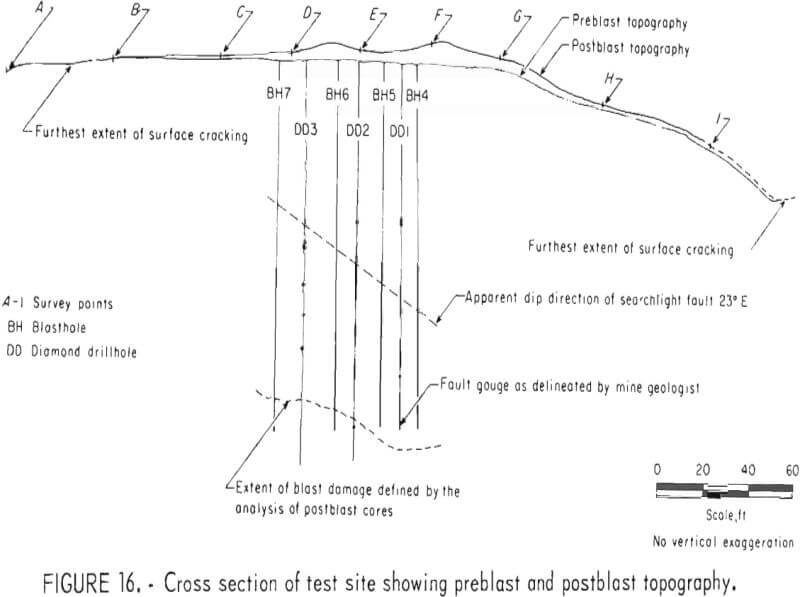
- Postshot core recovery above the top of the charge column is the lowest for the 20-foot spacing which indicates increased blast damage above that spacing. This rock was located in the center of the array where some doming took place (fig. 16).
Doming may account for the increased fracturing.
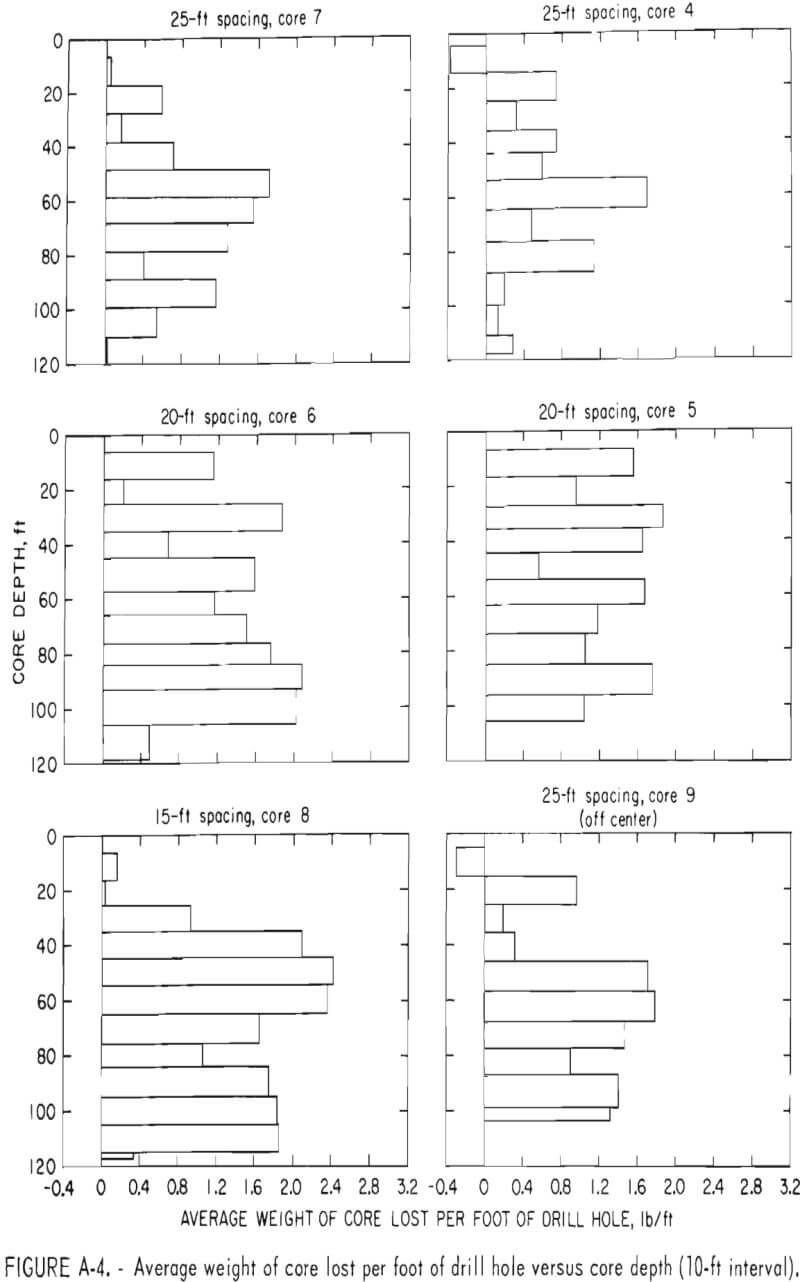
The weight recovery data contain information on both the initial geologic fracture state of the rock and the postblast fracture state of the rock. To isolate information on the amount of blast-induced fragmentation the data from postshot cores were subtracted from those for the preshot cores for each spacing. The subtraction was accomplished by superimposing the postshot weight-recovery histograms (cores 4, 5, 6, 7, 8, and 9) over their respective preshot weight-recovery histograms (cores 1, 2, and 3) and observing the differences. These values were in turn plotted in histogram form (figs. A-4 to A-5).
The 10-foot interval histograms were plotted in cross section form (fig. 17) to show the spatial distribution of the differences between the preshot and postshot cores for the average weight of core recovered per foot of drill hole. Thus they indicate the spatial distribution of only blast-induced fragmentation. The values are given in units of pounds per foot and actually represent that amount of core lost due to blast damage. Therefore, the larger values in pounds per foot represent more blast damage.
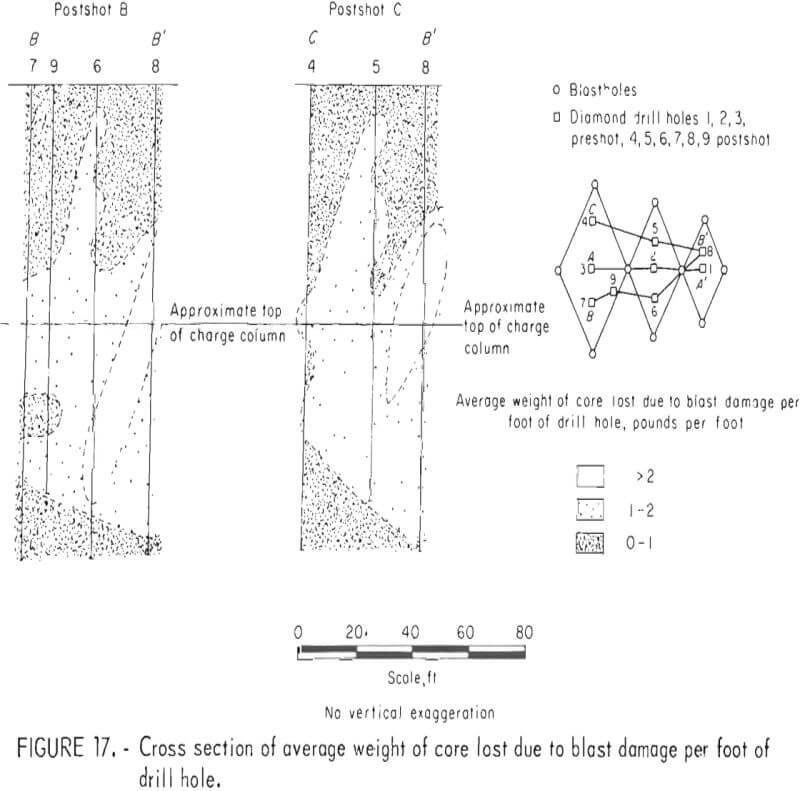
These cross sections allow the following observations:
- The most intense blast damage (values greater than 2 lb/ft) was just above the top of the charge column in the 15-foot spacing and near the base of the charge column in the 20-foot spacing.
- Blast damage below the top of the charge column increased, on the whole, from the 25-foot spacing to the 15-foot spacing.
- Blast damage above the top of the charge column reached its highest point for the 20-foot spacing, probably due to the doming effect discussed earlier.
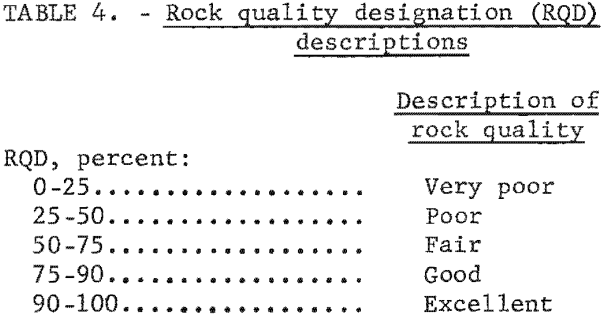
Rock Quality Designation
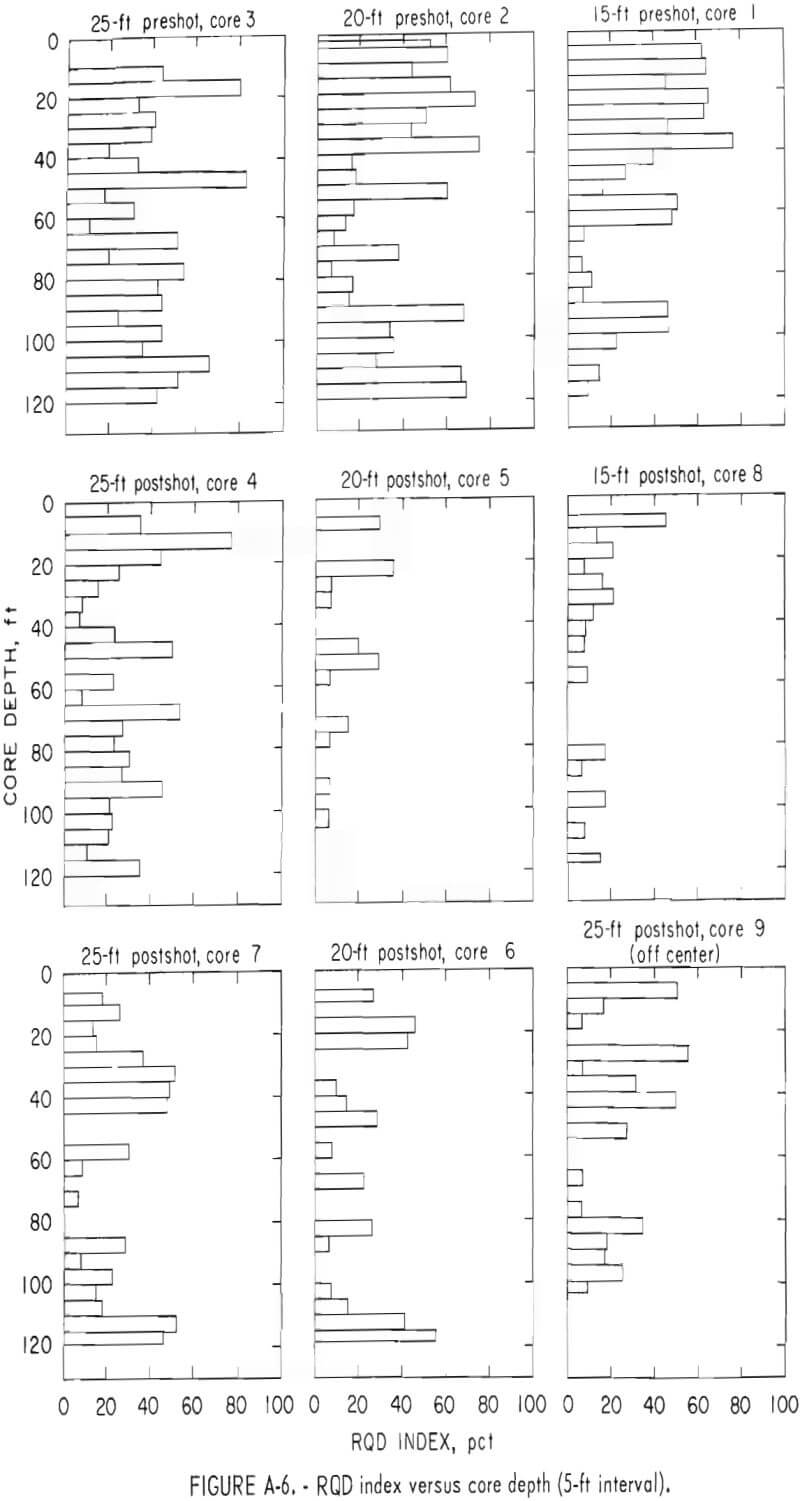
The rock quality designation (RQD) after Deere was determined for each of the preshot and postshot cores (holes 1-9). In the past, RQD has been used as an engineering index for classifying rock, and to a certain extent as a measure of jointing in a rock mass. The RQD is obtained by measuring the total length of all pieces of core greater than or equal to 4 inches and by dividing the total by the length of the particular core run. The result is expressed as a percent and its breakdown in terms of rock quality is given in table 4.
In this study, RQD was used as a measure of blast damage to differentiate the preshot and postshot core. A summary of the average RQD for each core taken at the test site is given in table 5. In addition, a graphic presentation of the RQD indexes is shown in figure 18.
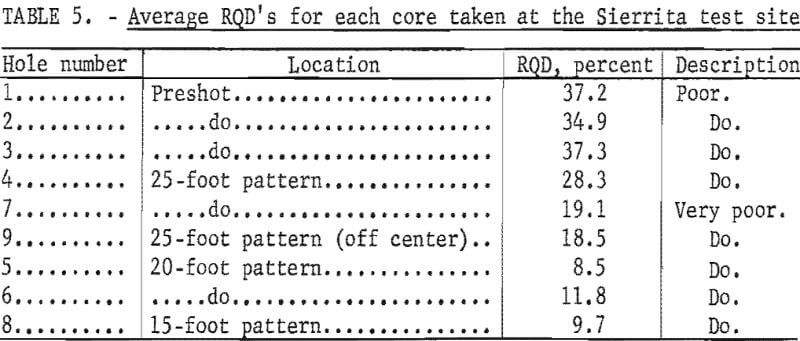
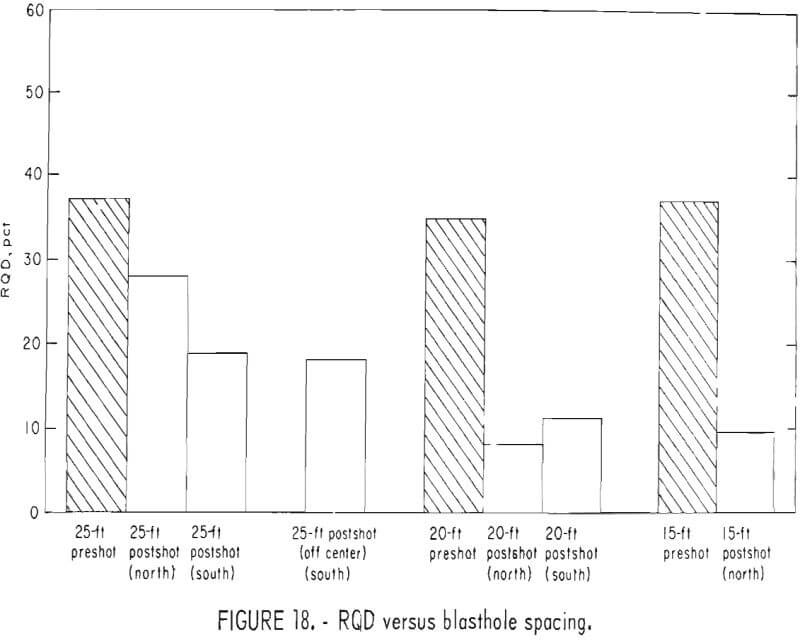
The purpose in using RQD was to determine its value as a blast damage indicator for quantitatively differentiating between the preshot and postshot core. From figure 18 it can be seen that the RQD could differentiate between the preshot and postshot core and was also sensitive enough to differentiate between the 25-, 20-, and 15-foot-spacing postshot cores. The RQD for hole 5 is slightly less than expected. This might be related to the geologic structure (Searchlight Fault) at the test site.
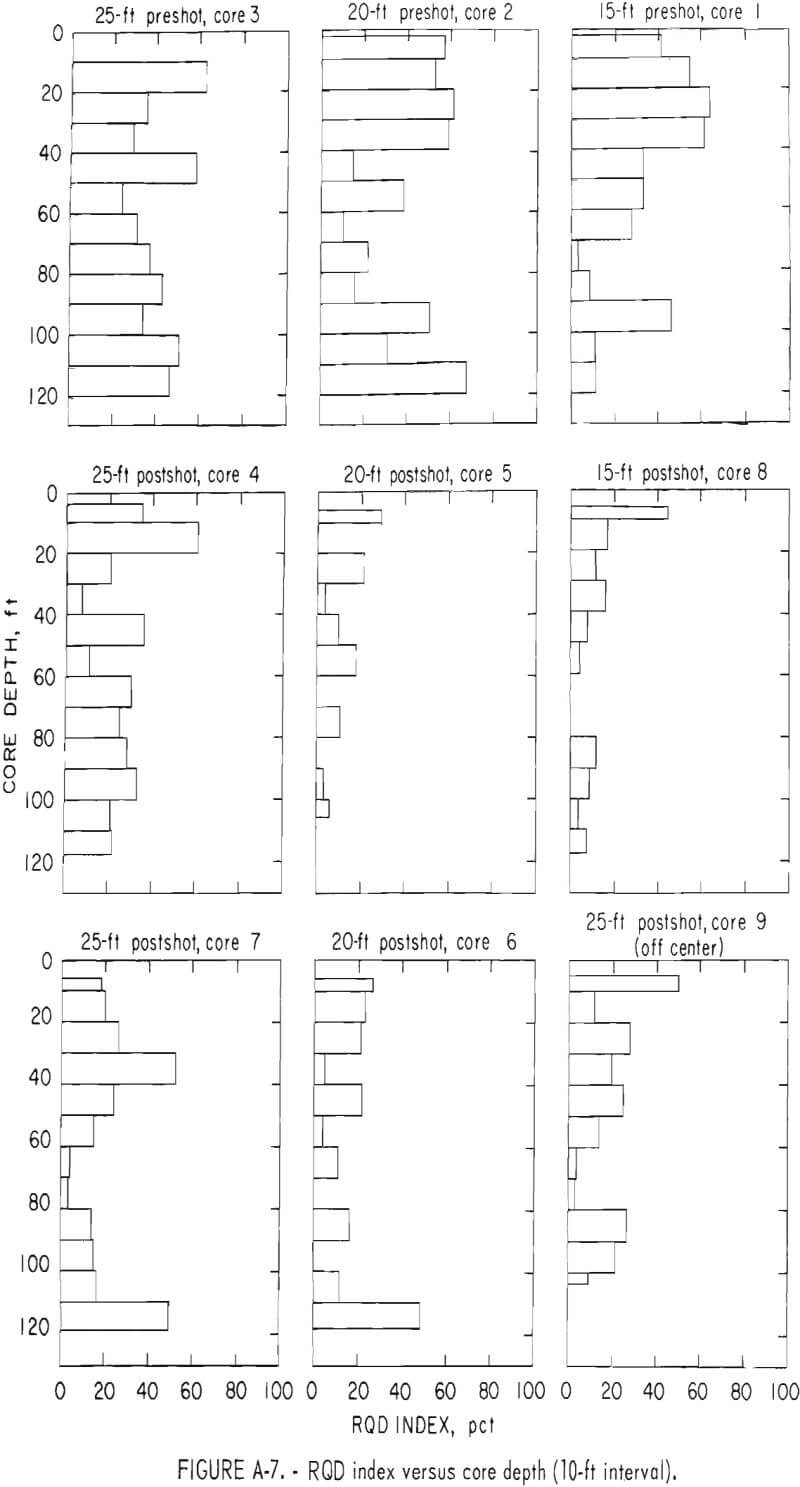
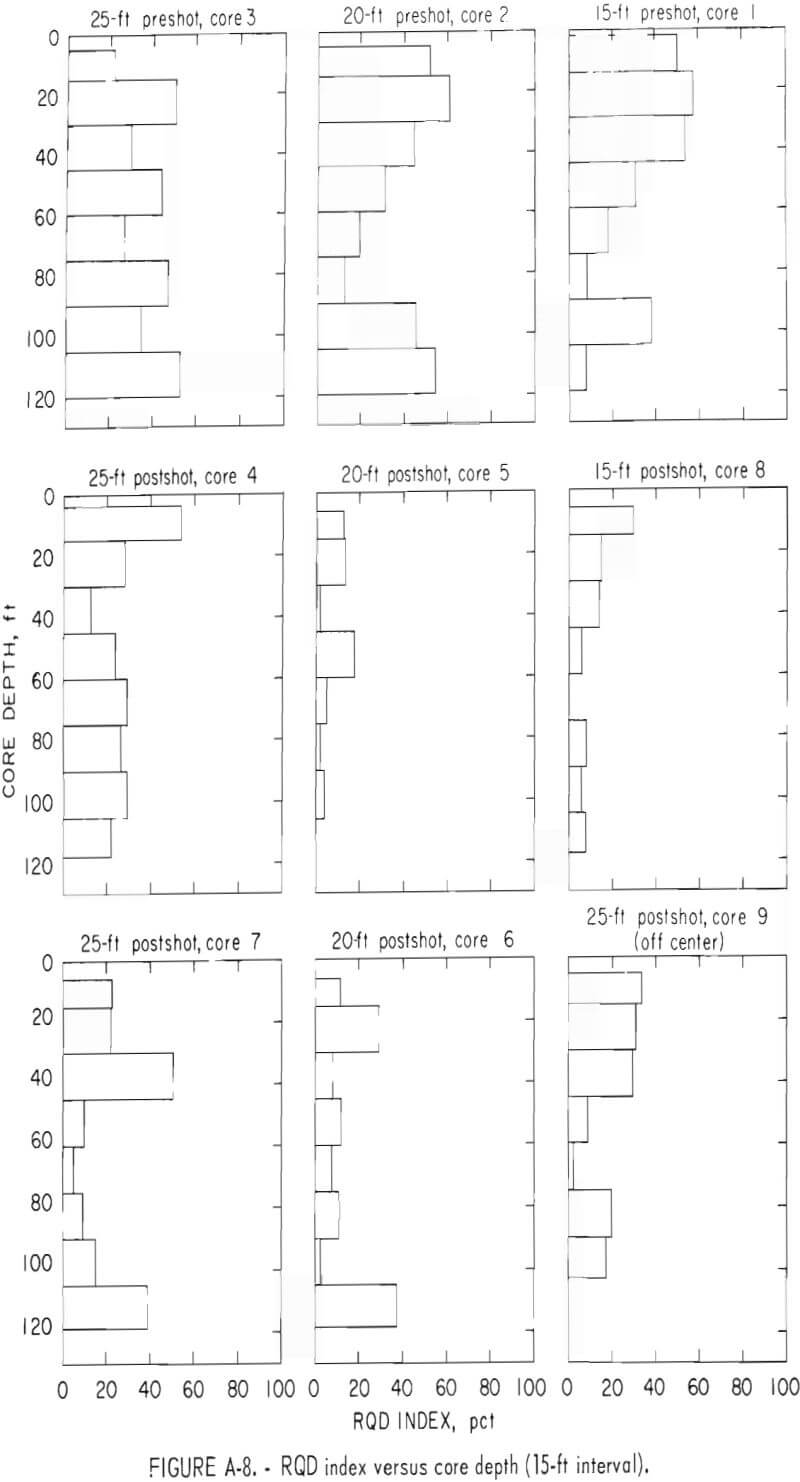
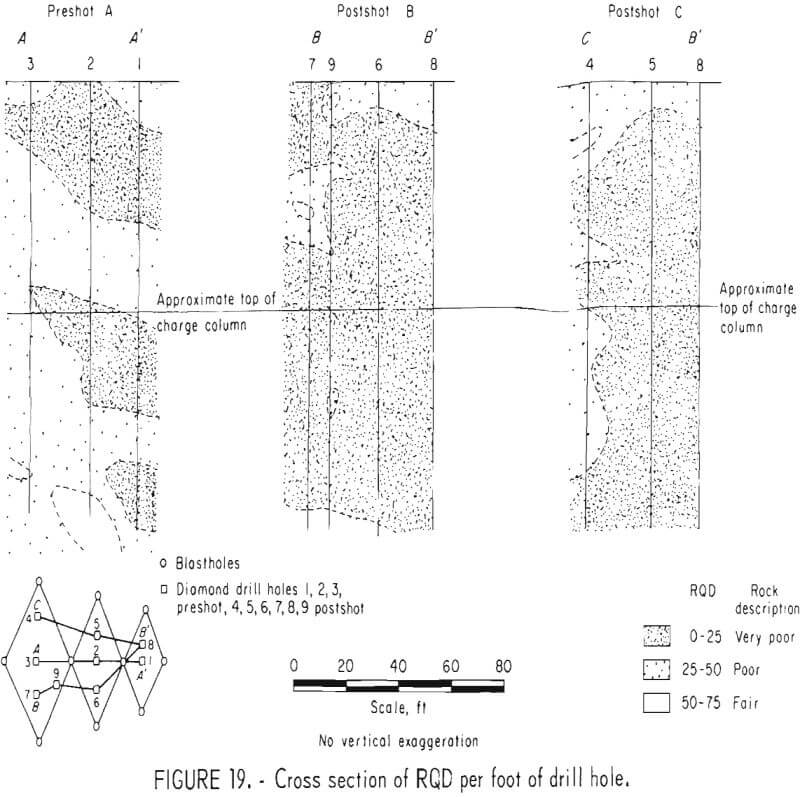
Average RQD values were determined for 5-, 10-, and 15-foot intervals of core length (figs. A-6 to A-8). By plotting the RQD values at the 10-foot intervals, it was possible to construct cross sections that depict changes in rock quality (fig. 19). Section “A” shows the preshot distribution of rock quality and sections “B” and “C” show the postshot rock quality distributions. The preshot section depicts a significant amount of “poor” rock and a smaller area of “very poor” rock in the middle. The “very poor” rock is probably due to the Searchlight Fault.
The postshot sections are quite different from the preshot section in that they contain very little “poor” rock, and a higher percentage of “very poor” rock. The postshot rock quality decreases from the 25-foot spacing to the 15-foot spacing, and a slight doming is present in the very poor rock under the 20-foot spacing.
Size Distribution−Drill Core
An important factor influencing the economic success of a leaching process is the size of the material to be leached. The average size of the pieces fragmented by blasting should not be so large as to greatly
decrease the surface area exposed to the acid, nor so small as to inhibit the leaching process by preventing percolation of the acid waters through the ore body. For this reason, size distributions were determined for the preshot and postshot cores.
After photographing the cores in the laboratory, an appropriate bar scale, drawn on a transparency, was placed on the original photograph of a single core. The bar scale was drawn with scaled 1-inch intervals, and paralleled the longitudinal core axis. A center line was drawn on the overlay to aline the center of the core with the scale. All pieces intersecting the center line of the core were counted and sized. Pieces less than 1 inch were not sized. A summary of the size distributions of the preshot and postshot drill core in percent by numbers is shown in figure 20. By comparing the preshot to the postshot cores, changes in size distributions can be seen. Preshot cores 1, 2, and 3 have similar size distributions. The smallest interval sized (>1 ≤2) has approximately 40 percent by number in each case, with a fairly regular decrease in number of pieces greater than 2 inches. The longest piece of core was 12 inches with an anomalously long length of core (> 16 inches) in core No. 2.
Progressive changes in the postshot core can be seen in going from the 25-, to the 20-, to the 15-foot blasthole spacing (fig. 20) except for core
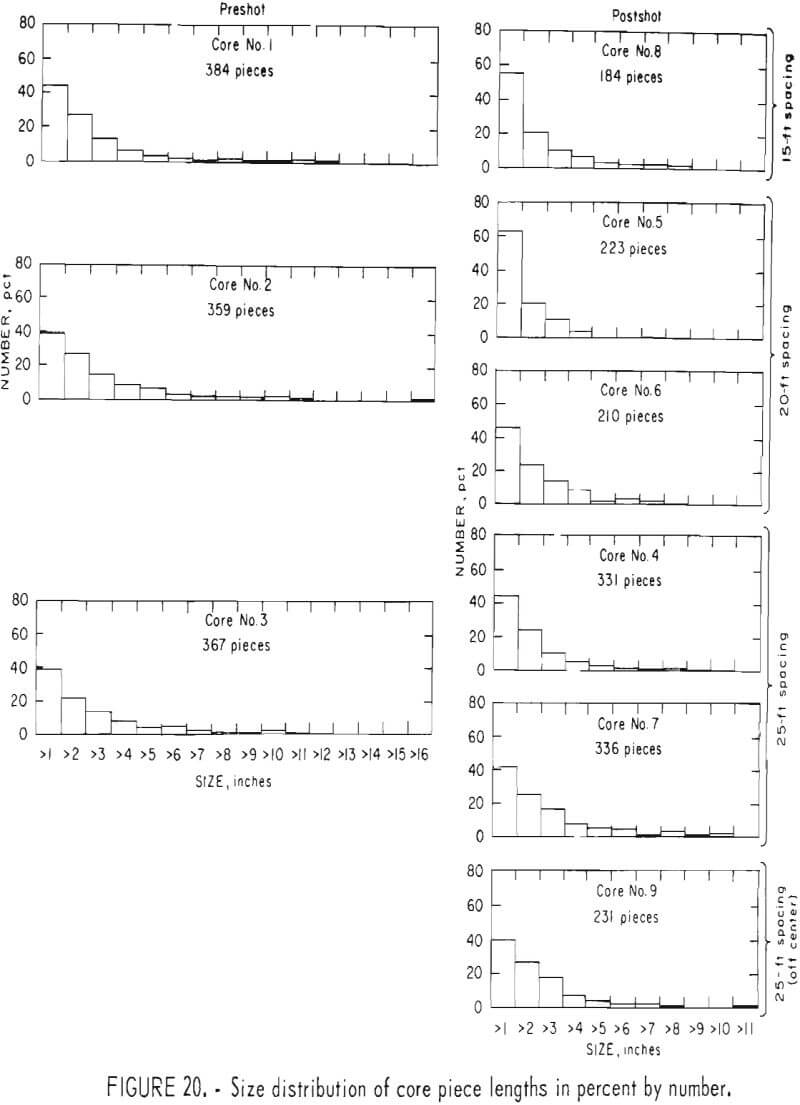
No. 5. This change is reflected in both the increase in percentage of small fragments (> 1 inch) and thus the decrease in percentage of larger pieces (>9 and 10 inches). The decrease in the size of the larger pieces is very important. For example, the longest piece found in core No. 8 was about 8.5 inches. Cores 7 and 9 (25-foot spacing) have a greater number of the larger pieces (longer than 10 inches) indicating less blast damage in the 25-foot spacing than in the smaller spacings.
The values obtained for small particle sizes are probably conservatively biased. Material of less than 2 inches is not always caught in the core barrel. These pieces, to be caught, have to be “sandwiched” in the core barrel above and below new drill core. However, before this happens, smaller pieces of core (<2 inches), such as pebble- and sand-size particles, can be abraded by the drilling process and continually forced against the drill bit by the pressure of the drilling mud coming down the drill steel. Well-rounded pieces of core are not uncommon. Finally, small pieces of core can be flushed out by the fluid pressures when the drill steel is lifted.
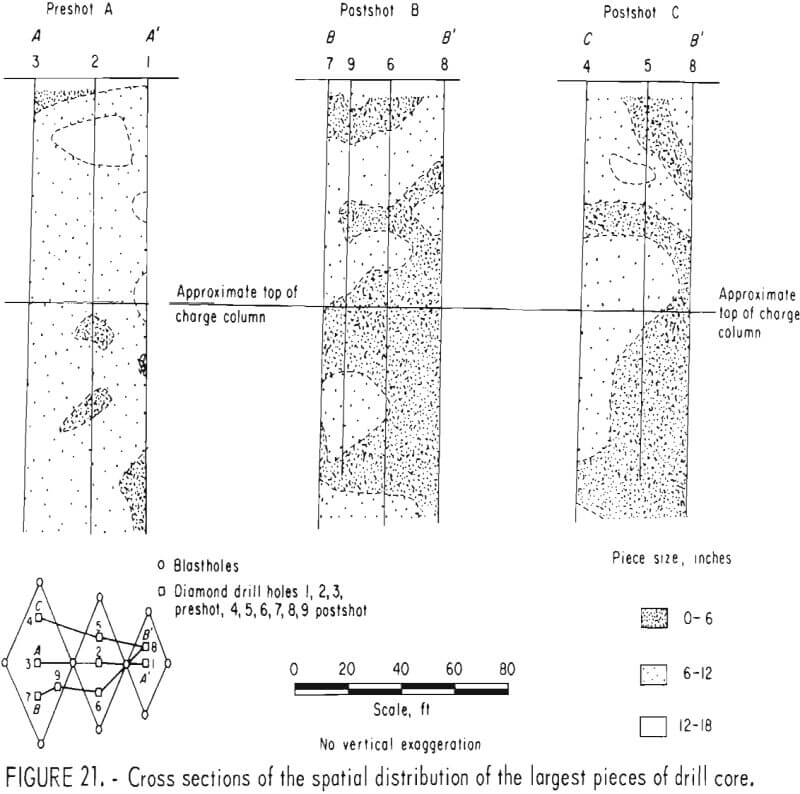
Figure 21 contains cross sections which show the spatial distribution of the largest pieces of core. In generating figure 21, the largest piece of core per 10-foot interval was determined and its value was plotted at the midpoint of the interval’s depth, and these values were contoured.
Observations based on the size distribution data are:
- The percentage of smaller pieces (> 1 inch) increases, when going from the 25- to the 15-foot spacing, while the percentage of larger pieces decreases except for core No. 5.
- Very few pieces of core were greater than 11 inches long before the blast occurred.
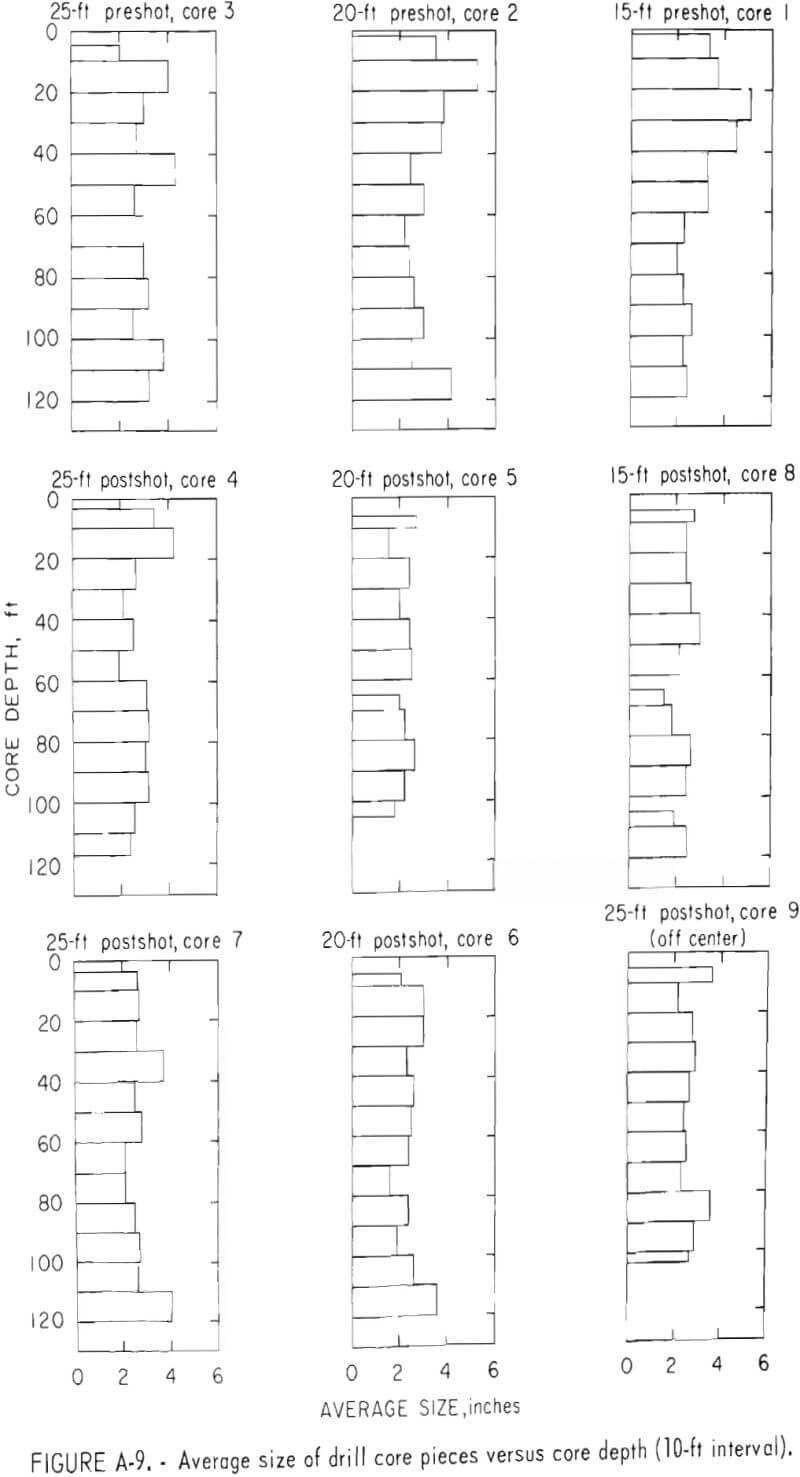
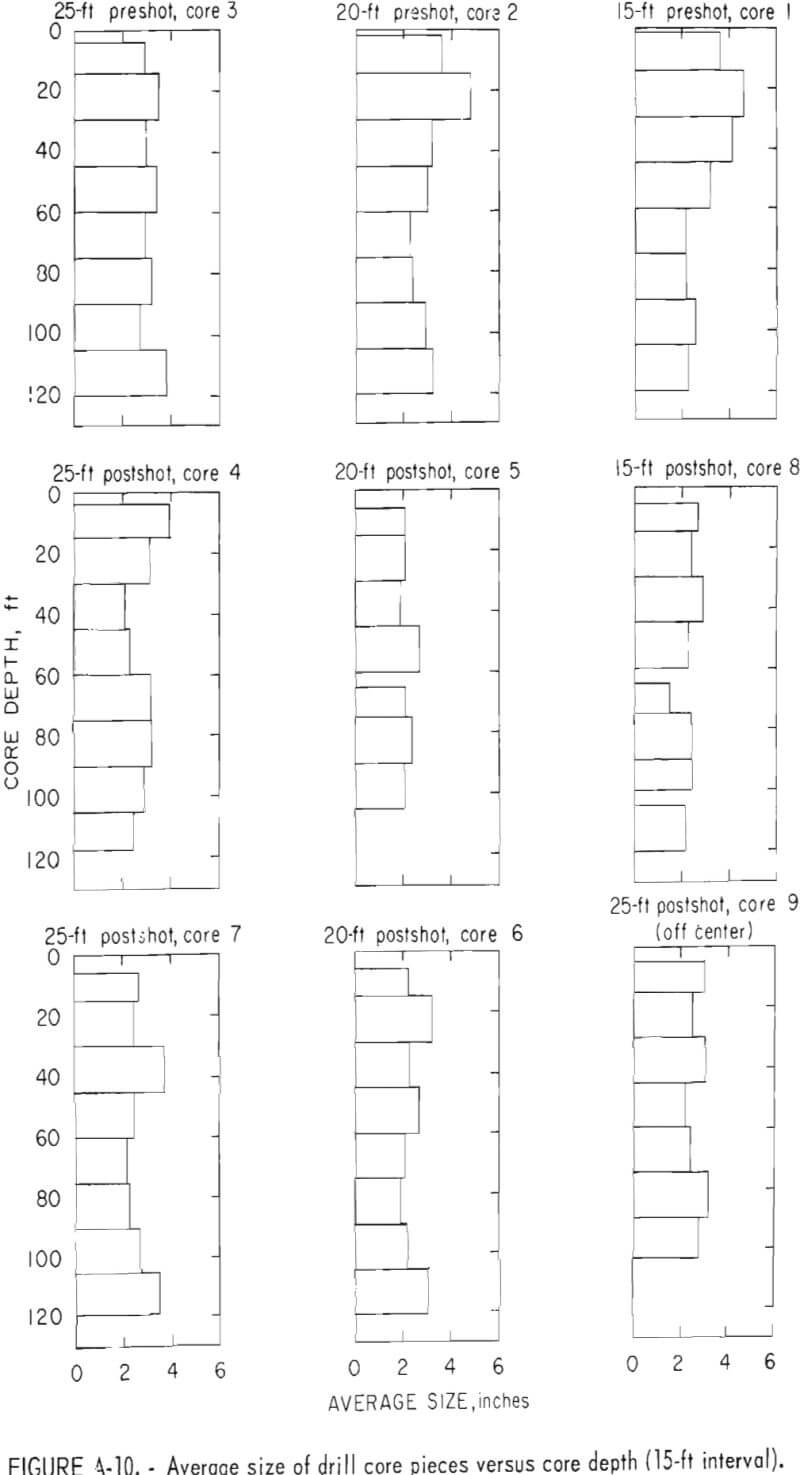
Average Size
The average size of drill core pieces (> 1 inch) was determined for each core. Figure 22 is a summary of these results. Average size appears to be
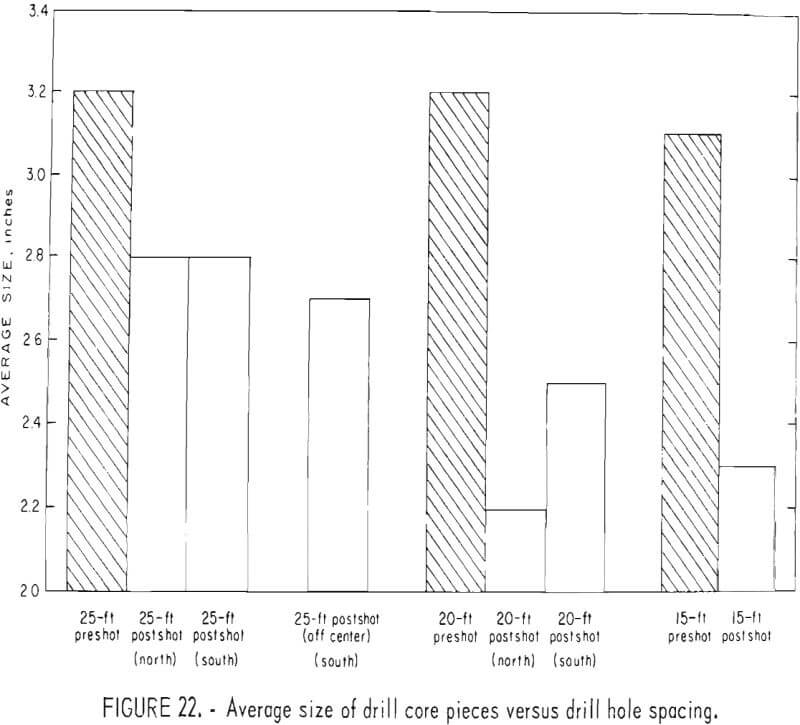
a very sensitive indicator of blast damage. The preshot cores (3.1, 3.2, 3.2 inches) have a fairly constant average size while the postshot core size decreases linearly for holes 6, 7, and 9. The average size for hole 5 is quite a bit less than was expected caused, perhaps, by the Searchlight Fault. Brecciation and gouge in the fault zone would decrease the average size. The change in average size for all the core holes is only 1 inch (3.2 to 2.2 inches); however, blast damage in terms of average size reduction increases from the 25-, 20-, 15-foot spacing, as is shown in figure 22. Changes in average size of cores as a function of depth were determined for both 10- and 15-foot intervals (figs. A-9 to A-10).
Size Analyses of Surface Rock
Size distributions, by number, of surface rock fragments were determined at three locations at the test site. Two locations were in the muck pile and one location at a rock outcrop away from the blast damaged area. The first two locations, referred to as “muck pile I” and “muck pile II,” are shown in figure 4. The third location, referred to as “unblasted,” was about 150 yards southwest of the blastholes (off the mapped area).
The large muck pile was formed by the test blast and subsequently reshaped by a bulldozer so that drill rigs could be brought onto the site for postshot core drilling. Size distribution analyses were made after bulldozing. Undoubtedly, some secondary breakage occurred during bulldozing.
Muck pile I was located at the toe, or base, of the large muck pile. A 1-meter square was painted on the rocks to delineate the sample area from which 150 rock samples were randomly extracted. Their longest dimension, length, and their second longest dimension, width, were measured. These measurements were recorded and plotted in histogram form. A similar analysis was performed at muck pile II at the top of the muck pile near core hole 1. Size distribution analyses at the “unblasted” location were accomplished by physically dismantling an outcrop along joint planes and measuring 150 rock samples. The data were recorded and plotted.
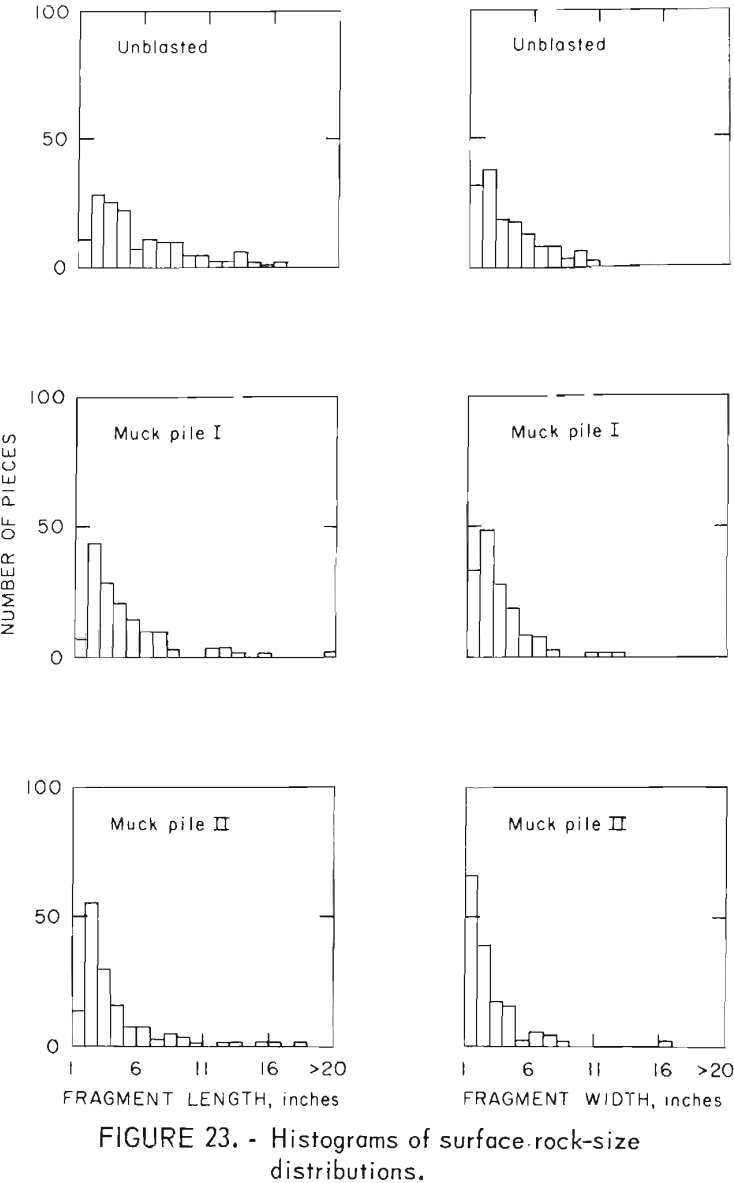
The composite diagram was constructed which con-tained all of the size distribution histograms (fig. 23). Three observations can be made based on analysis of that diagram:
- The pieces from muck piles I and II were smaller (1 to 5 inches long or wide), on the average, than the unblasted area.
- Muck pile II contains more small pieces than muck pile I.
- For all areas, the 2- to 3-inch length interval contains the largest number of pieces.
The first and third observations are expected if blast damage at the surface is thought to occur along existing planes of weakness (joint surfaces) and if the blast simply opened up these existing weakness planes. The second observation can be understood since muck pile I is at the base of the bulldozed muck pile. Material spilled over the crest of a dump, or muck pile, will segregate and the larger pieces will roll to the bottom. Muck pile I, at the base of the pile contained more large pieces than muck pile II. Compared to Ranchers’ blast at the Old Reliable, the Sierrita test site surface muck shows good fragmentation. Ranchers expected fragments measuring 11 inches or less and obtained fragments 9 inches and less. Although the Sierrita surface muck contained some large pieces the majority of its fragments were 11 inches or less.
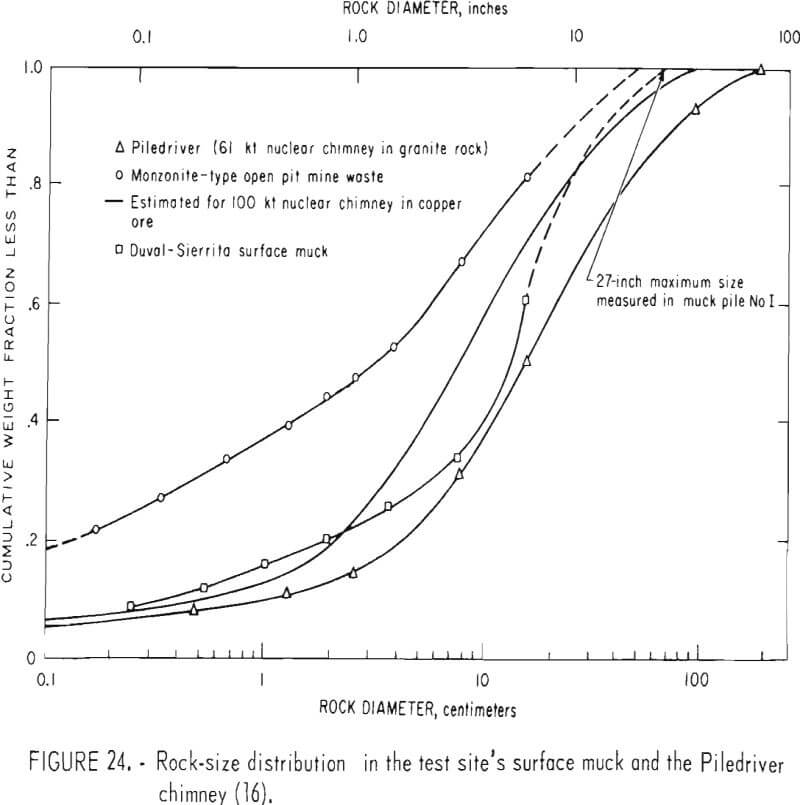
Size distributions by weight were also determined for muck collected from the muck pile. Two locations referred to as “muck lot I” and “muck lot II” were sampled. Muck lot I was at the base of a 6-ft-deep ditch bulldozed into the top of the muck pile (fig. 4). Samples from muck lots I and II were later combined, sieved, and weighed.
Figure 24 is a composite diagram containing the cumulative size distribution by weight of the Sierrita test site surface muck, the Piledriver chimney muck, a 100-kt nuclear chimney muck (estimate), and monzonite-type open pit mine waste. By comparison, the Sierrita size distribution falls between that of the Piledriver chimney muck and the monzonite-type open pit mine waste.
Blasthole Spacing Determinations
Blasts for in situ leaching are designed after examining the density, strength, size, shape, and depth of the ore body. These blasts are usually
designed using a powder factor although the radius of damage around an explosive charge can also be considered.
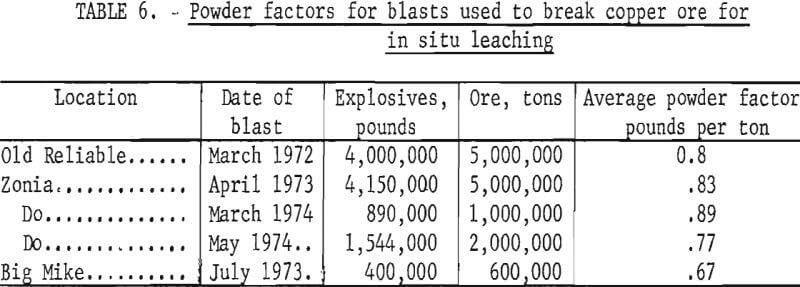
Powder factor is defined as the pounds of explosive per ton or per cubic yard of ore. Powder factors can vary within any one blast since shallow ore zones have lower powder factors than deeper ones. Table 6 lists the average powder factors reported for five separate blasts used to break ore for in situ leaching. The blast at the Old Reliable was a coyote blast with explosives loaded in underground tunnels and differs from the Zonia and Big Mike blasts where explosives were loaded in vertical bias tholes. The lower average powder factor for the Big Mike blast was probably caused by the geometry of the blast where most of the ore was broken in the walls of an open pit with less confinement. The powder factors listed in table 6 can be compared with powder factors of 1.13, 0.64, and 0.41 lb/ton for the 15-, 20-, and 25-foot blasthole spacings tested at the Duval site. The fragmentation produced by all three powder factors was considered adequate for in situ leaching. In general, the blasts listed in table 6 were designed to break ore more deeply buried than the 110-foot depth of the Duval site, therefore, required higher powder factors. However, the successful fragmentation achieved in this experiment suggests that large production blasts designed with lower powder factors could yield satisfactory results.
Blasthole spacings can be calculated after a powder factor has been selected. For example, assume that a blast is designed to break ore from the bottom of the blastholes to the surface and that only the lower half of the blastholes are filled with explosives. The blastholes can be arranged in an equilateral triangle pattern with spacing S, and S can be found from the formula:
S = 30 D√Pe/Pr F
where S = blasthole spacing, feet,
D = blasthole diameter, feet,
F = powder factor, pounds per ton,
Pe = specific gravity, explosive,
and Pr = specific gravity, ore.
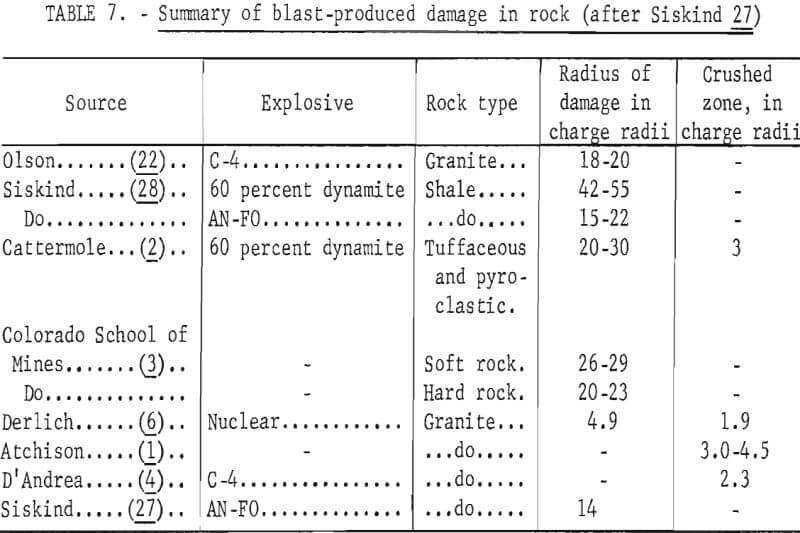
The radius of damage around a blasthole can be used as an aid in designing blasts for in situ leaching. Blastholes should be spaced so that the radius of damage produced around each blasthole meets or overlaps with the damage zone around adjacent holes. Siskind summarizes previous researchers attempts to relate the radius of damage and the crushed zone radius to explosive and rock types (table 7). Based on the composition and physical properties of the rock at the Duval test site, the radius of blast damage observed from this test should be similar to the reported values of 14 to 23 for conventional explosives in granite or hard rock. For the Duval tests site, the radius of damage in charge radii can be estimated by dividing one-half the blasthole spacing by the blasthole radius. These values are 20, 27, and 33 for the 15-, 20-, and 25-foot blasthole spacings. For the 25-foot spacing pattern then the radius of damage, in charge radii, was at least 33. The larger damage zone at the Duval site was caused in part by a reinforcing effect, since three blastholes contributed to the damage. Since blastholes can be spaced at twice the radius of damage, the data in table 7 show that, based on radius of damage considerations, blasthole spacing can range between 28 and 110 times the charge radius. At the Duval site, breakage was considered adequate for the 25-foot pattern where the blastholes were spaced 66 times the charge radius. The final blasthole spacing selected will depend on such variables as the rock type, explosive type, ground water conditions, depth of burial, and desired degree of fragmentation.
Summary
The broken surface material at the Sierrita test site was well fragmented. The size distribution studies of the surface material showed that the greatest number of fragments were in the 2- to 3-inch size range, and the vast majority of fragments were less than 11 inches long. These size characteristics are similar to the cores from preshot holes 1, 2, and 3, suggesting that few new fractures were developed and that the surface rubble zone was created by the opening up of old fractures. Blast-induced fractures on the surface and outside of the rubble zone had three preferred orientations, of which one was controlled by the geologic structure, and the other two were interpreted to be caused by blast-induced doming of the rock mass.
Figure 8 shows the elevation changes produced by the blast. The greatest changes were caused by rubble material being piled up about 50 feet to the northeast of the center of the blast. Three factors probably contributed to this irregular muck pile distribution: (1) The pattern changes from 25- to 15-foot bias thole spacing toward the northeast; (2) the blast was initiated in the southwest and the delay sequence proceeded to the northeast; and (3) the surface fell off in the northeast direction. The surface rise over the blast averaged about 5 feet and the total volume increase produced by the blast was 5,100 cu yd. A swell factor, defined as the final volume divided by the original volume, was difficult to determine because of uncertainty over what areas to use for these volumes. Assuming an overbreak region of 12.5 feet around each blasthole, an original volume of 16,800 cu yd was calculated and the resulting swell factor was 1.30.
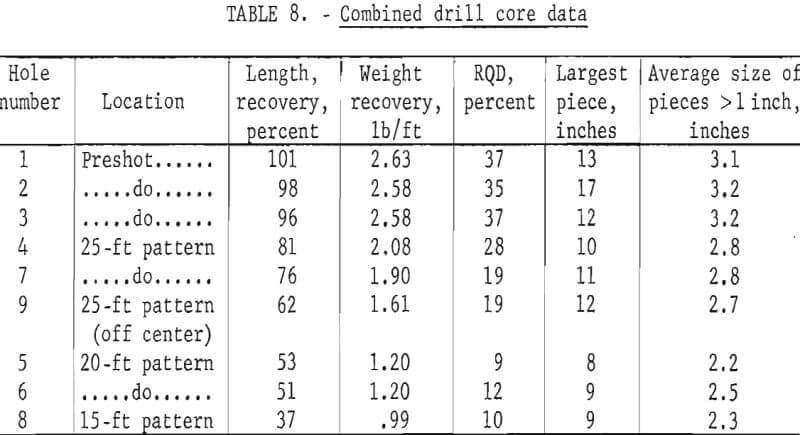
Table 8 lists the location, length core recovery, weight core recovery, RQD, largest piece, and the average size of pieces larger than 1 inch for nine diamond drill cores. Length core recovery and weight core recovery were measured after the core was returned to the laboratory. Although there is a good correlation between length and weight recovery, the weight core recovery was considered the most accurate method. Some anomalies in the length data could be attributed to problems in shipping.
The RQD is the total length of all pieces larger than 4 inches divided by the core run and is expressed as a percent. Rock quality is considered “very poor” for 0 <RQD< 25 and “poor” for 25 < RQD < 50. Rock in the test area was originally classified as poor and the blast changed the quality to very poor.
The largest piece of drill core averaged 14 inches for preshot holes, 11 inches for the 25-foot pattern, 8.5 inches for the 20-foot pattern, and 9 inches for the 15-foot pattern. The average size of core pieces 1 inch or larger was determined by dividing the total length of all pieces larger than 1 inch by the number of pieces greater than 1 inch. This average size was about 3.2 inches for preshot core and between 2.2 and 2.8 inches for the postshot core.
When compared with the successful fragmentation results obtained by Ranchers in their blasts at the Old Reliable and Big Mike mines, the drill core data listed in table 8 support the conclusions that all three blasthole spacing patterns produced adequate fragmentation for leaching. For this test, the average fragment size was less than the average 9-inch-in-diameter fragments obtained at the Big Mike mine and within the 9-inch or less range at the Old Reliable mine. However, factors other than fragmentation, such as permeability and copper mineralization, affect the leaching process and the final copper recovery. A complete evaluation of this experiment would require in situ leaching tests.
The combined drill core data listed in table 8 also show that the 20-foot pattern produced better breakage than the 25-foot pattern; the 15-foot pattern produced better breakage than the 20-foot pattern; and fragmentation improved away from the center of the equilateral triangle patterns.
Data for length recovery, weight recovery, RQD, and the average size of pieces larger than 1 inch (see appendix at the end of this report and figs. 15-17, and 19) show that the fragmentation is not as good in the stemming region, 0 to 60 feet, as it is in the blasted zone, 60 to 110 feet, and that breakage does not extend deeper than the 110-foot blasthole depth. In the stemming region the logs also show a doming effect with best breakage in the center of the blast.
Conclusions
A blasting experiment was conducted in a porphyry copper deposit to determine blasthole spacings that could be used effectively to fragment ore for in situ leaching. Blastholes 9 inches in diameter and 110 feet deep were arranged in a pattern so that blasthole spacings of 15, 20, and 25 feet could be tested. The 20- and 25-foot blasthole spacings were wider and the corresponding powder factors, 0.64 and 0.41 lb/ton, were lower than those previously used to prepare ore for in situ leaching. Preshot and postshot drill core were compared to determine the effects of the blast.
All of the methods used to compare the preshot and postshot drill core (for example, length recovery, RQD, weight recovery, and size distribution) indicate that there was relatively more fragmentation in the 15-foot blasthole spacing than in the 20-foot blasthole spacing, and more fragmentation in the 20-foot blasthole spacing than in the 25-foot blasthole spacing. These methods were useful in determining the location and extent of blast damage. This test was conducted in a highly fractured and weathered material. Application of powder factor, spacings, and results to a hypogene porphyry copper deposit composed of unweathered and, in part, blocky rock may be invalid. Therefore, for the conditions under which this study was conducted, and based on fragmentation considerations only, even the 25 foot spacing pattern with a powder factor of 0.41 lb/ton produced adequate breakage for in situ leaching.
Actual in situ leaching of the test site would have been a desirable check for the adequacy of fragmentation. Although such leaching tests could not be run at the Sierrita test site, they are planned for future Bureau of Mines experiments.