Table of Contents
Costs of boring holes in rock have always been a major item in mineral exploration, development, and extraction and in rock excavation in industries other than mining. Efforts to reduce the costs have been made by the drilling industry for many years.
Rock drillability studies were started at the Twin Cities Mining Research Center in 1960 and were directed toward a better understanding of the role of rock properties and basic drill variables in the drilling process. To facilitate our work the drilling systems were broken down into rotary (diamond), percussive, and rotary-percussive systems. All of the findings herein presented apply to diamond drilling. To assure common terminology, we define drillability as a real or relative rate of penetration in a specific rock by a specific drilling system; a drillability index may be defined as a mechanism for estimating performance of drilling systems in different types of rock.
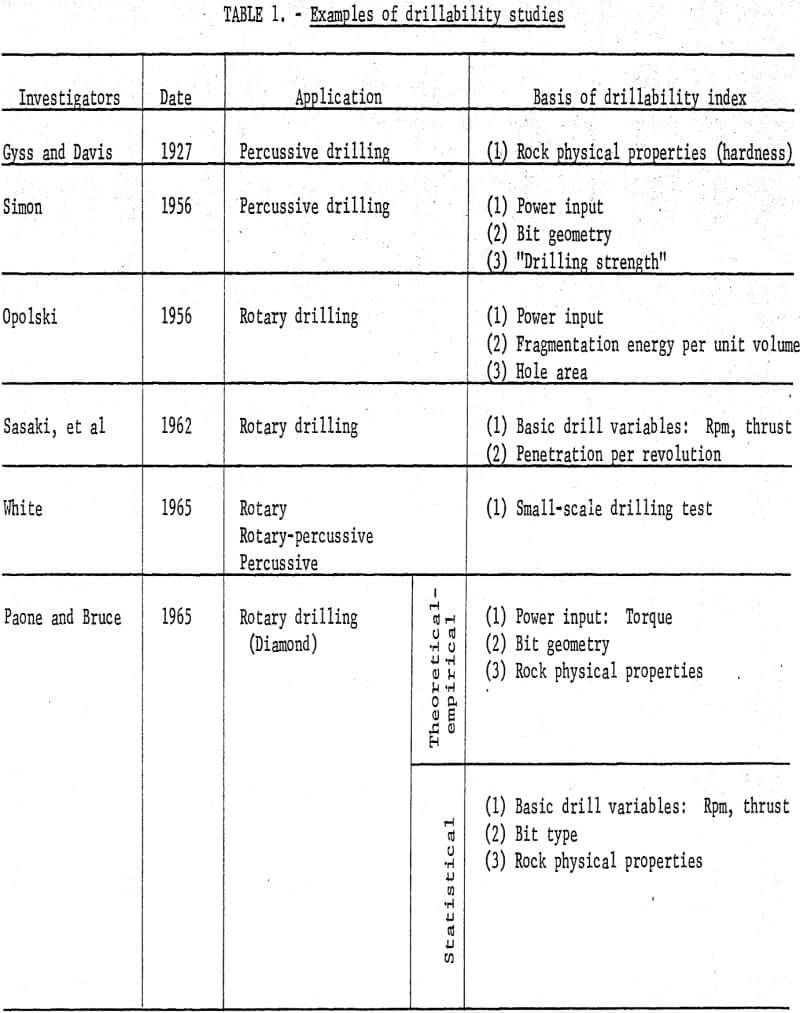
A thorough study of previous investigations clearly indicated that drillability studies are not new and that many, competent investigators had attacked the problem. In fact, one of the earliest reports on drillability and blastability was presented at an AIME meeting in New York in 1927. The paper, by Gyss and Davis related drilling rates or drillability to rock hardness based on Moh’s scale. Since the Gyss and Davis paper, several researchers have published their findings which are described in Bureau of Mines Report of Investigations 6324. Typical examples of drillability studies that have been undertaken in the past 38 years are shown in table 1.
A concept advanced by Simon for percussive drilling is based on power input, bit diameter, and so-called “drilling strength” of rock. A drillability index used by Opolski is based on power input, fragmentation energy per unit volume, and on hole geometry. Sasaki has developed a system relating penetration rate to penetration per revolution and the basic drilling variables, thrust, and rpm. White proposes a small-scale drilling test encompassing rotary, percussive, and rotary-percussive systems.
Rock drillability by a rotary diamond drill investigated by Paone and Bruce for the Bureau of Mines first considers drillability from a combined, theoretical and empirical standpoint which is based on power input, bit geometry, and measured physical properties of rocks and second utilizes a statistical method to define relationships between penetration per revolution and the independent variables of bit type, rock physical properties, rotational speed, and thrust.
Experimental Procedure
Diamond core drilling experiments were made in two phases. The earliest phase was laboratory drilling of eight different rocks at the Twin Cities Mining Research Center. The later phase, designed to extend the range of rocks drilled and to confirm laboratory findings, was field drilling performed on 26 different rocks in Michigan, Minnesota, and Wisconsin. The cores from both laboratory and field experiments were used in subsequent physical property testing.
Laboratory Drilling
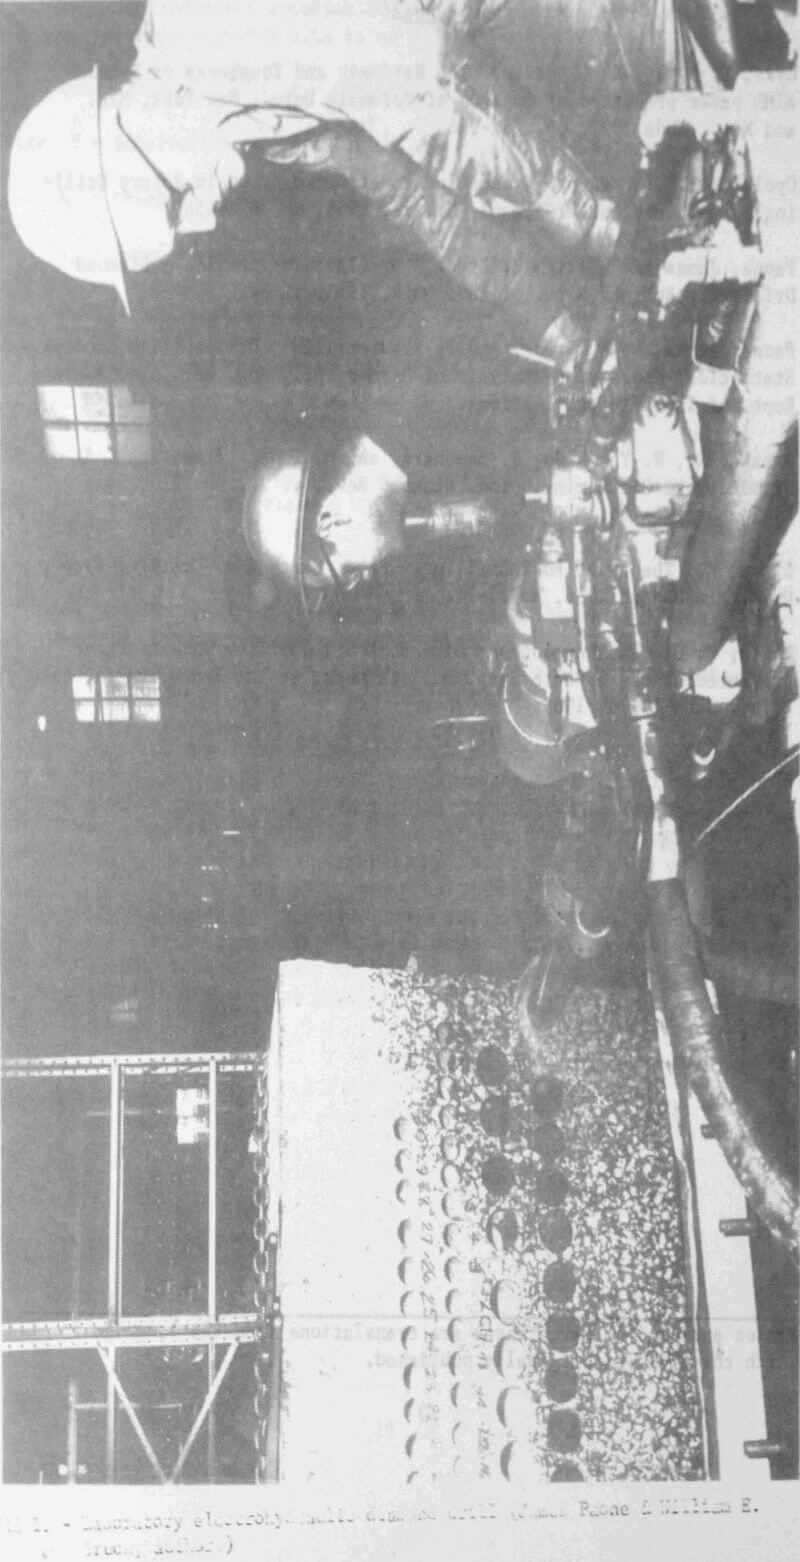
Controlled laboratory drilling experiments were performed on eight different mine or quarry-run rocks ranging from dense, hard taconite to comparatively soft limestone. The rocks, approximately cubical in shape and ranging from 2 to 4 feet on a side, were fastened in place on a supporting carriage. The rocks were then drilled with a Boyles Brother’s 40-horsepower electrohydraulic diamond drill (fig. 1).
Instrumentation on the drill included a tachometer, torque gage, and bourdon-type pressure gage calibrated to indicate pounds of thrust. Maximum output of the drill was about 1,300 rpm, 10,000 pounds thrust, and 100 ft-lbs torque.
Each rock block was drilled in the same manner under the same conditions of thrust and rotational speed. Waterflow was preset to the same volume for each rock drilled and was maintained essentially constant (5 gpm) during the experiments. Drilling, all horizontal, was done with surface-set and impregnated AX-size diamond bits. The surface-set bits each contained 328-332 stones totalling 10 carats; the impregnated bits each contained 27 carats of fragmented bortz.
To minimize wear on surface-set bits, a new bit was used for each level of rpm. This practice was not necessary with the impregnated type since preliminary work indicated that the penetration rate of impregnated bits is nearly independent of bit wear up to the point where the diamond-impregnated matrix is totally worn away. Old bits were always used to collar holes to prevent unnecessary wear on the new bit. Upon completion of collaring, the old bit was removed, and a drilling test with a new bit was begun.
The first surface-set bit was run at 500 rpm, the second at 700 rpm, the third at 900 rpm, and the fourth at 1,100 rpm. At each level of rotational speed the thrust was held constant, first at 1,000 and then at 2,000 pounds.
Drill rotational speed and thrust and waterflow were held constant while torque, time, and distance drilled were recorded. Penetration per revolution was computed by dividing the penetration rate by the number of revolutions in 1 minute.
Field Drilling
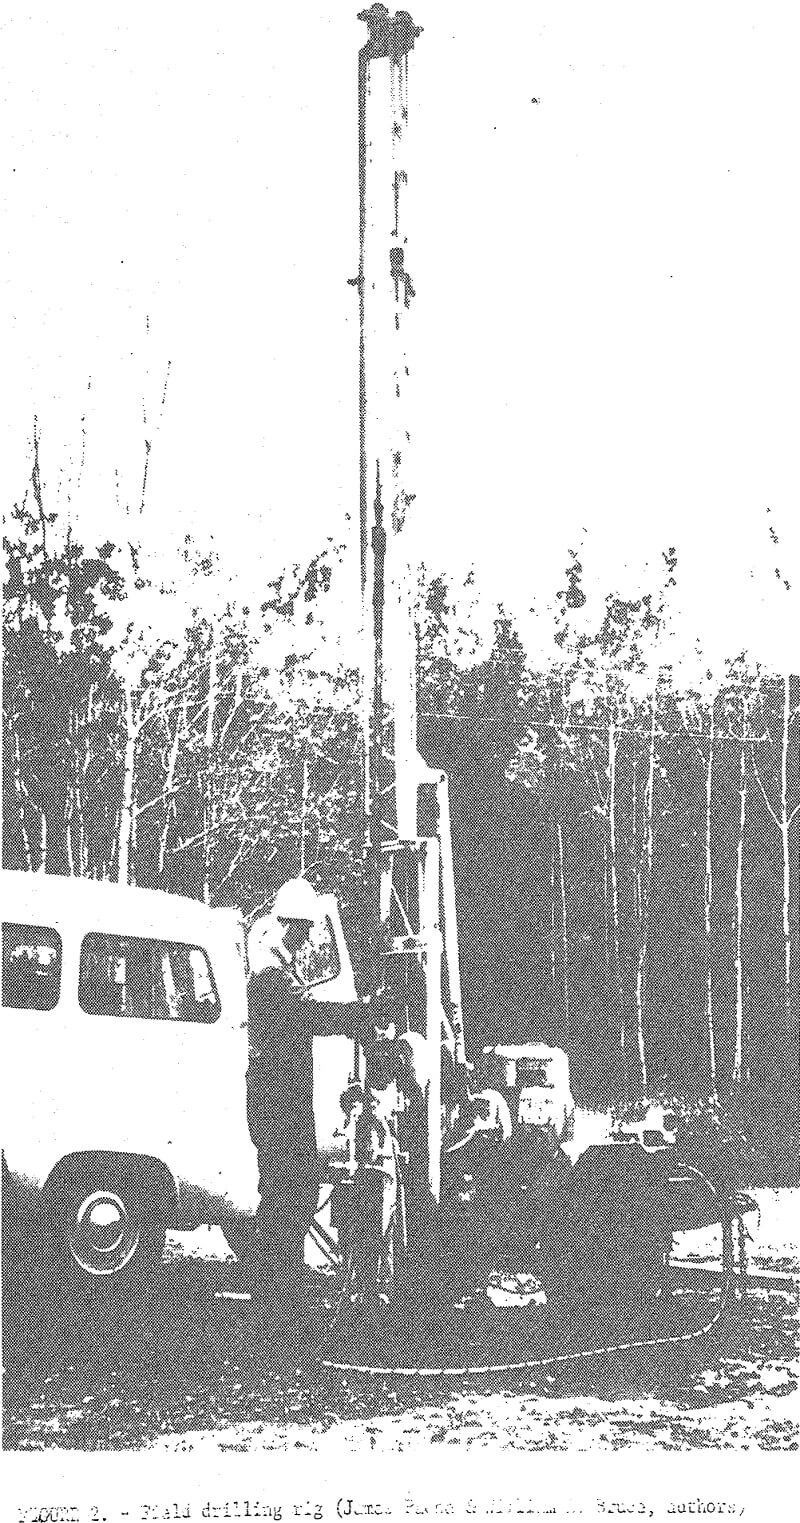
Field drilling experiments were performed in various upper midwestern mines and quarries using a trailer-mounted Longyear Model 24 diamond drill (fig. 2). Drilling depths in most of the 26 different rock types were less than 20 feet.
Bits used in the field were surface-set and impregnated type, the same as those used in laboratory drilling experiments. Drilling thrust was indicated by a bourdon-type gage calibrated in pounds of force. A magnetic pickup coupled to a digital counter measured the rotational speed of the drill chuck. Flushing pressure was indicated by a gage on the pump discharge; the flushing volume was fixed at 2.5 gpm.
In each of the 26 rocks, penetration rate measurements were made at all combinations of 1,000 and 2000 pounds thrust and 600, 1,100 and 1,600 rpm. In some locations difficulties were experienced due to the highly fractured rock encountered in the shallow holes as a result of previous blasting operations.
Results and Discussion
Laboratory Experiments
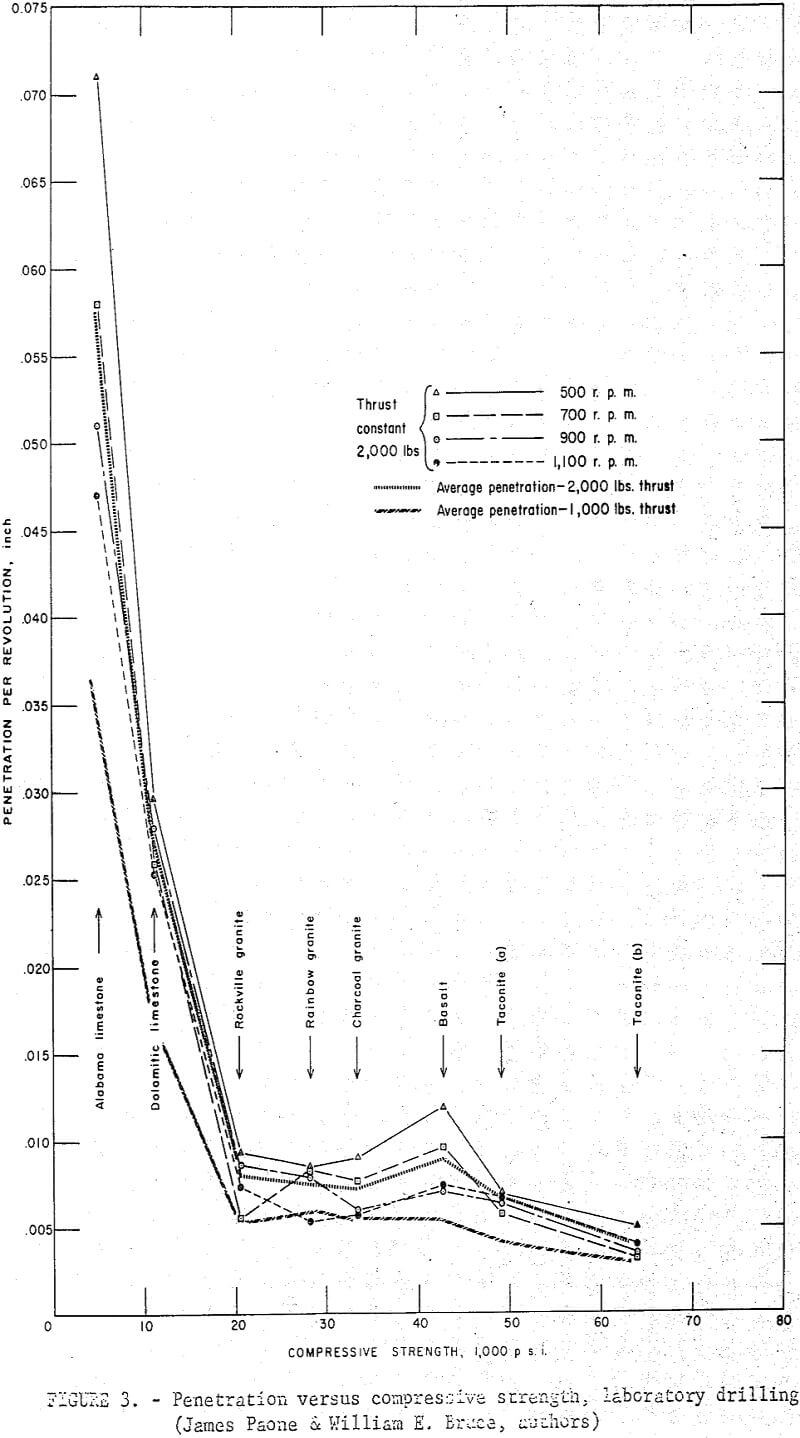
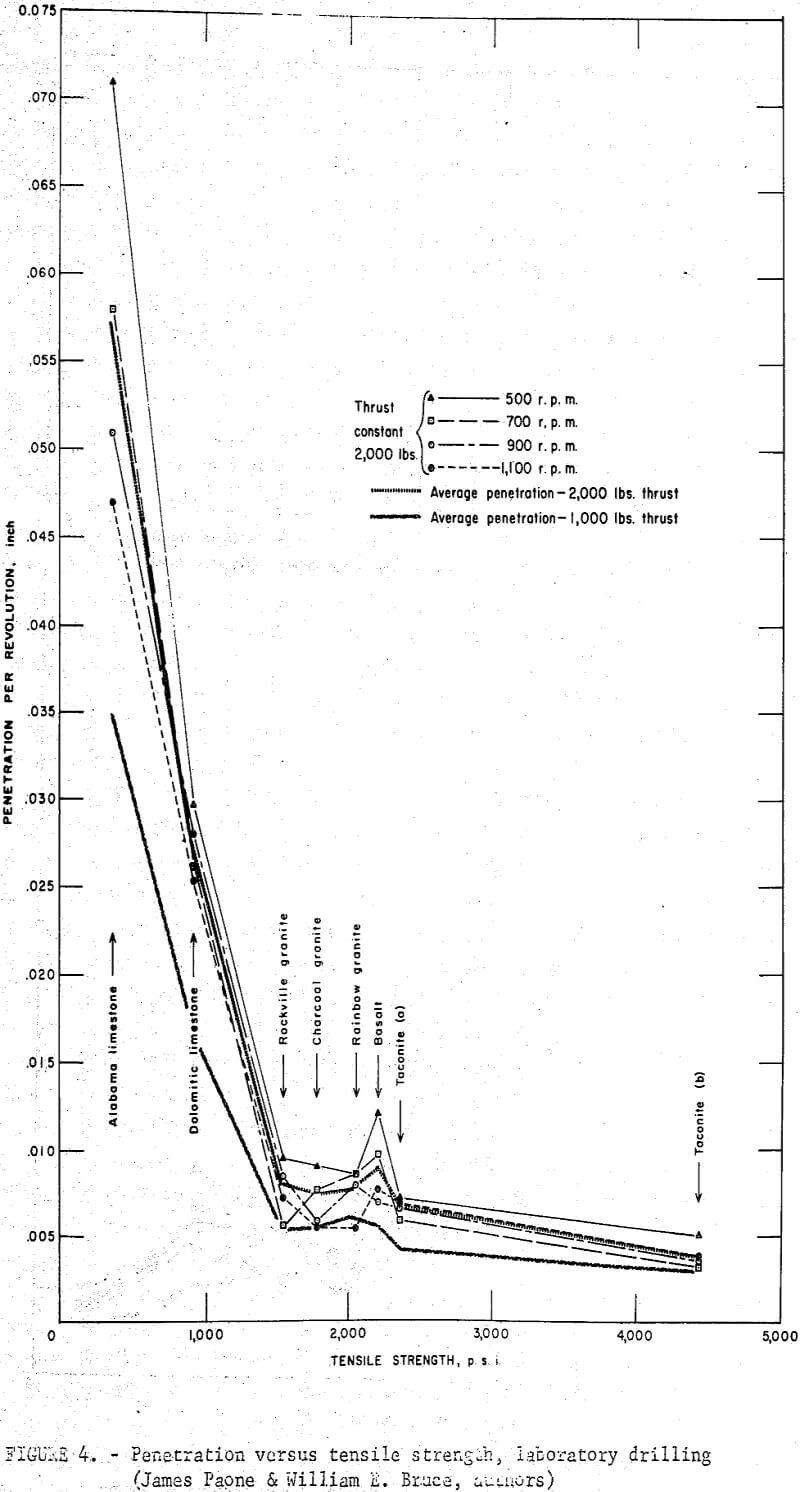
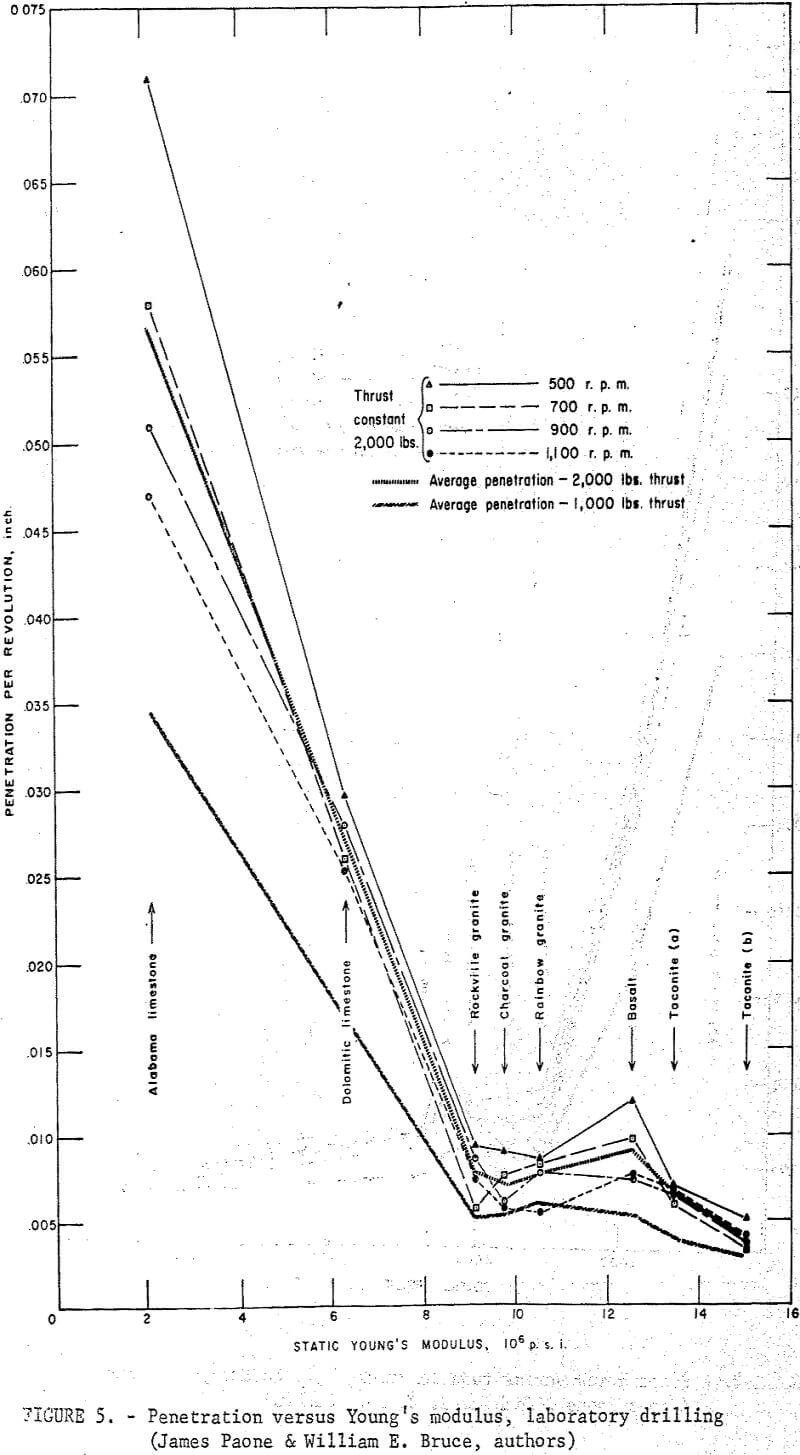
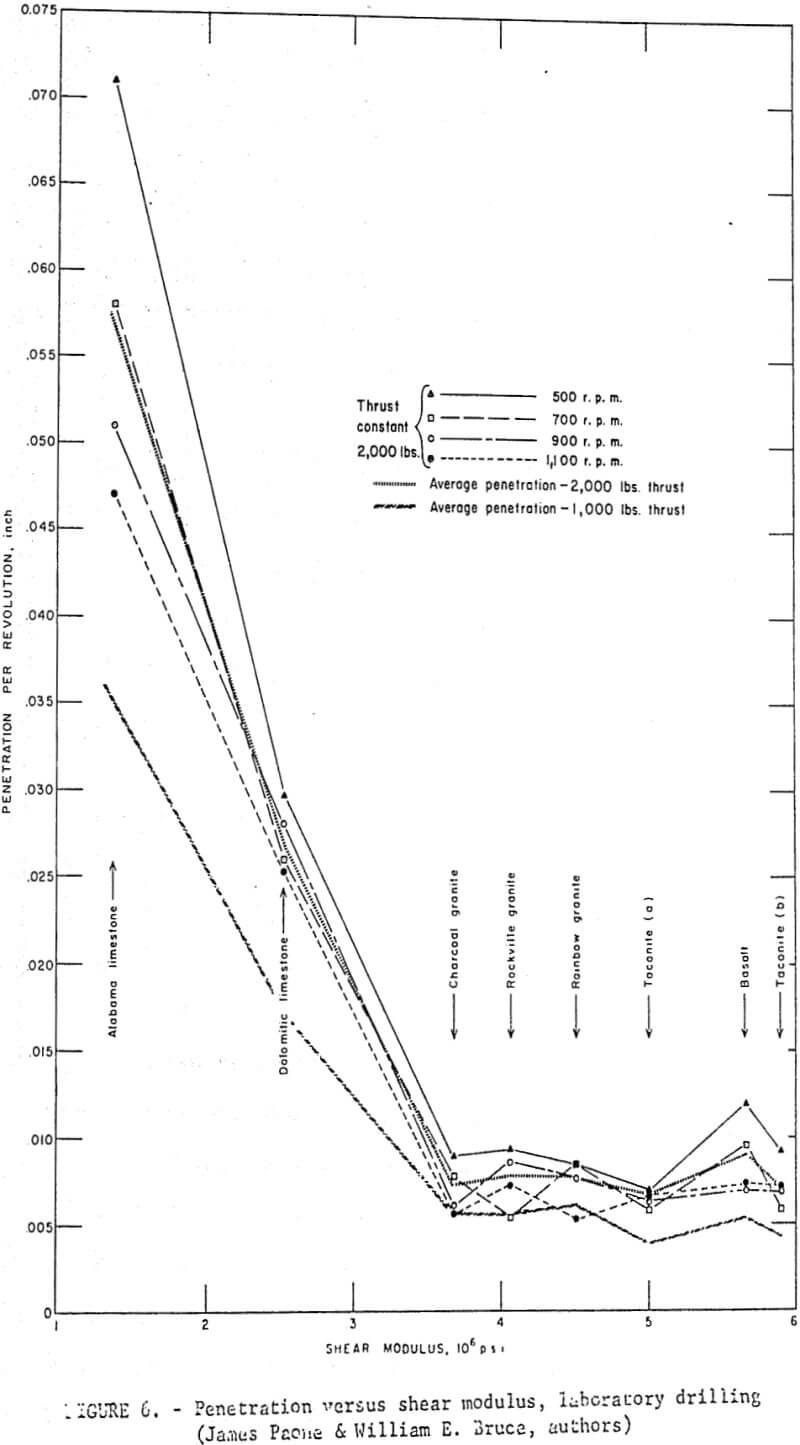
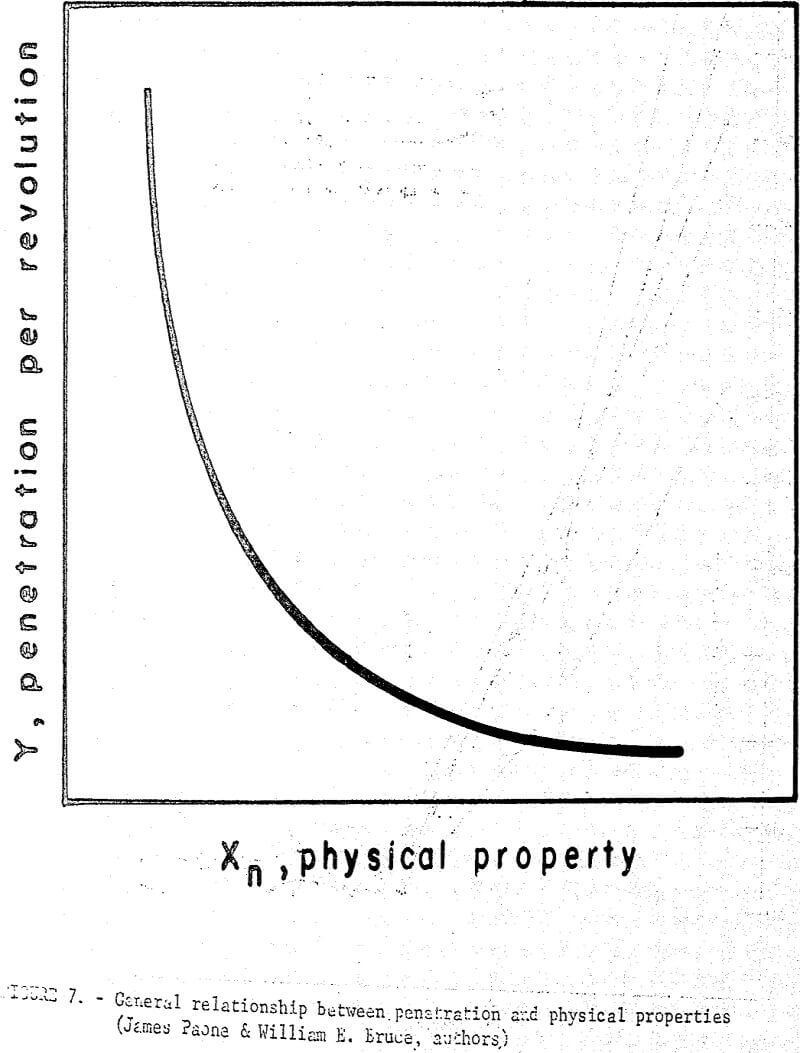
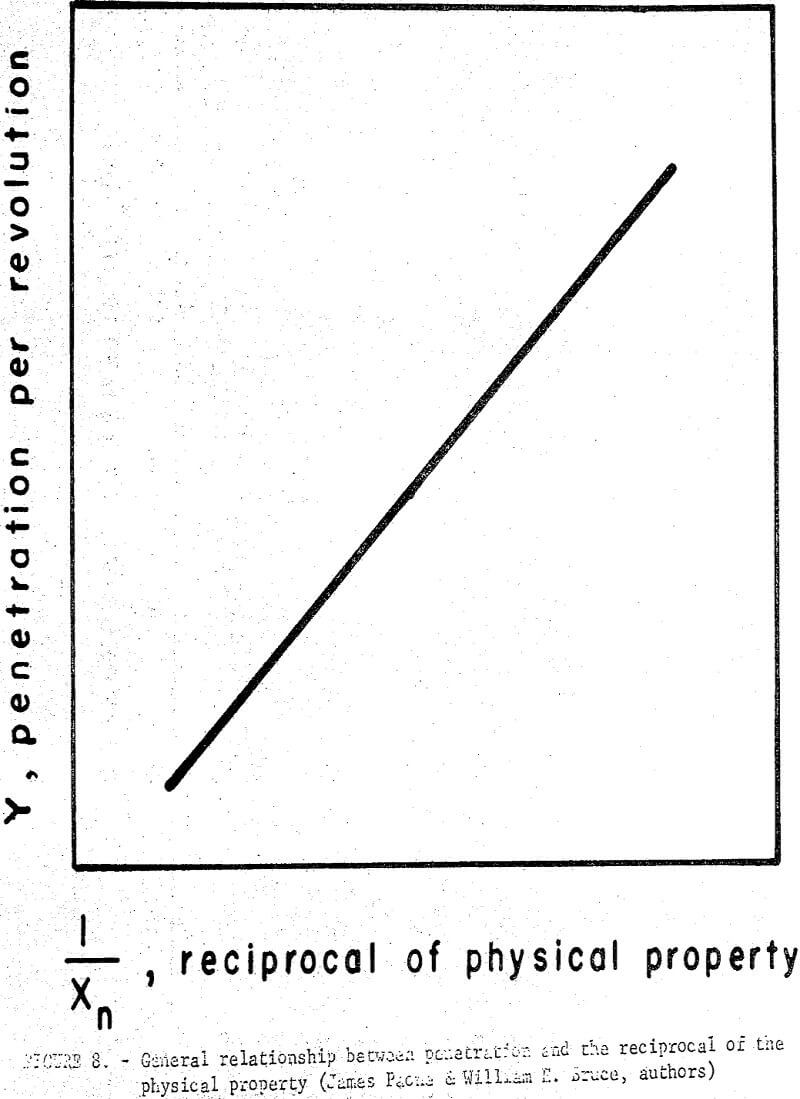
Data from laboratory drilling experiments and specific physical property measurements were analyzed and plotted as shown in figures 3, 4, 5, and 6. The results based on eight rocks indicate that in general penetration rate decreases as the numerical value of the physical properties of the rock increases. The general relation between penetration per revolution and each physical property is curvilinear as shown in figure 7. The relation between penetration per revolution and the reciprocal of the physical property is, however, approximately linear as shown in figure 8.
The general form of the experimental data curve approximates a hyberbola of the general form:
δ = C1/X + C2……………………………………………….(1)
where C1 and C2 are constants and X is the independent variable.
Derivation of an equation which would agree with the form of equation (1) and with data from laboratory drilling was achieved as follows:
Let σc = compressive strength of rock drilled, psi
S = drilling strength of rock, psi
T = applied torque, lb-in
Fv = thrust, lbs
A = cross-sectional area of bit, in²
δ = penetration per revolution, in
Ft = tangential force at the bit face, lb
r = effective bit radius, in
Do = outside diameter of core bit, in
Di = inside diameter of core bit, in
and S = f (σc)……………………………………………………(2)
T = Ftr…………………………………………………………….(3)
A = π/4 (D²o – D²i)………………………………………….(4)
It follows that if work is done by the.tangential force, then work done per revolution, W1 is:
W1 = 2πrFt…………………………………………………..(5)
Work done per revolution by the thrust is W2
W2 = Fvδ…………………………………………………..(6)
Work due to rock resistance force per revolution is W3 .
W3 = SAδ…………………………………………………(7)
Total work per revolution done in drilling rock W3 is:
W3 = W1 + W2………………………………………………(8)
or substituting
SAδ = 2πrFt + Fvδ = 2πT + Fvδ……………………………(9)
and δ (SA – Fv) = 2πT………………………………………….(10)
or δ = 2πT/SA – Fv……………………………………………(11)
Equation (11) is one form of the desired, simple prediction equation. Analysis of the laboratory drilling data indicated that it was possible to determine an approximate relationship between S and σc shown below:
S ≈ 10σc…………………………………………………………….(12)
It follows that:
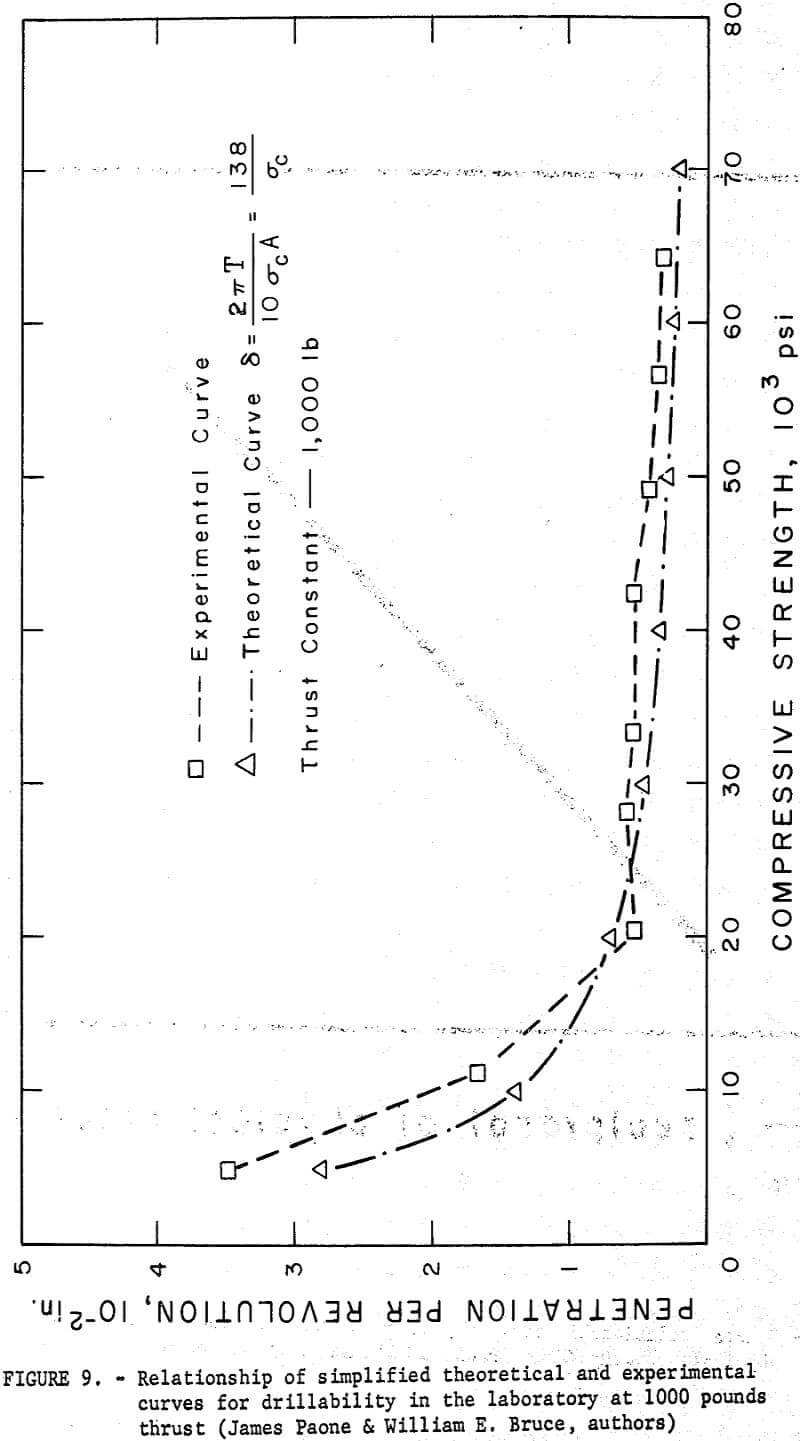
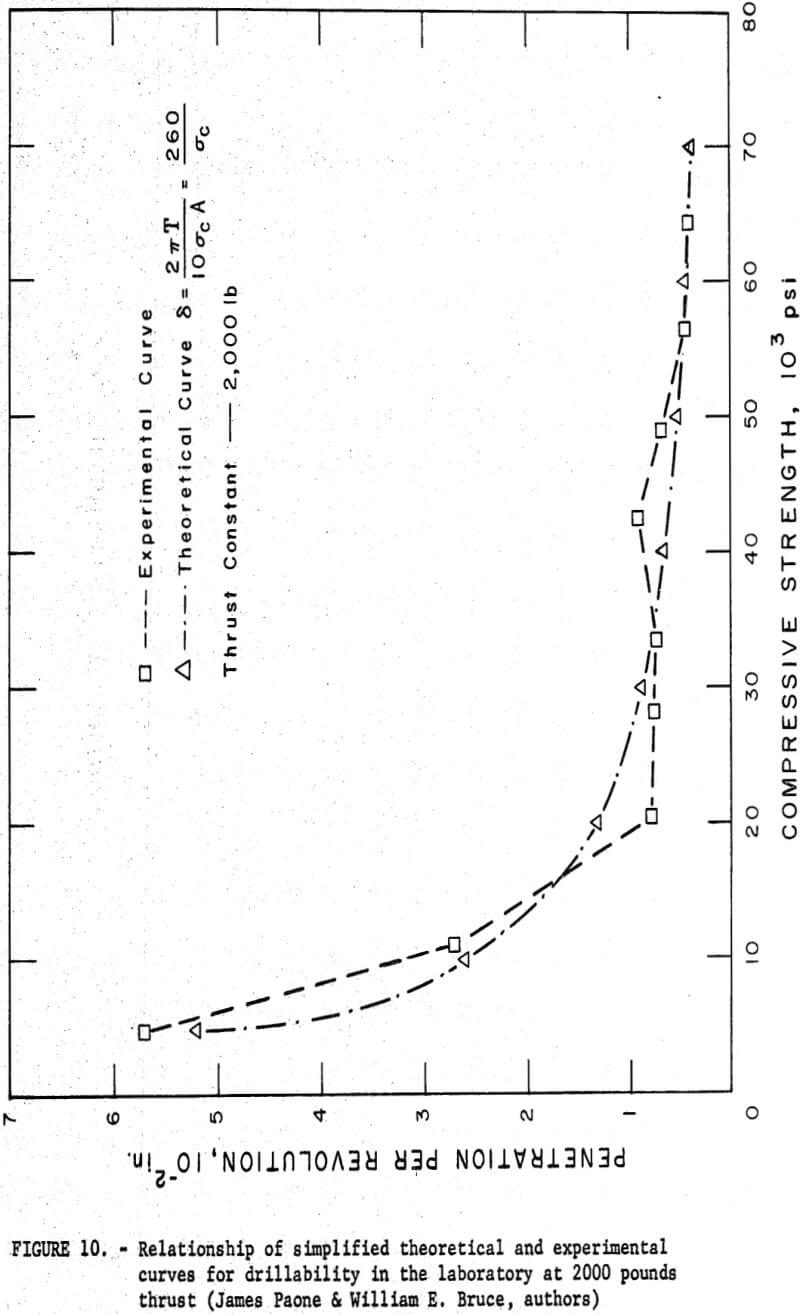
δ = 2πT/10σcA – Fv……………………………………………(13)
Equation (13) is another form of the simple prediction equation. From equation (13) it can be seen that Fv used, in both laboratory and field experiments, which was only 1,000 or 2,000 pounds of bit force, is insignificant in comparison with 10σcA and can be dropped for these thrust conditions without introducing significant error (providing that A remains of the same order of magnitude as used in these experiments. This leads to the final version of the simplified theoretical equation:

The plot of equation (14) is shown in figures 9 and 10 with its relationship to the experimental data from laboratory drilling. Another rock, quartzite, was added to figures 9 and 10 that does not appear on figures 3-6. This rock was not available when the previous graphs of laboratory drilling were plotted.
Field Experiments
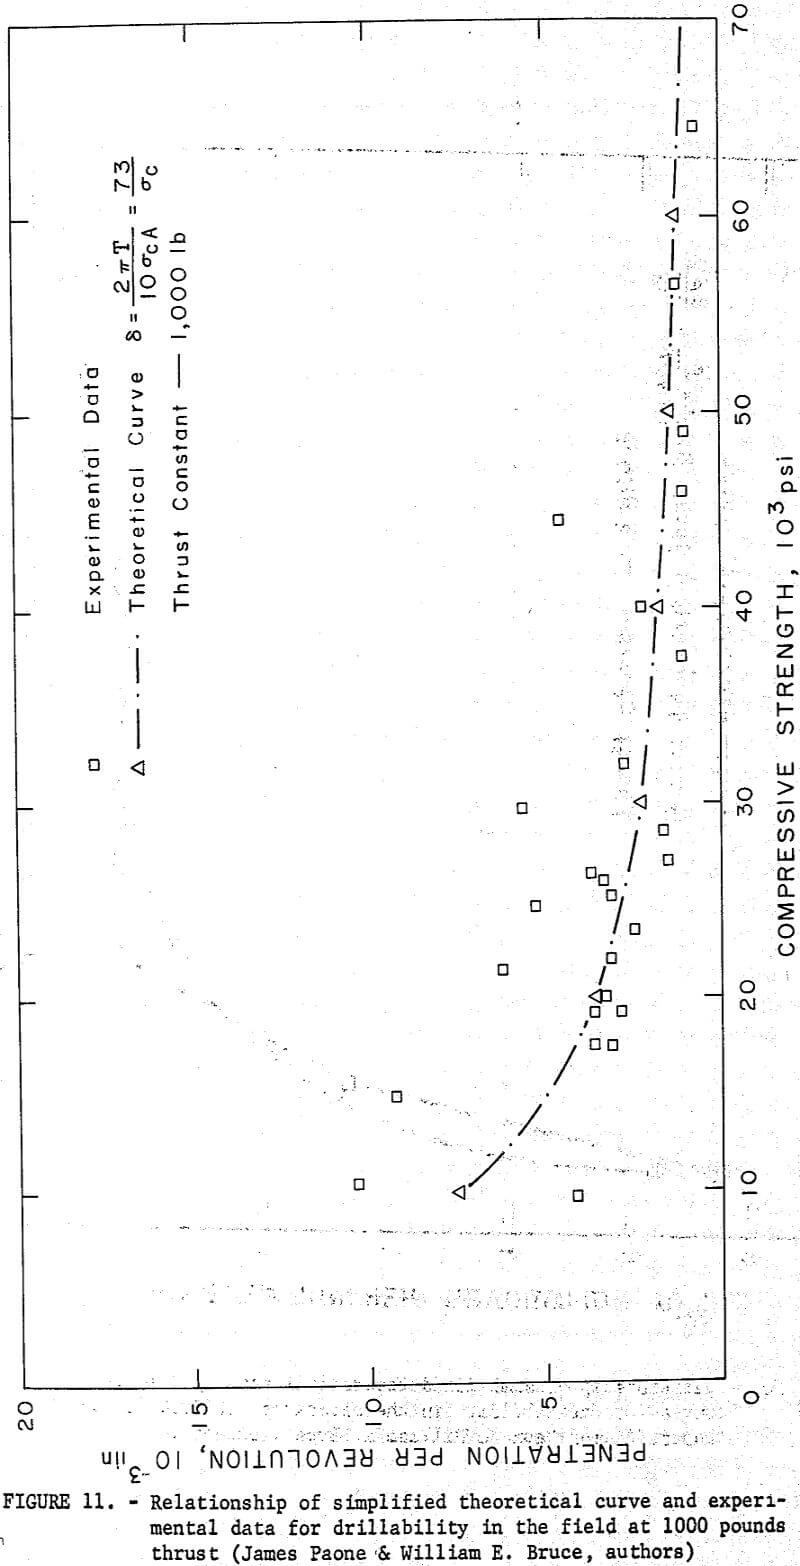
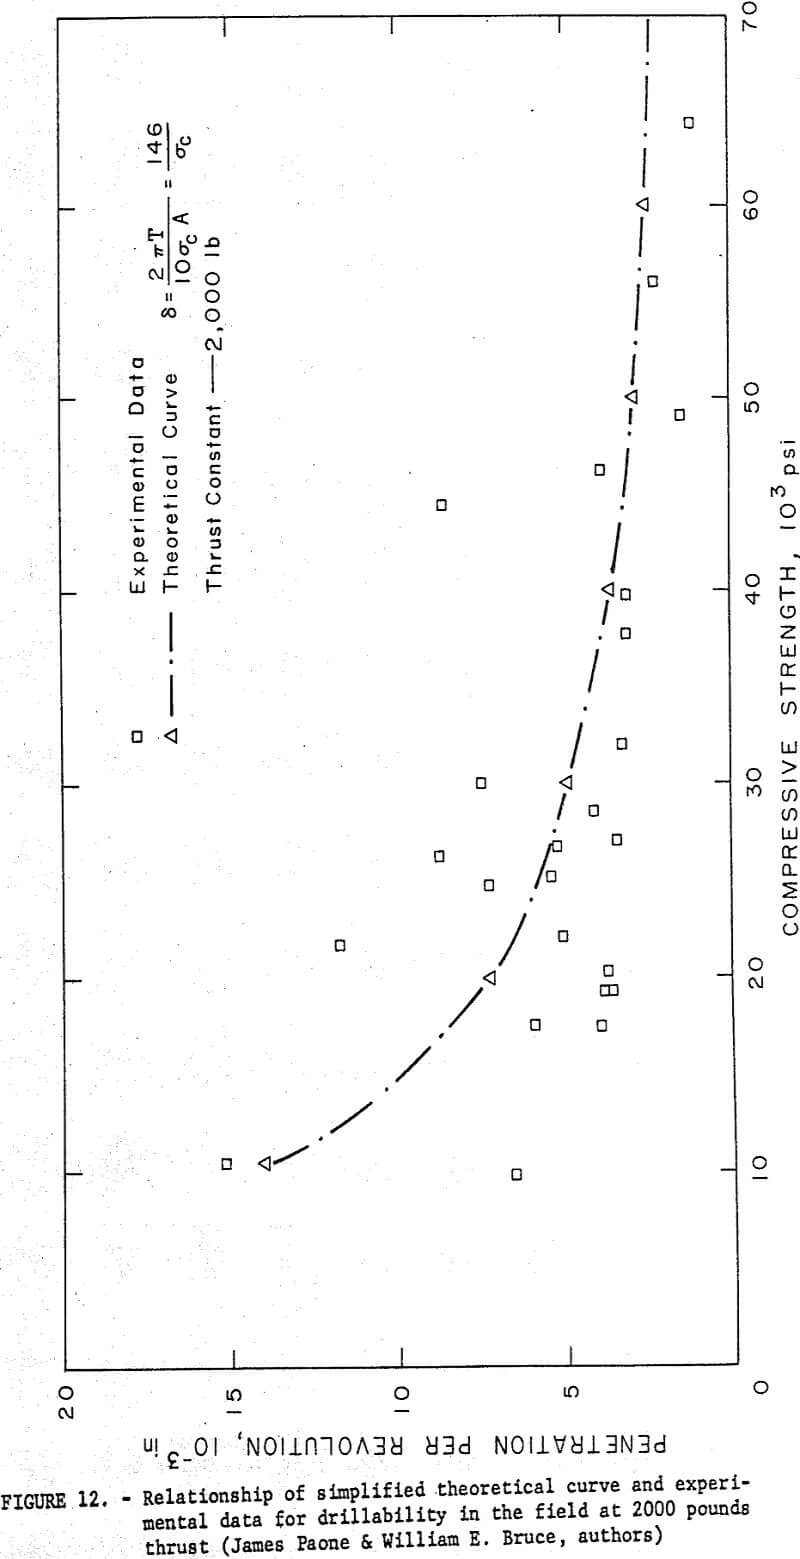
Data from 26 different rocks drilled in the field were analyzed to observe the relationship between penetration per revolution and compressive strength. Results from field drilling at 1,000 and 2,000 pounds thrust were substituted in the simplified theoretical equation. The curve of the simplified equation is shown together with the results of the experimental data in figures 11 and 12.
Although field data show a trend similar to that observed for laboratory data, it can be seen that the field data show greater spread than the laboratory data from the theoretical curve. This indicates that for the field drilling it may be necessary to add corrective factors to the simplified theoretical equation to compensate for the many in situ factors that are causing the spread. Continuing research on this phase of the problem is under study at the Center.
The data utilized in this report were collected from relatively shallow holes in laboratory and field drilling experiments, and bit wear was minimized. Operations were limited to thrusts less than or equal to 2,000 pounds and to rotational speeds of less than or equal to 1,600 rpm. Possible applications of the shown prediction equations to actual drilling situations should be made within the same ranges of thrusts, speeds, and for the same bit types used in these drilling experiments. Use of the equation beyond the drilling ranges used in our experiments would require modifications of the simplified version that would take into account the additional variables.
A Statistical Technique to Study Drillability
A study was made to determine the feasibility of predicting drillability analytically by using statistical regression analysis techniques. This approach, which was independent of the simplified theoretical equation, considered the most important variables in the drilling process including bit type, thrust, rpm, and physical properties of the rock drilled. A model equation was set up to apply to data from laboratory or field drilling for two bit types surface-set and impregnated, as follows:
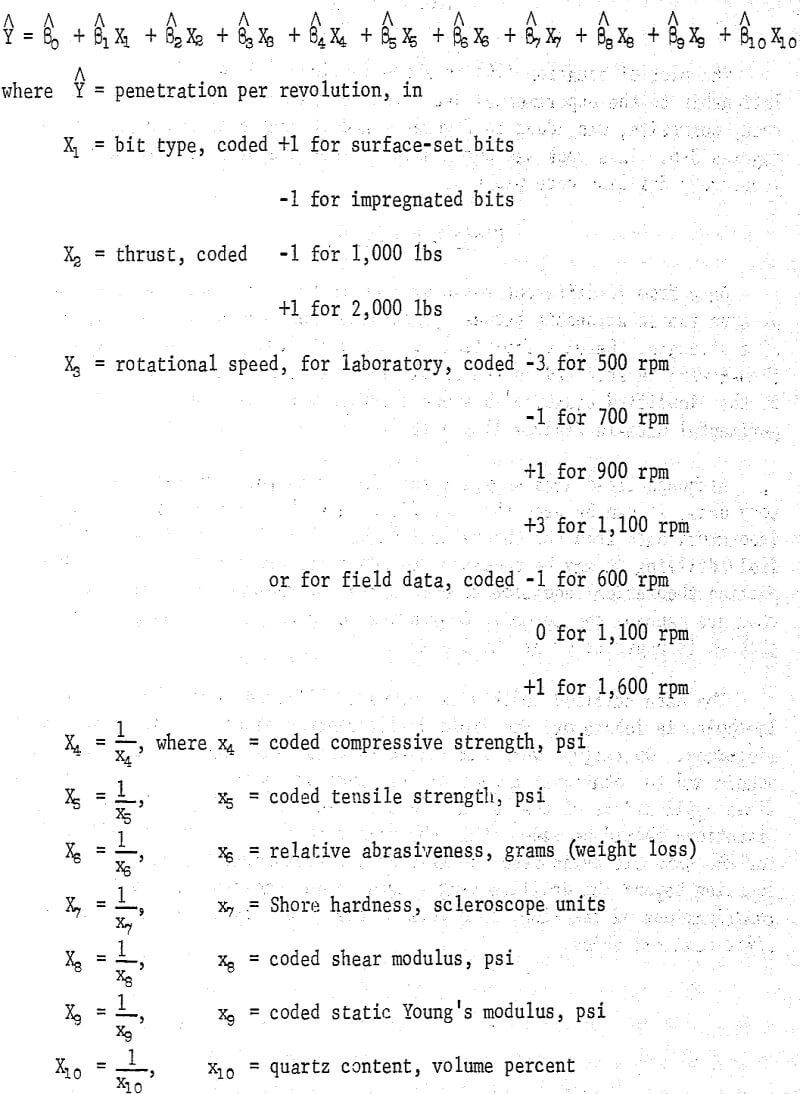
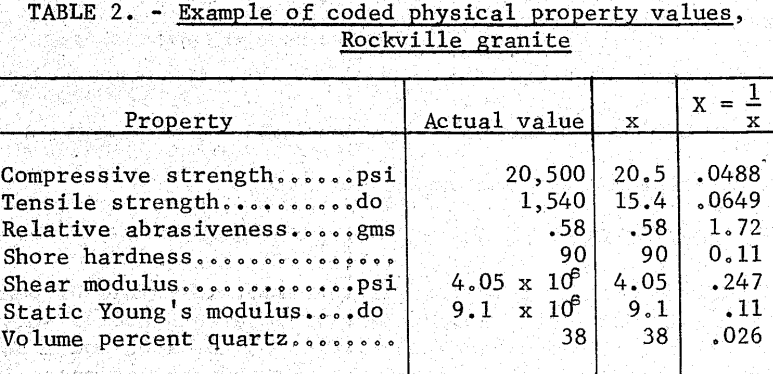
The betas are the desired regression coefficients and were determined by computer analysis. Coding of physical properties is illustrated in table 2.
Another model was set up to apply to data from laboratory or field drilling for a single bit type either surface-set or impregnated. The model and coding are the same as in the previous model except that the bit-type term is deleted.
Prediction equations were computed using a statistical technique known as stepwise multiple linear regression analysis. Application of this method to different groupings of data permitted development of a series of different prediction equations. A set of six equations was computed; three for laboratory data and three for field drilling data. One of each group of three equations was for surface-set bits, a second equation was for impregnated bits, and the third was for either surface-set or impregnated bits.
The regression analysis was performed on a GE-225 computer at the Denver Mining Research Center of the Bureau of Mines. The computer output was subjected to statistical F-testing and t-testing to help determine the six best prediction equations. The output information included simple correlation coefficients, the standard error of the estimate, the regression equation coefficients, the standard error of each coefficient, and the computed t-value for each coefficient.
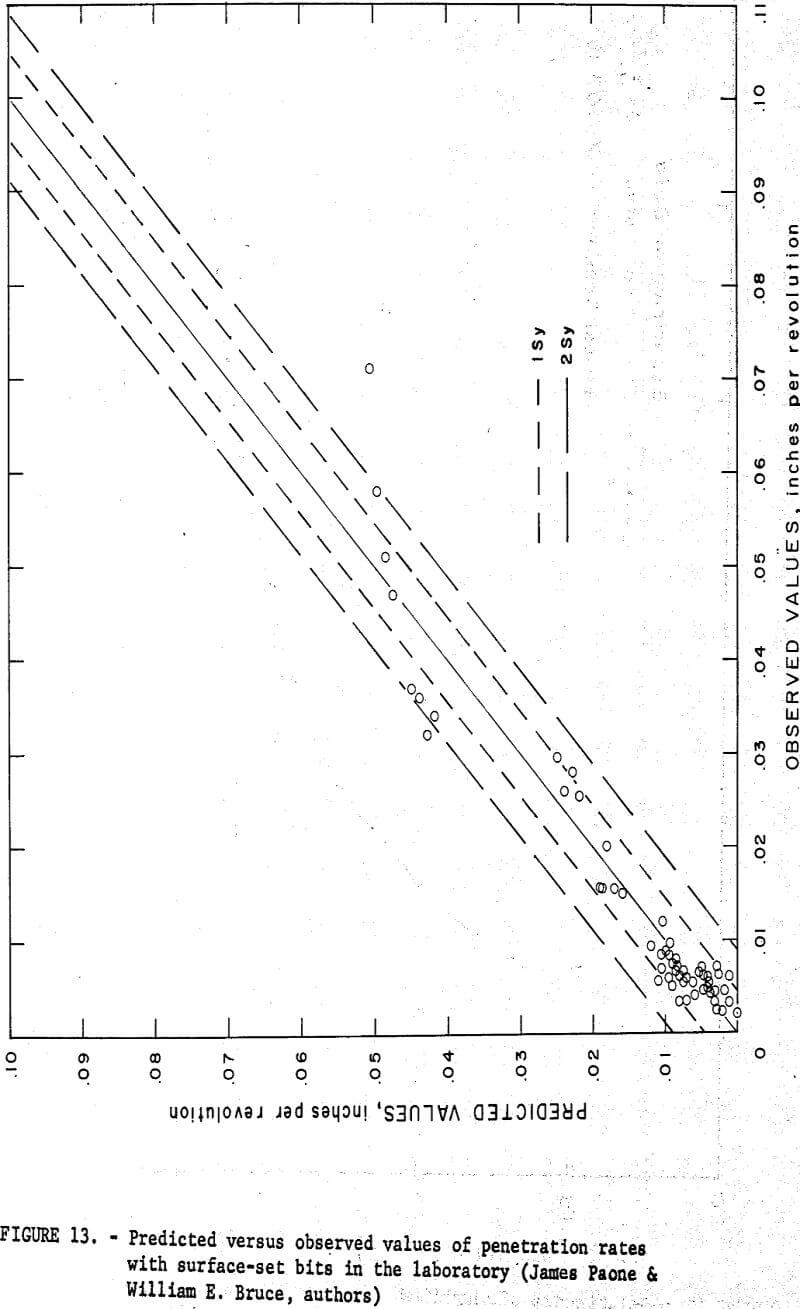
The best prediction equation for laboratory diamond drilling with surface-set bits is as follows:
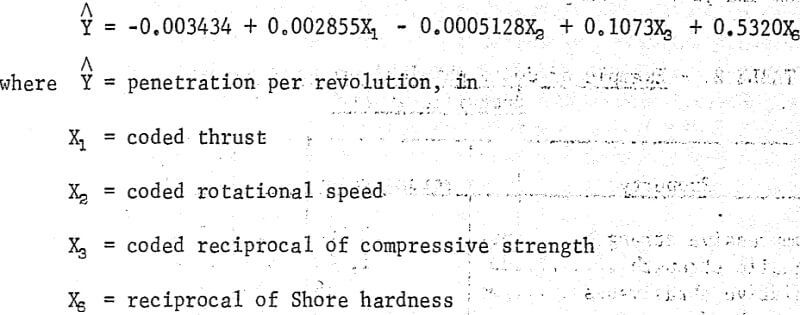
Figure 13 shows a plot of predicted versus observed values of penetration rates for this equation. Approximately 68 percent and 95 percent of the data should be included between the bounds of the 1 Sy and 2 Sy lines, respectively, where Sy is the standard error of the estimate.
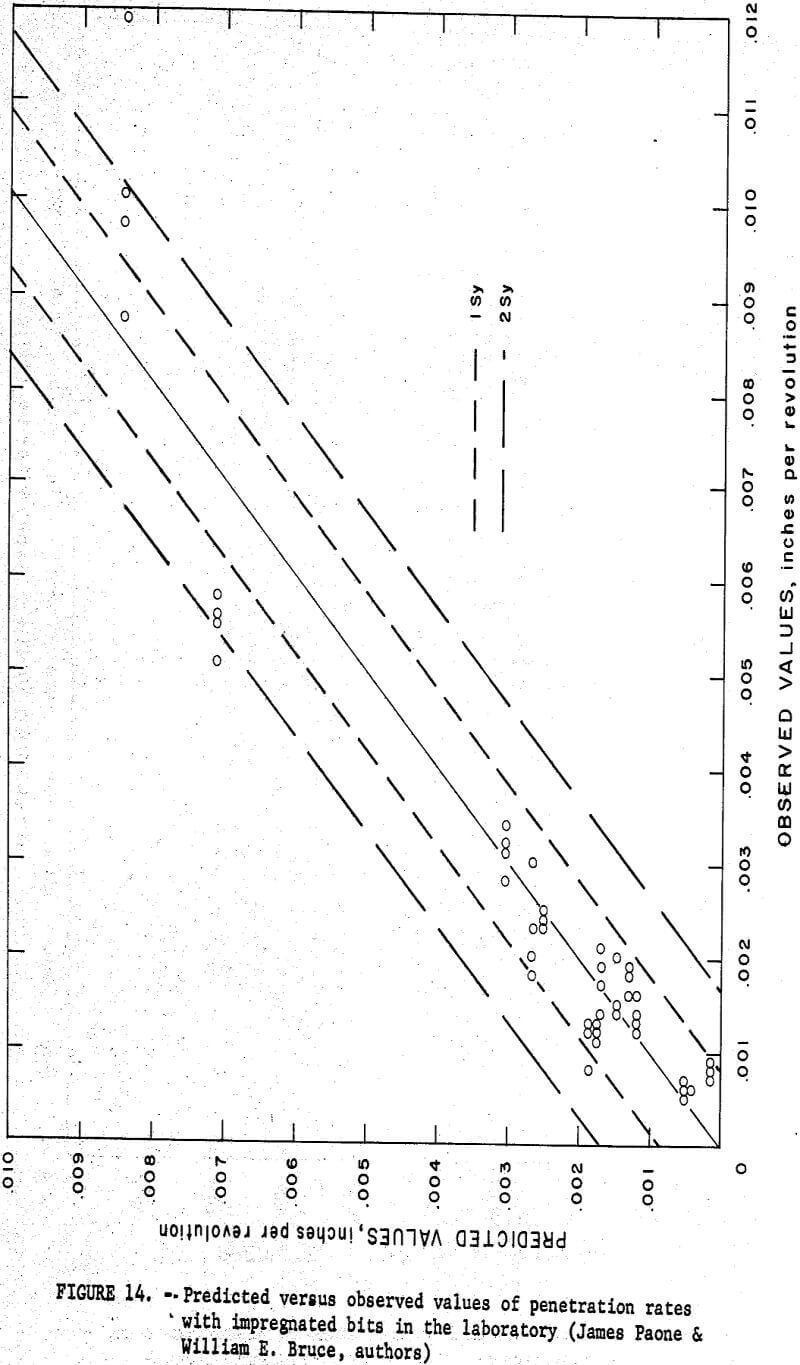
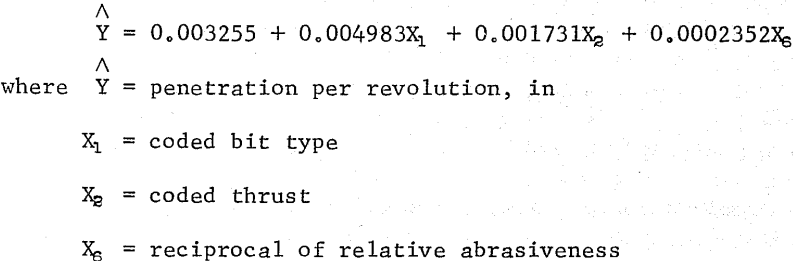
The best prediction equation for laboratory diamond drilling with impregnated diamond bits is as follows:
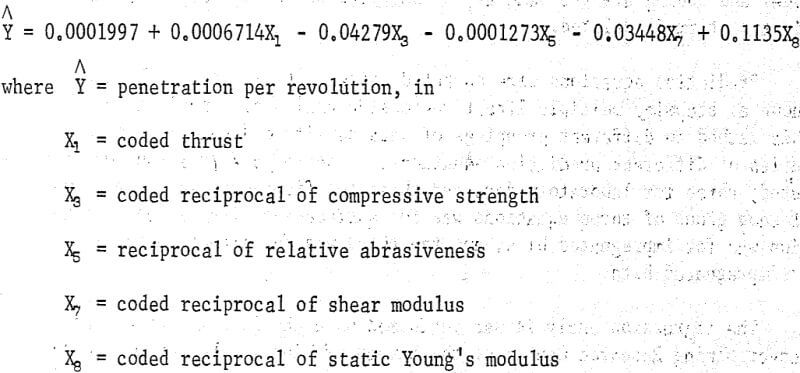
Figure 14 shows a plot of the predicted versus observed values of penetration rates for this equation.
The best prediction equation for laboratory diamond drilling with either surface-set or impregnated bits is as follows:
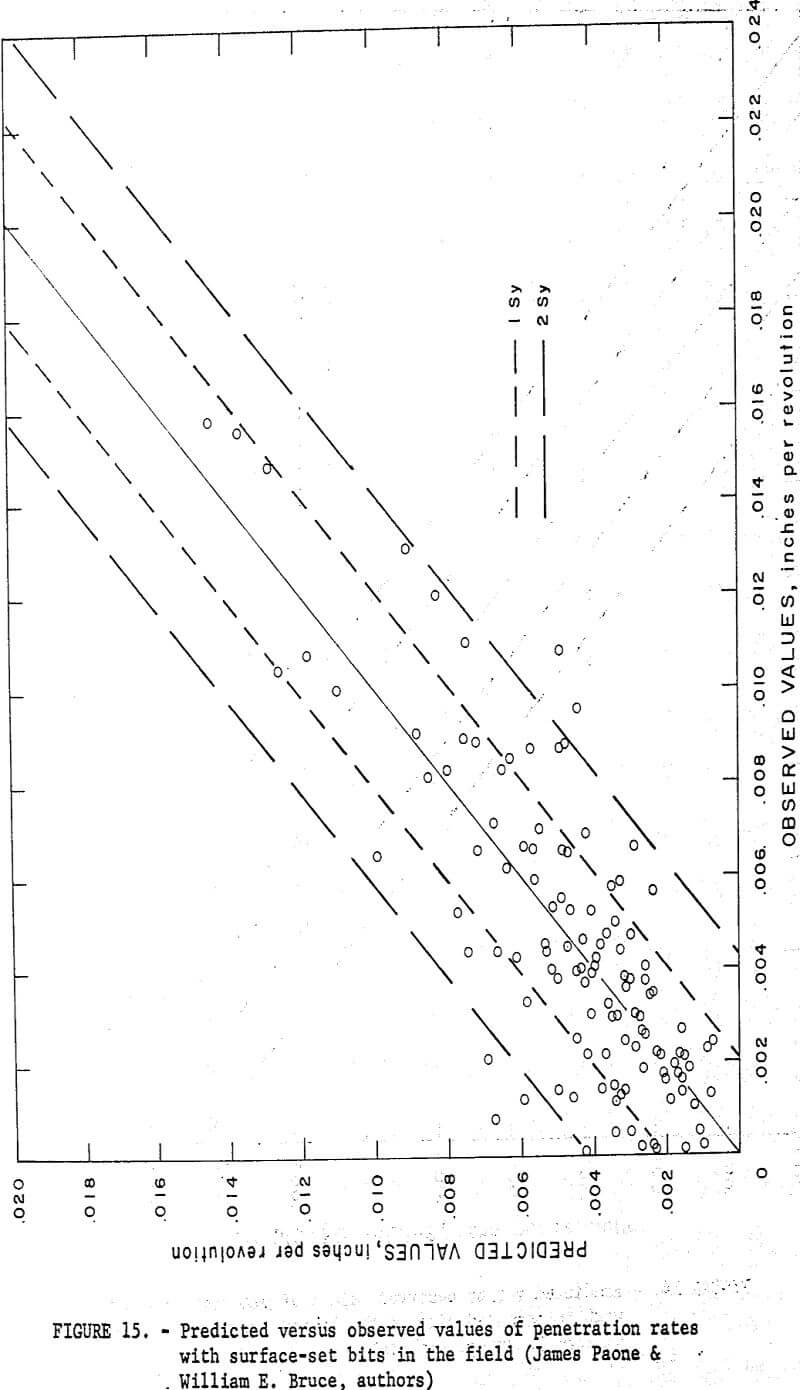
The best prediction equation for field diamond drilling with surface-set bits is as follows:
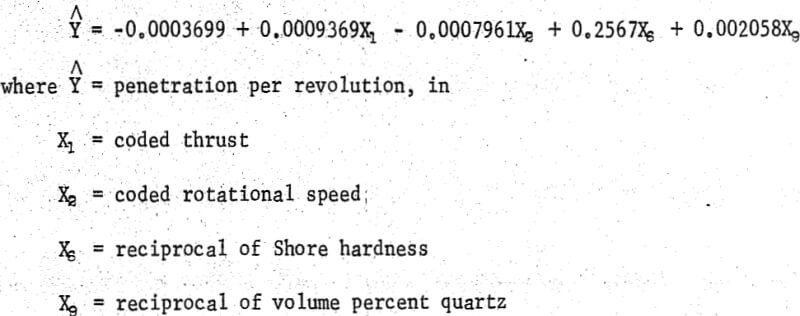
Plotted values of predicted versus observed penetration rates for this equation are shown in figure 15 along with 1 Sy and 2 Sy error bounds.
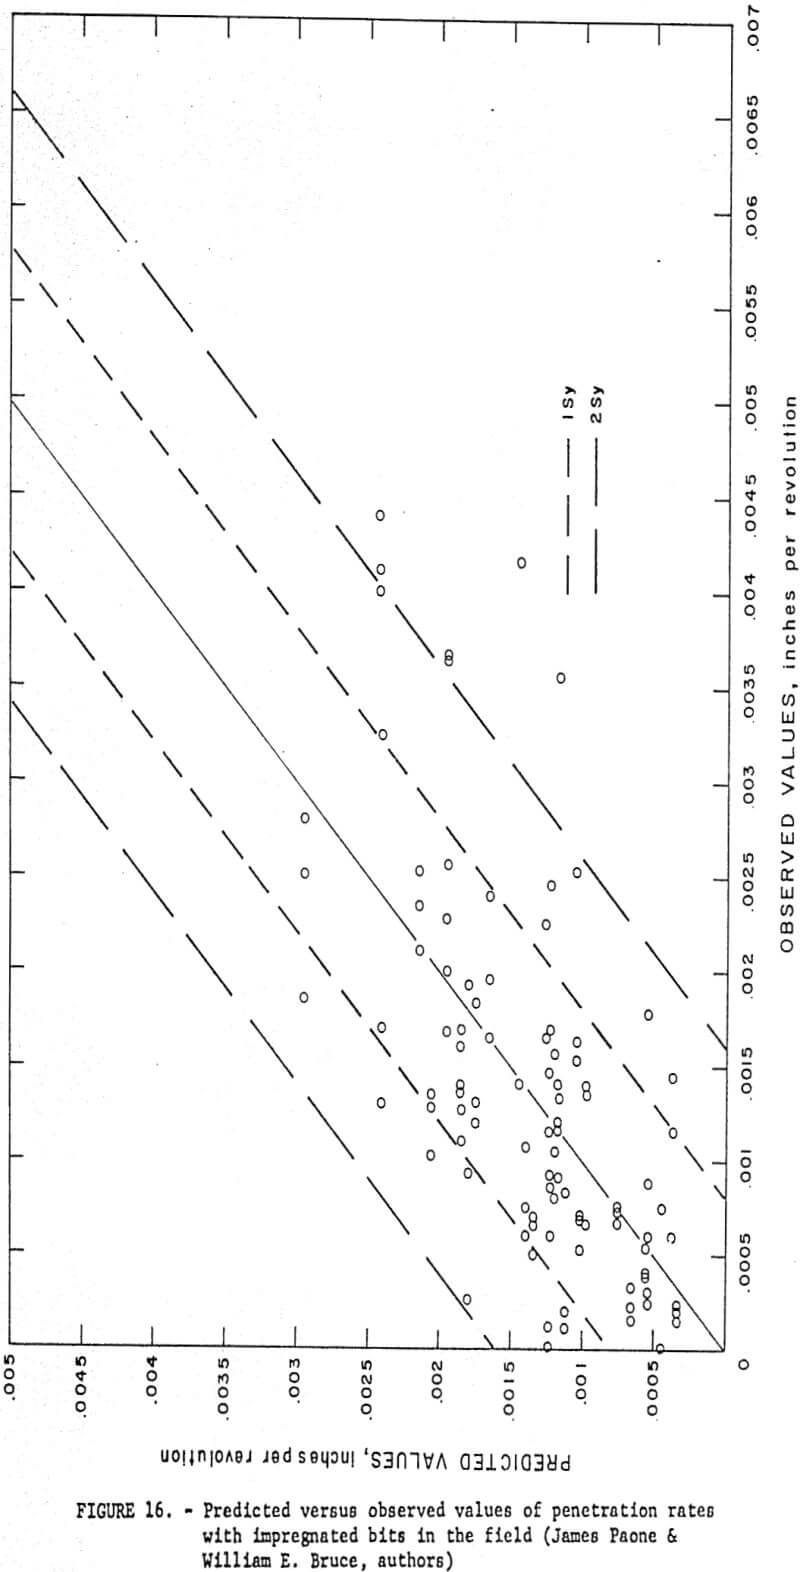
The best prediction equation for field diamond drilling with impregnated diamond bits is as follows:
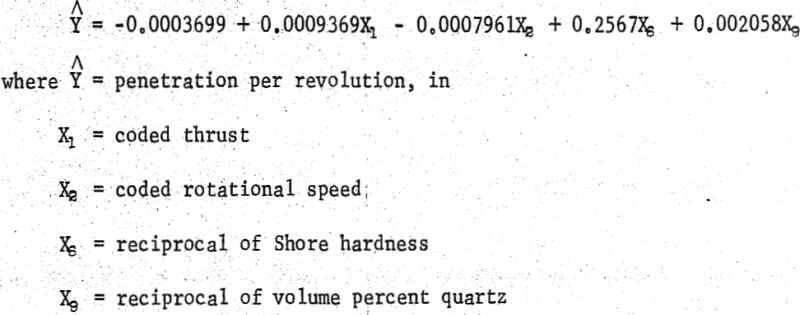
Figure 16 shows a plot of predicted versus observed penetration rates for this-equation. Error bounds of 1 Sy and 2 Sy are also shown.
The best prediction equation for field diamond drilling with either surface-set or impregnated bits is as follows
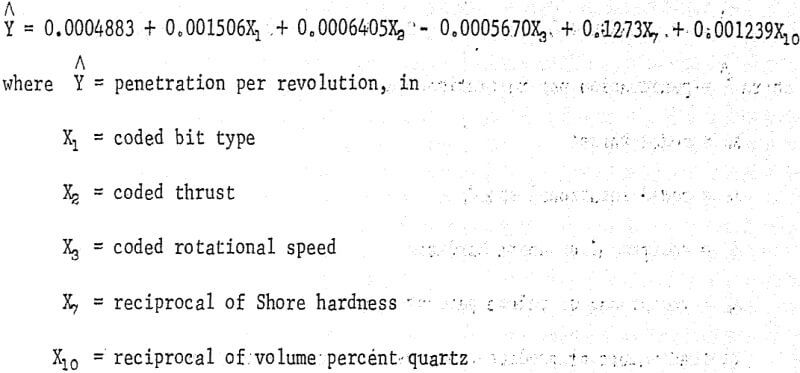
Other forms of statistically-determined predictor equations are now being studied that might yield a better predictor.
Conclusions
Laboratory diamond, drilling experiments on a limited number of rocks and subsequent drilling experiments in the field in an effort to establish a prediction equation for drillability suitable to both environments has been moderately successful to this point.
A simplified theoretical equation of the form δ = 2πT/10σcA is a good predictor for laboratory drilling, but needs some modification for field drilling since the spread from the curve is greater for these data. The modified equation will assist in establishing the relationship between field and laboratory drilling.
A suitable regression equation would make it possible to predict penetration rate for given values of thrust, rpm, bit type, physical properties of the rock to be drilled, and possibly other parameters.that were not considered in our initial studies.