Table of Contents
The height, structure, rapid rate of growth, and anticipated leaching suggested the possibility of dump failure. In order to evaluate this possibility, an outside consulting firm was retained in 1966 to investigate the stability of the growing dumps. Their investigation indicated that, other than superficial movement, the waste dumps would be stable under static loading, and that soil distribution was not continuous enough to sustain massive foundation failure. Since this investigation, however, several failure processes have been observed.
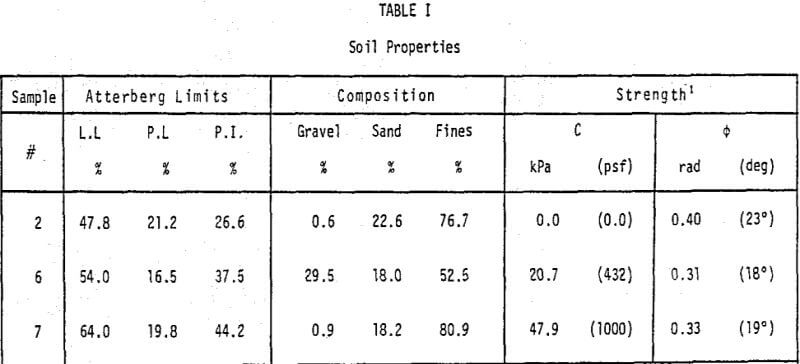
Crest settlement occurs frequently in response to compaction and over-steepening in the upper portion of the dump surface. Over-steepening results from accumulation of fines near the crest caused by natural segregation. Normally, coarse material, near the base of the dump, exhibits an angle of repose near 0.65 rad (37°). The fine material, however, stands as steep as 0.75 rad (40°). Periodic equilibrium adjustments cause stepwise settlement of the dump surface and occasional sloughing of the protective berm. Routine surface preparation by dozers and graders and frequent inspections by supervisory personnel have proven adequate in preventing problems associated with this form of crest instability.
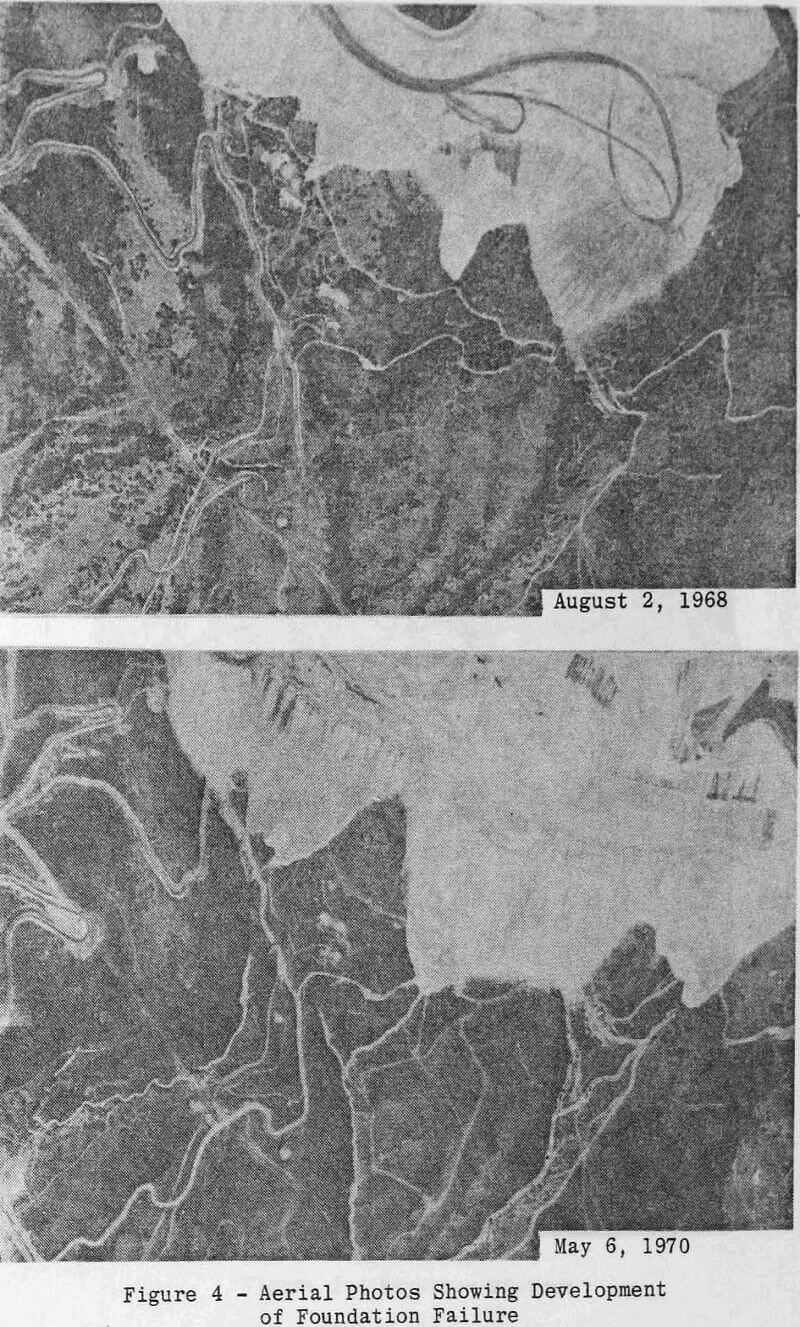
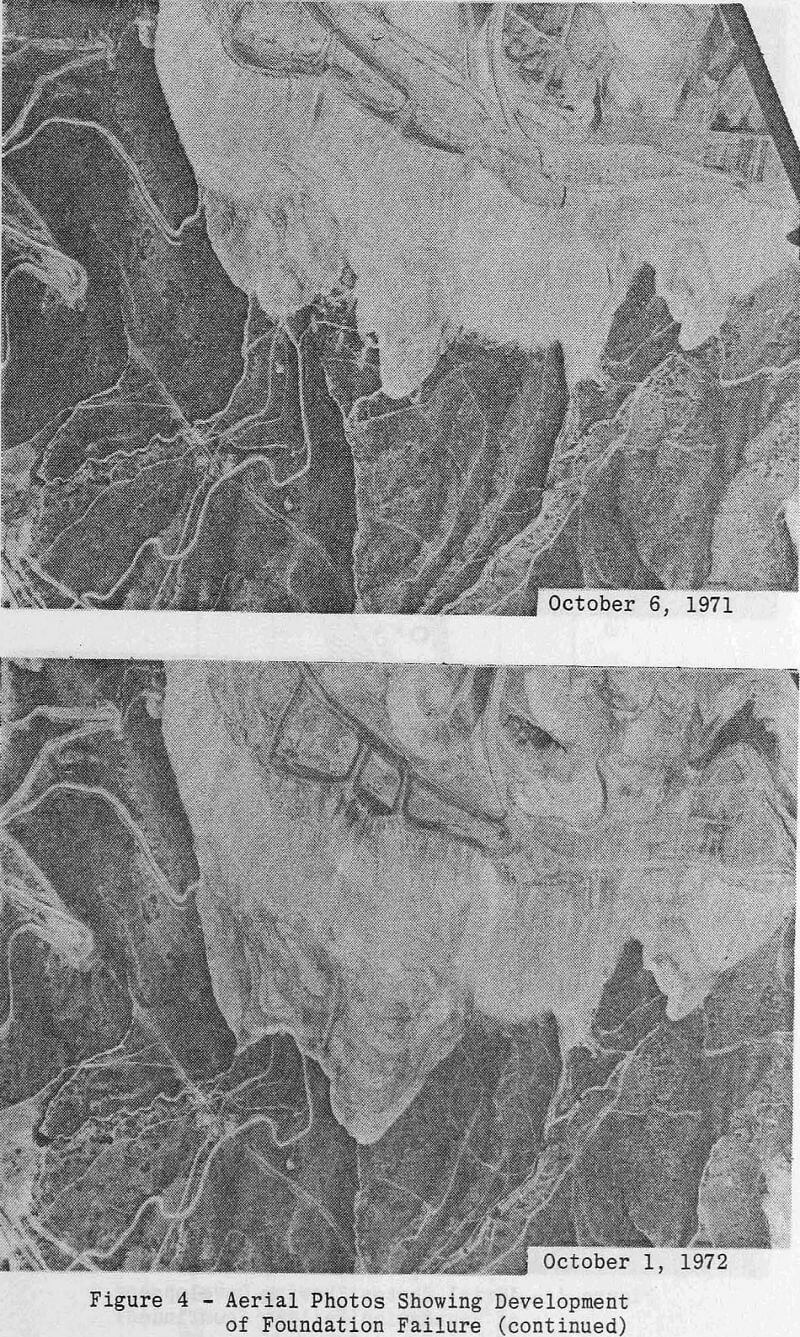
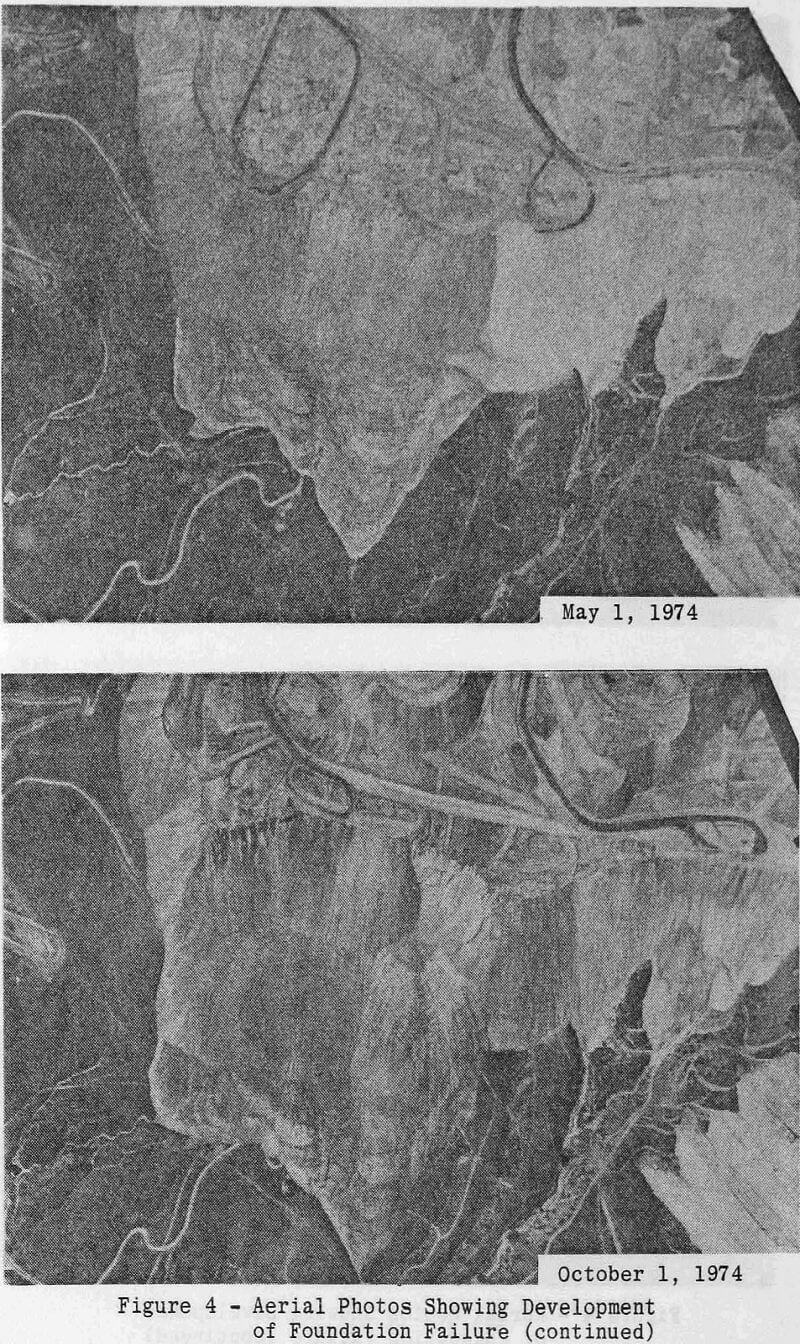
Development of Foundation Failure
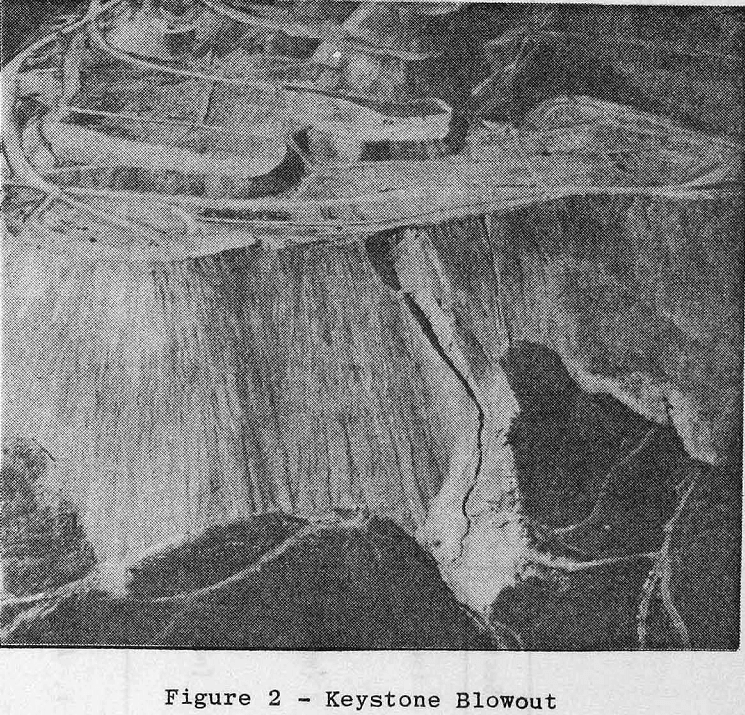
The original topography underlying Copper Notch and Keystone dumps slopes from 0.10 to 0.47 rad (6° to 27°) to the east. The soil is classified CH according to the unified soil classification system and ranges from zero to 9 m (zero to 30 ft) in depth.
As the dumps extended eastward, the weight increased with depth until failure of the underlying soil occurred. The sites of initial failure were restricted to drainages and other areas of accumulated soil. At this time, mounds of soil up to 3 m (10 ft) high were pushed ahead of the advancing toes and incorporated within the dump material.
In the case of the Copper Notch dump, the period between equilibrium adjustments initially ranged from 3 to 6 months, depending upon height, production levels, and utilization of the dump. At this frequency rate, associated crest failure developed slowly and precursory tension cracks provided sufficient warning.
Modeling and Monitoring Programs
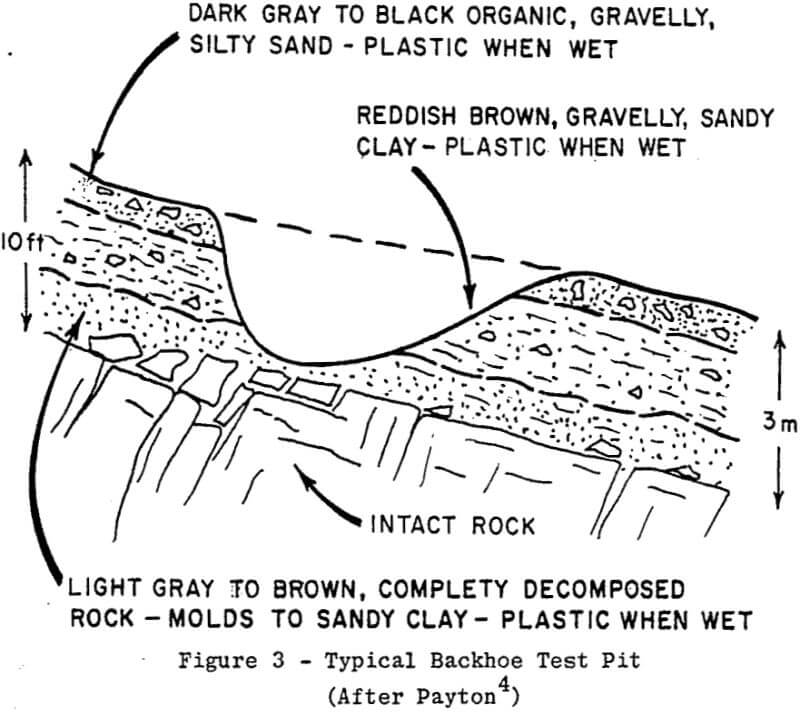
Dump profiles immediately before the 1973 slide were reconstructed by adding increments of area to the sloping portion of the surface. The failure surface intersects the critical top line at point P and continues eastward, near the angle of repose, until intersecting natural ground at, point Q. Other failure surface configurations were considered, but the straight line approach through the dump simplified modeling, paralleled pseudo-bedding, and was consistent with the high-friction, low-cohesion properties applied to such material. From point Q the failure surface was assumed to continue eastward along the original topography. The effect of water was included in the model by assuming a 1.5-m (5-ft) zone of saturation in the dump paralleling the natural surface from point £ eastward. The selection of this position for the water table was based on drill hole information.
Monitoring
In addition to periodic stadia measurement, surface extensometers were placed across fractures on the horizontal surface of the dump, and motion detection switches were placed at the toe. The extensometers and switches were monitored by radio telemetry and “hard-wire” circuits from the truck control tower, a communication center manned 24 hours a day.
Two surface extensometers were placed on the horizontal surface of the dump. These devices consisted of Stevens recorders modified for extensometer use. The recorders provided direct plots of movement versus time and were also fitted with a micro- switch and roller assembly which activated a radio transmitter upon detection of excessive movement. These devices have served well in monitoring pit slope movement, and details concerning recorder modifications and operation of the telemetry system are reported elsewhere.
The motion detection devices placed at the toe of the dump were similar to ordinary mercury switches. These switches were designed to provide long term stability and sensitivity necessary to detect onset of movement. They were mounted on stakes in contact with large boulders, on stakes below over- steepened banks, or bonded directly to boulders within the debris. A deliberate attempt was made to place switches where maximum disturbance could be expected.
Failure of Copper Notch Dump
On August 31, 1974, at 6:25 a.m., failure at the crest of the Copper Notch dump occurred. Displacement at the crest extended 900 m (3000 ft) along the edge of the dump and up to 140 m (450 ft) in width. The crest dropped approximately 140 m (450 ft) vertically, and the toe advanced in excess of 60 m (200 ft) east-ward. In all, about 58 Tg (64 million tons) or 30 Mm³ (39 million yds³) of material were involved.
The dump had been removed from service on August 30; consequently, safe conditions were maintained during failure and minimal delay in waste production was experienced. The following comments are excerpts from logs maintained by truck area supervisors and other personnel:
The adverse slope of natural topography and presence of low strength trans-ported foundation materials are the primary causes of instability. The effect of water, however, may play a role in triggering failure. Several computer runs ware made assuming zones of saturation in excess of 1.5 m (5 ft) above the natural surface.