Table of Contents
Hydrometallurgical treatment of chalcopyrite by sulfuric acid based systems for primary recovery of copper is limited by the refractory nature of the mineral (Bartlett, 1973; Gerlach et al, 1973; Vizsolyi et al, 1967). At ambient temperatures and pressures, leaching of chalcopyrite is slow and current industrial processing is almost exclusively limited to conventional mining, milling, flotation, and smelting. Some secondary dump leaching is performed on sub-grade material in which the chalcopyrite leaches slowly over a period of years and ultimate extractions rarely exceed 60 pct.
The Bureau of Mines is investigating in-situ leaching of chalcopyrite as a primary extraction technique. Two advantages make in-situ leaching an interesting possibility for treating deep chalcopyrite deposits.
The first advantage is the increase in oxygen solubility with pressure in the aqueous sulfuric acid based lixiviant system. At 500 ft below the water table, hydrostatic pressure is approximately 215 psi and oxygen solubility increases from approximately 10 ppm to 500 ppm.
A second advantage is the general increase in temperature with depth in the earth’s crust. The experimental data presented demonstrates a substantial increase in the rate constant with temperature. The earth’s mantle is projected to provide sufficient thermal insulation for the exothermic dissolution of chalcopyrite to heat the ore body and accelerate the leaching rate.
The test work was designed to provide a baseline of general information on leaching of pure chalcopyrite in the sulfuric acid-oxygen system. The system parameters chosen for study were the initial oxygen pressure, the weight ratio of acid to chalcopyrite, temperature, weight ratio of pyrite to chalcopyrite, ratio of oxygen to chalcopyrite, and time of leach.
The objective was to develop a general expression for the rate constant of leaching and determine the effect of the above variables on the rate constant.
Experimental Setup
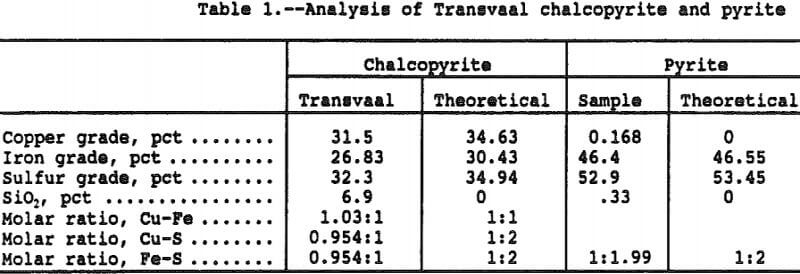
A sample of Transvaal chalcopyrite (Cp) was obtained through Ward’s Scientific for use in the study, and the head sample analysis is presented in Table 1. The chalcopyrite sample was found to be very pure with only trace amounts of sulfide impurities. The chalcopyrite was pulverized to minus 400 mesh and a particle size analysis indicated 96 pct < 53 micron, 91 pct < 45 micron and 85 pct < 38 micron.
Also shown on Table 1 is the analysis of the pulverized pyrite (Py) sample with an indicated size analysis of 93 pct < 53 micron, 80 pct < 45 micron, and 73 pct < 38 micron.
Leaching tests were performed in one liter, stainless steel autoclaves with borosilcate glass liners. The autoclaves were heated externally and contained an internal cooling coil for precise temperature control. The internal autoclave pressure was monitored with an electronic pressure transducer with an output of 0 – 100 mV over the pressure range 0 – 1,500 psi. Temperature in the autoclaves was monitored with Type J thermocouples. Pressure, time, and temperature data were recorded on an XT class data acquisition computer every three minutes for the duration of the tests. The gas connections were valved for closure and included double seal quick disconnect fittings to minimize gas loss. Magnetically coupled drive units were utilized to prevent leakage of oxygen from the autoclave.
The reactor charge consisted of chalcopyrite, distilled water, 96 pct reagent grade sulfuric acid, and pyrite. The pulp density was maintained at 14.35 g chalcopyrite/L solution for all tests which limited the ultimate solution copper concentration to 4,500 ppm at 100 pct dissolution. The ratio of pulp volume/gas volume was varied to allow control of the oxygen mass/chalcopyrite ratio. The autoclave was sealed, inserted into the furnace, and raised to the operating temperature at 325 rpm agitation. Once at temperature, the autoclave was charged to the test pressure from a personal size oxygen cylinder which was weighed before and after charging to determine the mass of oxygen added.
Statistical Design Methodology
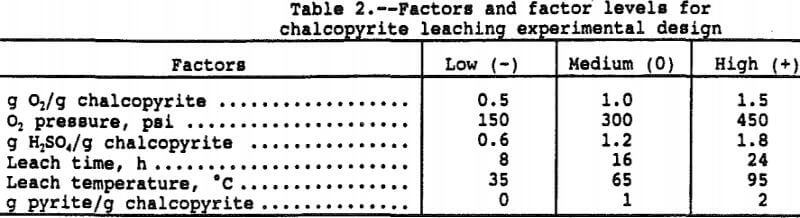
Six factors at three levels were selected for study of their effects on copper and iron solubilization, sulfur oxidation, and oxygen consumption. The six factors at three factor levels, shown in Table 2, were selected to cover the largest possible range of probable environmental conditions anticipated for in-situ leaching. A statistical design test procedure was employed to maximize the information in the smallest number of tests while simultaneously minimizing the error. The design was a three-level face-centered-cube design consisting of 32 points in a 2 fractional factorial design, 12 star points and four center points for a total of 48 tests as reported by Rautala et al. (1979).
The face-centered-cube design is significantly more robust than screening designs and enables one to estimate the coefficients in the quadratic response surface model shown below.
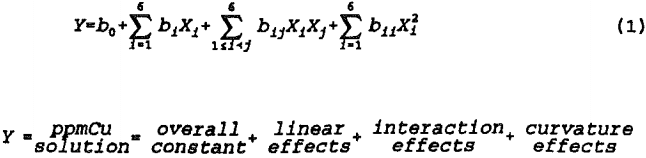
The statistical model does not measure the fit of the responses to any specific, theoretically derived metallurgical model. Rather, the general shape of the response surface is approximated by fitting a general, second order polynomial to the data. Quantitative estimates of the linear, second order, and first order interaction effects are provided by multiple linear regression coefficients which also provide a valid variance estimate for determining the range of significance. An approximation of the response surface curvature is provided by the design and analysis procedure.
Results of Design Analysis
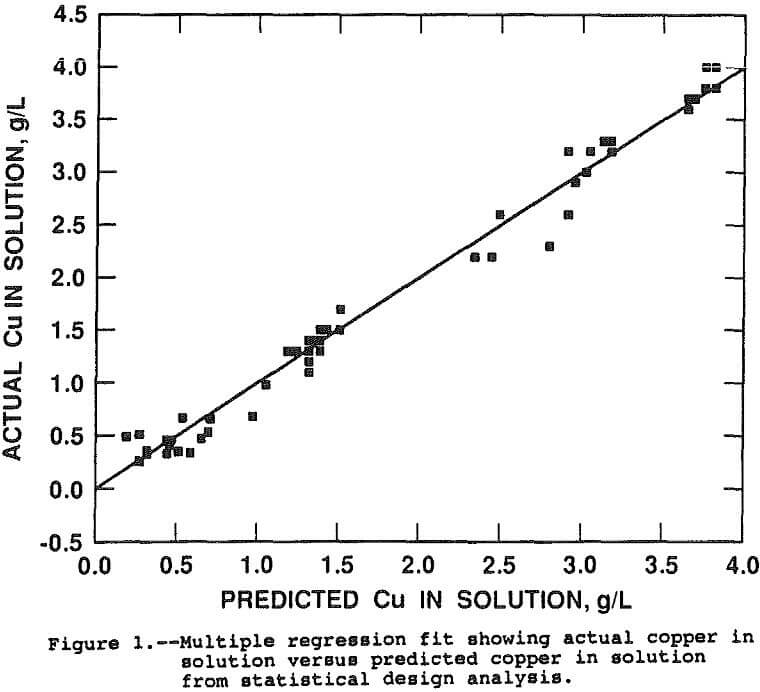
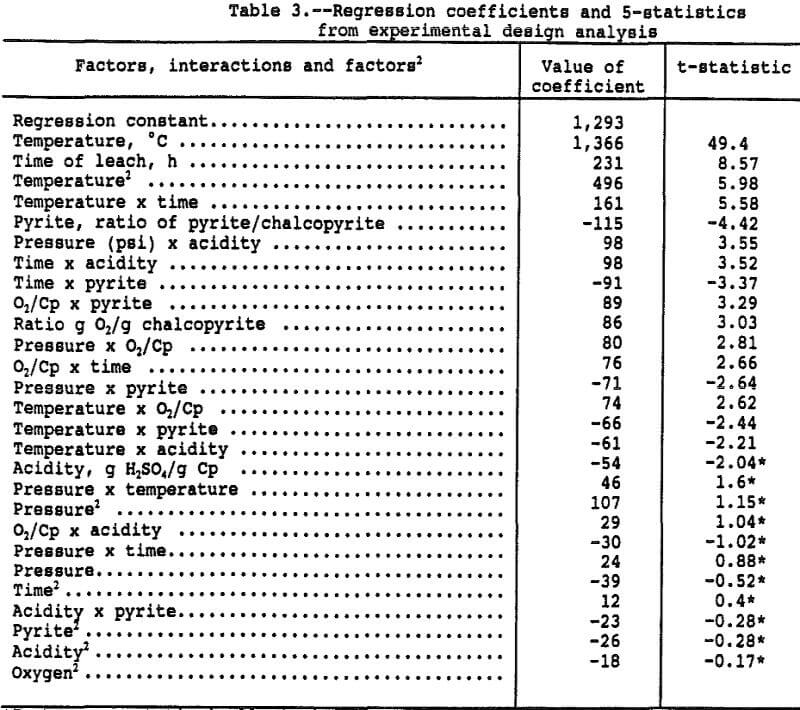
The parts-per-million copper in solution can be compared directly for estimating the various effects of the factors on copper extraction because the chalcopyrite-liquid ratio was maintained constant. The effects were estimated by running a multiple linear regression with the linear, interactive, and second order effects, in coded form, as the independent variables and the parts-per-million copper in solution as the dependent variable. The resultant regression coefficients and associated t-statistics for the coded, independent variables are presented in Table 3. Figure 1 presents a goodness of fit plot showing the observed copper in solution versus the copper in solution predicted by the regression function. The regression function has an adjusted r² of 0.96 and explains the data extremely well.
The coefficients of Table 3, derived by the regression procedure, are based on the coded or normalized variables and are not the same coefficients that would be obtained from a regression run on uncoded variables. Coding of the variables eliminates statistical problems associated with varying magnitudes and correlations between independent variables. The normalized coefficients reflect the response due to the factor over the range -1 to 1, regardless of the magnitude of the uncoded factor.
As an example, the three factor levels for temperature were -1 at 35° C, 0 at 65° C, and +1 at 95° C. With the other five factors at the zero level, the predicted copper in solution is 3,155 ppm copper at 95° C (=1,366xT+496xT²+1,293) where T = 1, T² = 1, and the regression constant is 1,293 ppm. At 65° C, the predicted copper in solution is 1,293 ppm (= 0x1,3 66+0²+1,293) and 423 ppm (= -1×1,366+496x-1²+1, 296) at 35° C. Since 100 pct extraction would result in 4,500 ppm copper in solution, the percent copper extractions at 95°, 65°, and 35° C were 70.1, 28.7, and 9.4 pct, respectively. The other factors are at the 0 level so the above values correspond to a 16 hour leach, 300 psi, Py/Cp = 1, and 1 g O2/g Cp.
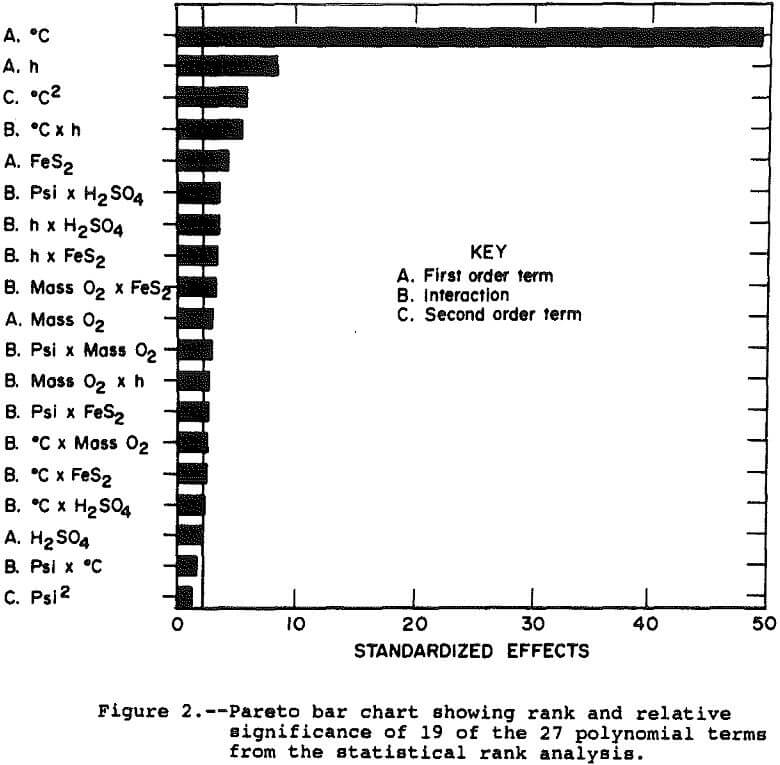
Figure 2 presents a pareto chart showing the rank and relative significance of the terms in the polynomial equation. The chart shows that 16 of the 27 effects are significantly different from zero as measured by a t-statistic greater than 2.16, which represents a 95 pct confidence interval. The effect on the system of most of these 16 is small with temperature and time alone explaining nearly 90 pct of the observed deviation in solution copper concentration.
The parabolic shape of the copper extraction response with temperature and low dependence of the response on pressure, oxygen mass, acidity, and pyrite indicate the leaching rate can be adequately described by an Arrhenius plot. In an Arrhenius plot, the logarithm of the rate constant is plotted as the dependent variable versus 1/temperature as the independent variable. The slope of the resulting straight line is the activation energy and the intercept is sometimes called the frequency factor. The rate constant at any temperature within the range can be estimated by using the equation of the Arrhenius plot:
![]()
To develop the Arrhenius plot, a function must be determined that accurately describes the rate constant for the individual tests.
Rate Constant Models
Theoretical work on leaching of sulfides has shown the kinetics can be described by a surface area proportional model or, when a residual core of reaction product remains, the shrinking core model (Bartlett et al., 1979).
In the surface area proportional model, the rate of reaction at the surface of a sphere of initial radius, r0, can be represented by the expression, when alpha = 0 at t = 0:
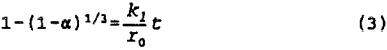
where: alpha = fraction reacted at time, t.
The expression represents the case where the reaction boundary is moving at constant velocity (linear kinetics) with rate constant, k/r0.
When the products of reaction form a layer on the reacting surface, diffusion through the reacting layer may become rate limiting. An expression for this type of mechanism, found to apply to sulfide leaching, again assuming alpha = 0 at t = 0 is:
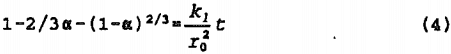
The above expression represents the “shrinking core” model in which chalcopyrite is replaced with the reaction product, elemental sulfur, at the reaction interface, forming an outer diffusion boundary of reaction product and a core of unreacted mineral.
The models, in a strict mathematical interpretation, are applicable when the solution concentration is constant and, in the case of the shrinking core model, the volume of the residual sulfur layer occupies the same volume as the original chalcopyrite.
Braithwaite and Wadsworth (1976) reported zero order kinetics with respect to oxygen partial pressure above 100 psi indicating that allowing the pressure to decline as a means of monitoring the oxygen consumption would not materially affect the observed rate constant. Since the oxygen pressure was allowed to decline, the mass of oxygen was varied to compensate for, and estimate the effect of, declining solution oxygen concentration on the leaching rate. The statistical analysis indicated oxygen pressure is not a significant linear or second order term. Interactions between pressure and pyrite, mass of oxygen, and acid strength are shown to be statistically significant, however, the magnitude is small. The mass of oxygen factor is statistically significant but also very small in magnitude indicating the kinetic mechanism is minimally dependent on the pressure under the conditions of the study. This result is in agreement with the findings of Braithwaite and Wadsworth and indicates that a correction factor for declining oxygen concentration in solution in the above models is small.
Evaluation of Rate Constant Models
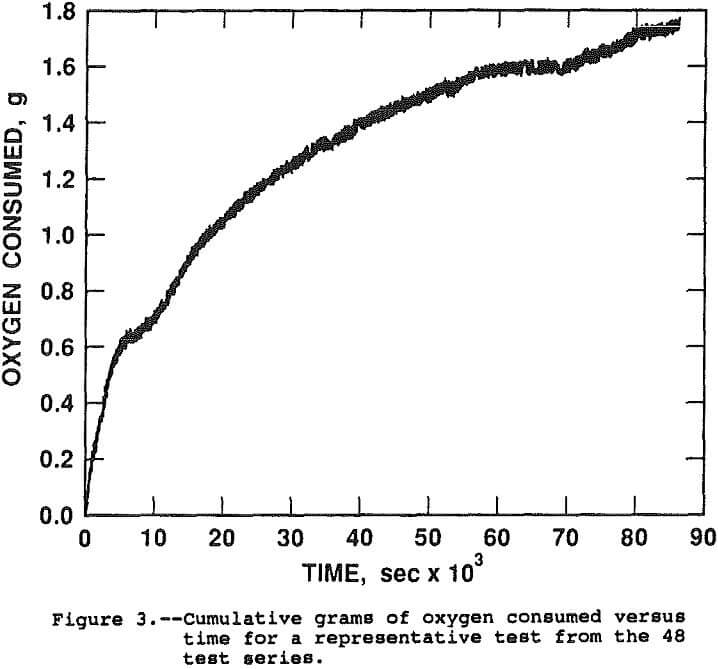
The rate constant of reaction can be evaluated by determining the appearance of reaction products or the disappearance of reactants over time. The oxygen consumption was monitored to evaluate the fit of the leaching rate with the surface proportional and shrinking core models. A plot of grans of oxygen consumed versus time, in seconds, for a typical test is shown in Figure 3.
The test was conducted at 450 psi initial oxygen pressure, 95° C, 0.6 g H2SO4/g chalcopyrite and no pyrite. The initial mass of oxygen charged to the autoclave was 1.5 g O2/g chalcopyrite for a total of 12.1 g. During the 24 hour leach, 82.2 pct of the copper was solubilized and 1.7 g of O2 was consumed. Analysis of the solutions and solid tail for copper, FeTotal, STotal, SElemental, and SO4 and solution for Fe²+ and Fe³+ indicated the following chemical reaction balance. The values shown are actual moles x 100.
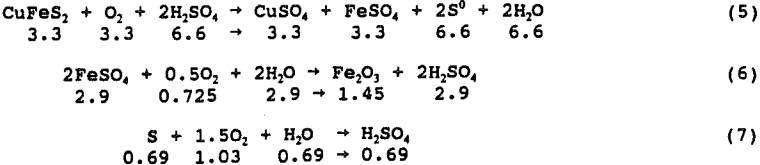
Equation 8 has been observed to predominate after approximately 50 pct extraction and is assumed for the final 17.8 pct extraction:
![]()
At 100 pct extraction of the contained copper, the oxygen consumption was projected to be 2.05 g.
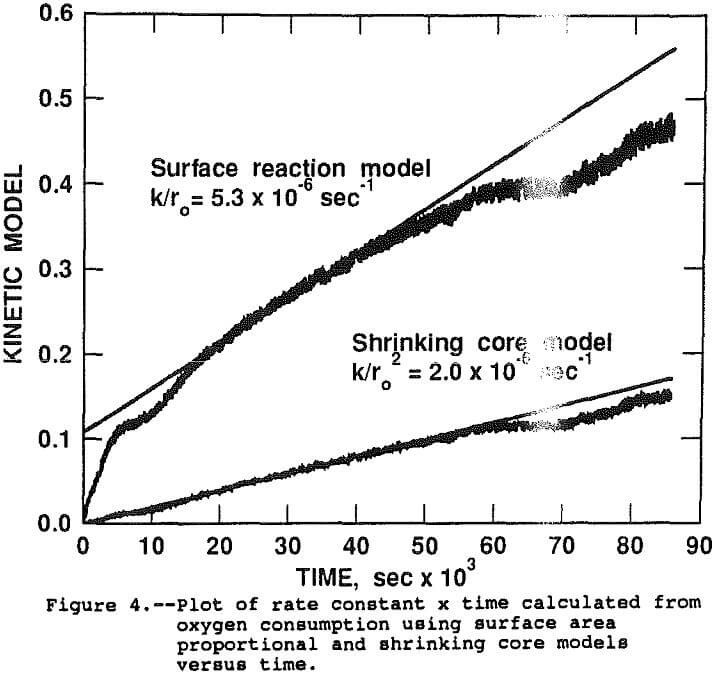
Assuming the stoichiometric factor for oxygen demand remained generally constant throughout the test, alpha (the percentage of reaction at time, t) can be estimated by dividing the cumulative oxygen consumed at t, by the projected oxygen requirement at 100 pct extraction. The applicability of the rate constant models can be determined by regressing the model expression as the dependent variable versus the time as the independent variable. A perfect model fit will result in a straight line with the slope equal to k for constant, monosize samples. Figure 4 shows the raw data and linear regression lines for both the surface area proportional and shrinking core models. The slopes of the regression lines are the best estimates of K/r0 (5.29×10 -6 sec-¹) for surface area proportional and K/r0² (2.0 x 10 -6 sec-¹) for the shrinking core. Similar analysis of data from the other 47 tests indicates that the shrinking core model is a significantly better fit of the data than the surface area proportional model. For the remainder of the paper, the rate constant will refer to the K/r0² constant derived from the shrinking core model.
Development of the Arrhenius Activation Energy Function
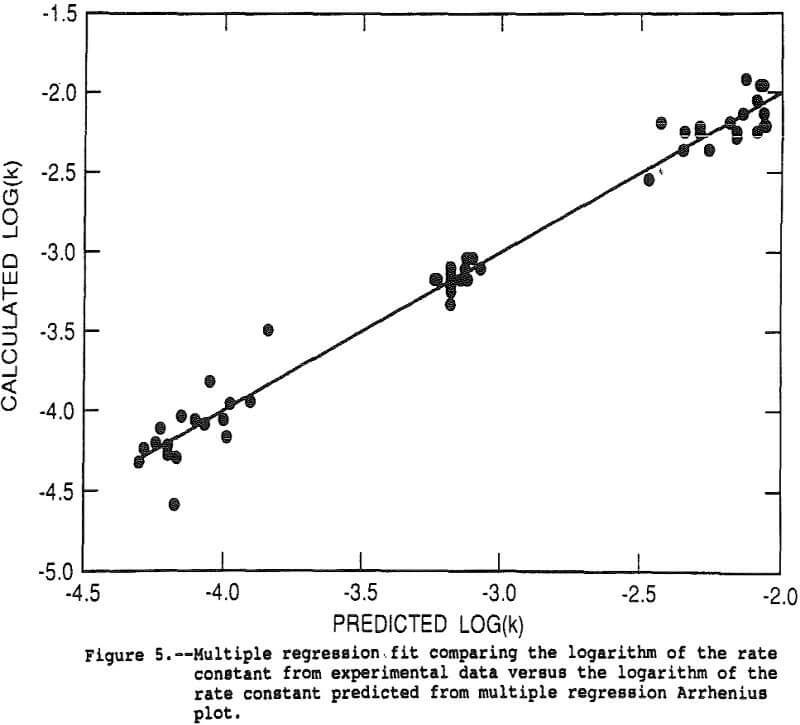
The rate constant for each of the 48 tests was calculated using the shrinking core expression with the actual copper recovery as alpha. The shrinking core expression was divided by time, eliminating time as an independent variable and resulting in an estimate of k/r0². The data for the 48 tests was analyzed with the response surface model by multiple linear regression. The log of the above derived estimate of k/r0² was the dependent variable and linear, interactive and second order terms for pressure, 1/temperature, mass of oxygen in the reactor, acidity, and the FeS2/CuFeS2 ratio were the independent variables. The goodness of fit is illustrated in Figure 5 which shows the experimental data as points and the regression fit as the solid line. The r² for the regression was 0.987.
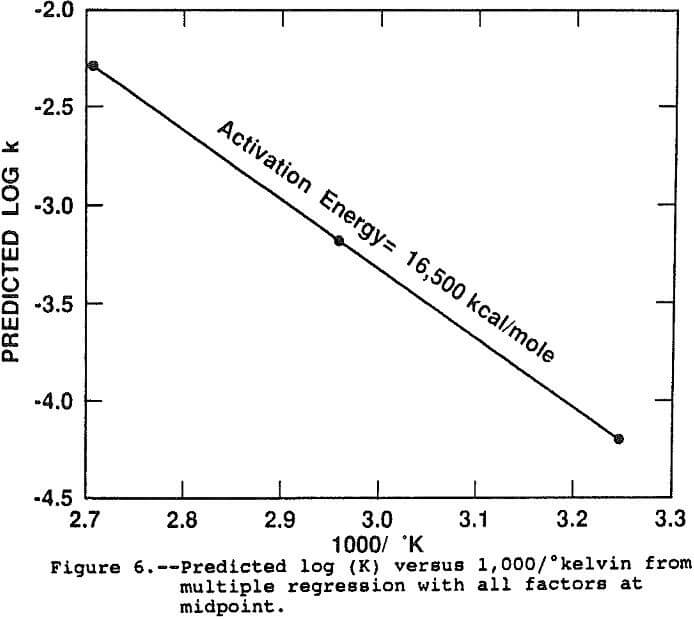
The results of the regression support the conclusion that an Arrhenius function is a powerful predictor of the effect of temperature on the rate constant. The linear dependence of Log(k) on temperature accounts for over 90 pct of the observed variation in rate constant under all conditions of the study. Figure 6 shows the predicted Arrhenius line when all factors are at the midpoint, representing the response of log(k) with temperature exclusive of all other factors and interactions. The slope of the line, the activation energy, is 16,500 kcal/mole which is in general agreement with previous researchers results (Beckstead et al., 1976; Vu et al., 1973). The intercept, or frequency factor, A, was 6.58×10 -4 sec-¹.
The regression analysis indicates the rate constant decreases 13 pct with each equal weight of pyrite present, an effect not understood at present. Since the log(k) is linearly dependent on the level of pyrite and there are no significant interactions between pyrite and temperature, the activation energy is not affected by the FeS2/CuFeS2 ratio. The primary sulfur product from pyrite leaching was sulfate which increased both the rate and ultimate oxygen consumption by as much as four times over chalcopyrite alone. A significant interaction between pyrite and pressure or mass of oxygen would be expected if the observed effect was due to oxygen consumption by the reacting pyrite or drop in pressure in the autoclave. Neither interaction was found to be significant.
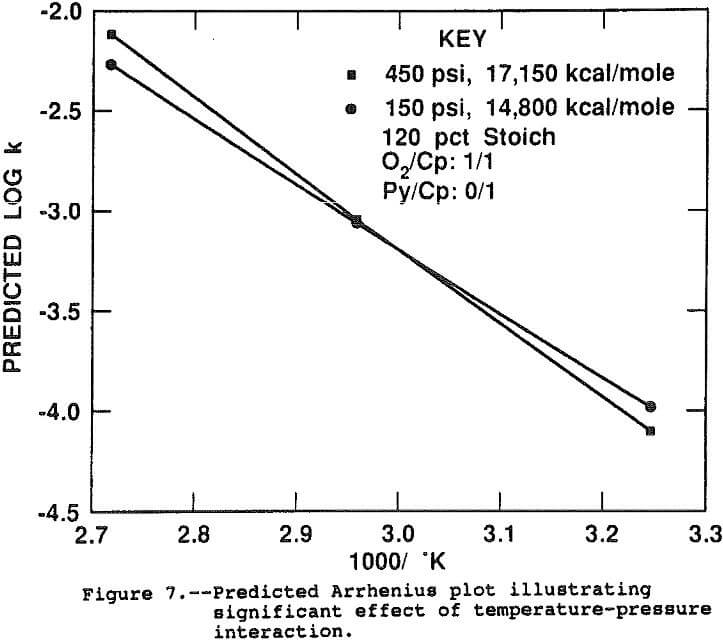
The log(k) was not significantly correlated with the linear or second order pressure terms. Two statistically significant interactions between pressure and temperature and pressure and acidity were indicated by the model. Figure 7 shows the interaction effect between temperature and pressure. Since pressure interacts with temperature, the activation energy, or slope of the Arrhenius plot, depends directly on the pressure. At 450 psi, the activation energy is estimated at 17,150 kcal/mole while at 150 psi the slope is flatter, measuring 14,800 kcal/mole. This result suggests the pressure is more critical at the faster leaching rate at 95° C, probably due to diffusional effects. The two curves were calculated assuming no pyrite was present and all other factors at their midpoint.
An interaction between pressure and acidity was measured as statistically significant indicating the kinetic rate is faster when high acid, high pressure or low acid, low pressure conditions are maintained. High pressure, low acid or low pressure, high acid conditions are indicated to slow the kinetic rate. The effect is not understood. At low acid conditions, hematite forms as iron is hydrolyzed to provide acid. Hematite formed at high pressure may be less permeable than that formed under low pressure thus the favorable combination of low pressure and low acid. At high acid conditions, the diffusion of oxygen through the residual sulfur layer may be rate limiting at low pressure resulting in a faster leach rate under high pressure at high acid.
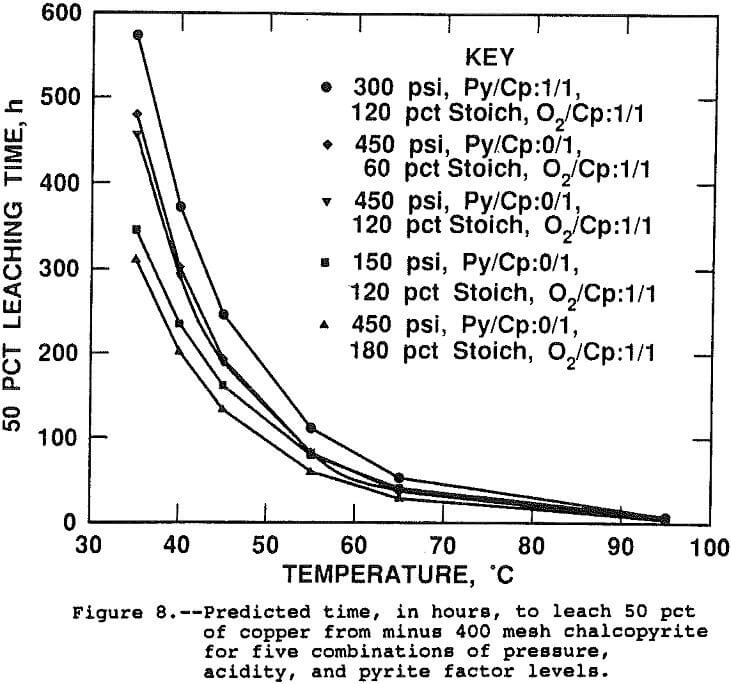
The half lives, or estimated time to leach 50 pct of the contained copper, were calculated from the rate constants predicted by the linear regression equation for five different sets of experimental conditions and are shown on Figure 8. Table 4 presents the conditions and activation energies for each curve. The activation energies presented on Table 4 were calculated by regressing log(k), predicted by the surface response model, as a function of 1/T. since the rate constant is a linear function of the slope of the Arhennius correlation, or activation energy, and the intercept, activation energy does not by itself determine the rate constant for a given set of conditions. Both the slope of the line, the activation energy, and the intercept, or frequency factor, determine the rate constant value. The curves of Figure 8 do not converge at 95° C, although, from the graphical scale, it appears they do. Shown in Table 4 are the times to leach 50 pct at 95° C. Several results from the study are illustrated.
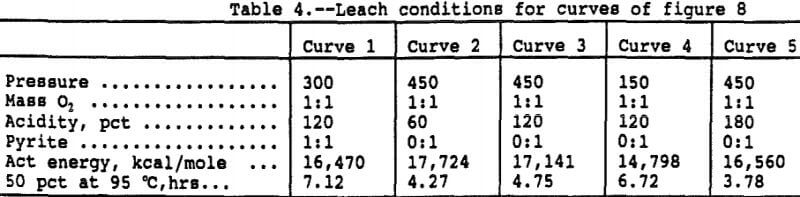
The negative effect of pyrite is evident by the slower predicted leach rate when pyrite is present, illustrated on the first, or top, curve. The pressure-temperature interaction is evident when comparing curves 3 and 4 which show a faster leach rate at low pressure when the temperature is below 65° C and a faster rate at high pressure above 65° C. And the third is the pressure-acid interaction shown by the faster leaching rate of the high pressure, high acid conditions of curve 5 versus the high pressure, low acid conditions of curve 2.
The leach conditions have been shown to have a significant effect on the time required for extraction. The effects are magnified at lower temperature but become relatively less important as the leach temperature increases. Although the low temperature data were highly correlated statistically, the low percentage extractions attained in the short leach times of this study suggest that caution be used in applying the results at low temperature.
Acidity and Iron Hydrolysis
The initial acid charge for the test series was 180, 120 or 60 pct of stoichiometric, based on the chemical equation:
Cu2FeS2 + 2H2SO4 → CuSO4 + FeSO4 + 2S° + 2H2O……………………………………….(9)
With only 60 pct of the acid available, complete leaching of chalcopyrite would be impossible by the above equation. Acid must be supplied by hydrolysis or oxidation of sulfur to sulfate. Chemical analysis of the leach products show that elemental sulfur was the primary sulfur product from chalcopyrite under all conditions of this study. Iron oxide precipitation in the absence of free acid provided the necessary acid for continued leaching of chalcopyrite without oxidation of sulfur to sulfate. Oxidation of sulfur to sulfate occurred exogenously under all conditions, accounting for roughly 10 pct of the sulfur product.
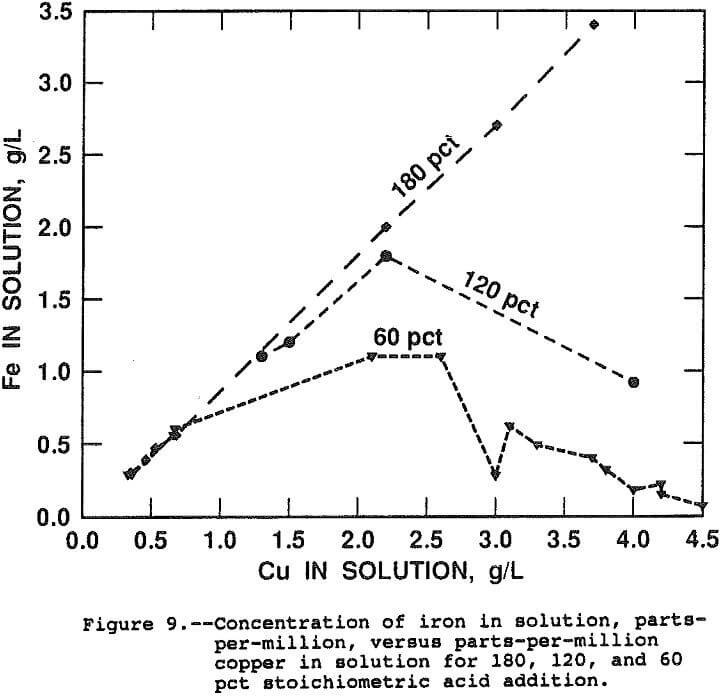
Figure 9 presents curves of the ppm iron in solution as a function of ppm copper in solution for the 180, 120 and 60 pct stoichiometric acid addition. By equation 9, a straight line is expected with a slope of 55.847/63.546, the ratio of atomic weights, as one mole of iron is released for each mole of copper. The slope of the line for data taken from tests in which 180 pct of the stoichiometric acid was added is equal to the ratio of atomic weights.
The data for the 120 and 60 pct stoichiometric addition show that iron hydrolysis generates the acid necessary to solubilize copper from chalcopyrite. The initial slopes for both lines are equal to the ratio of molecular weights indicating that, in the presence of free acid, equation 9 occurs nearly exclusively. Iron hydrolysis occurs spontaneously after the free acid is consumed and the overall leaching reaction becomes:
3CuFeS2 + 3.75O2 + Fe2(SO4)3 → 3CuSO4 + 2. 5Fe2O3 + 6S°……………………………………………..(10)
The leach rate was found to be independent of the initial acidity indicating diffusion of acid is not rate limiting, from 60 to 180 pct stoichiometric. The result also indicates the iron hydrolysis reaction occurs at a rate greater than the chalcopyrite leach rate and, therefore, iron hydrolysis is not rate limiting.
Conclusions
The rate constant of leaching of chalcopyrite in the oxygen-sulfuric acid system is more accurately described by the shrinking core model than the surface area proportional model.
The extremely high dependence of the rate constant on temperature allows an accurate prediction of the rate through an Arrhenius correlation.
The activation energy was found to vary between 17,150 kcal/mole and 14,800 kcal/mole due to the rate slowing effect of pyrite and interaction effects between pressure-temperature and pressure-acidity. The activation energy due to the variation of rate with temperature was indicated to be 16,500 kcal/mole.
Oxygen pressure was found to significantly influence the leach kinetics through interactions with temperature and acidity. The rate of oxygen consumption increases with leach rate at higher temperature resulting in a pressure dependence probably due to oxygen
The presence of pyrite was found to reduce the leach kinetics. The effect was a linear reduction in rate with mass of pyrite. No significant interactions between pyrite and the mass of oxygen added or pressure were observed indicating the effect is not related to oxygen diffusion.
The primary product of the reaction was elemental sulfur with approximately 10 pct of the sulfur oxidizing to sulfate under all conditions of the study.
Insignificant hydrolysis appears to occur in the presence of free acid. In the absence of free acid, iron hydrolysis provides the necessary acid for chalcopyrite leaching rather than oxidation of sulfur. The rate of hydrolysis appears to occur significantly faster than the rate of chalcopyrite leaching and therefore is not rate limiting.