
Table of Contents
A scale-invariant theory of rock failure has been proposed that predicts precursor effects prior to failure, such as anomalous VP/VS behavior and tilt, will occur in either dry or wet rock. Because the theory is scale invariant, these effects are predicted to occur on the laboratory scale over a time interval of a few milliseconds and that this time interval is independent of rock type. Experimental evidence is presented indicating that tilt precursors, whose behavior is qualitatively similar to those observed prior to earthquakes, are observed a few milliseconds prior to failure of rock on the laboratory scale. Preliminary experimental results suggest that this time interval is independent of rock type.
Experimental Procedure
NX-size cores (5.39 cm in diameter) of a variety of rock types including Barre Granite and Berea Sandstone (reported in this paper), oil shale, schist, and marble were drilled, cut, and ground to a final length of 13.5 cm. A length tolerance across any diameter of 0.002 cm was maintained. The perpendicular tolerance of the end planes to the axis of the specimen was less than 1.9°. All specimens were deformed to failure under a confining pressure of 150 bars in a servocontrolled materials-testing system (MTS Systems Corp., 2.7 x 10 6 newton capacity), instrumented as shown in figure 1. Tests were performed under deformation control with a displacement rate of 6.5 x 10 -4 cm/sec.
The load cell (Interface model 1240-AO, 9 x 10 5 newton capacity) used in the testing program was unique in that both the X- and Y-moments (Mx and My), in addition to the total load, F (z-axis is load direction), could be measured and recorded on separate channels as a function of time. Bending moments, similar to tilt measurements in earthquake prone regions, are measured about two perpendicular axes intersecting at the center of the transducer and normal to the load axis. Maximum thrust and moment deflection in this cell are 1 x 10-² cm and 0°15′, respectively. Changes in load on the sample of at least 90 newtons can be detected. Moment and load changes were recorded on a Honeywell visicorder (model 1108) with a paper speed of 200 cm/sec, and/or on a digital memory scope (Nicolet Corp., model 1090) with a sample point sweep time that could be varied from 1 µsec to 500/sec. A 20- to 100-µsec interval
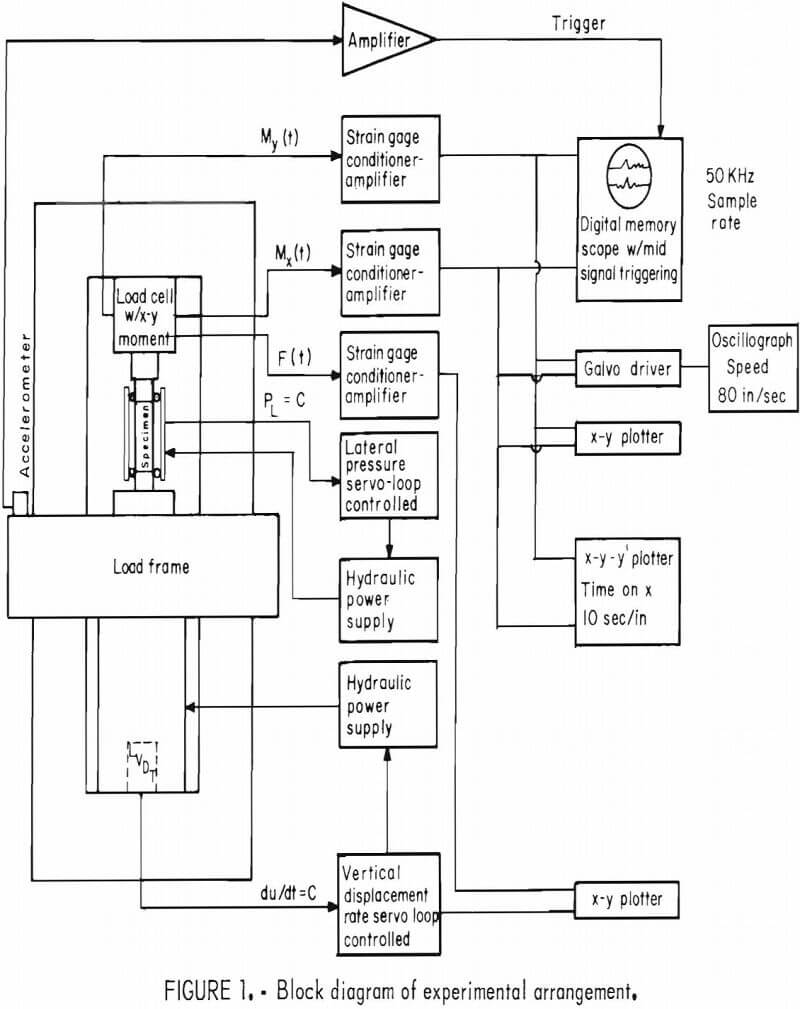
per sample point was used for all tests reported here. The load cell was found to exhibit characteristic resonant frequencies of approximately 800 Hz, 1,350 Hz, and 3,800 Hz that are excited when the rock specimen fails. The Q-value of the load cell is approximately 10.
Experimental Data
Figure 2 illustrates the variation with time of bending moment (Mx and My) for Barre Granite (BG-T238) and Berea Sandstone (BSS-5). Visicorder output of Mx and My versus time is shown in figure 2B. Photographs of the time variation of Mx and My for the first fracture in Berea Sandstone (recorded on the digital oscilloscope) and the fractured test samples are shown in figure 2A and 2C, respectively. Note that the failure of the Barre Granite specimen was a multiple (2) fracture event and that the second fracture developed approximately 85 msec after the initial break. The failure of the Berea Sandstone specimen, on the other hand, was a single-fracture event. This observation is not to be construed as suggesting that the existence of multiple or single fractures in failed rock is a function of rock type. Based on our tests, the occurrence of multiple versus single fractures in failed
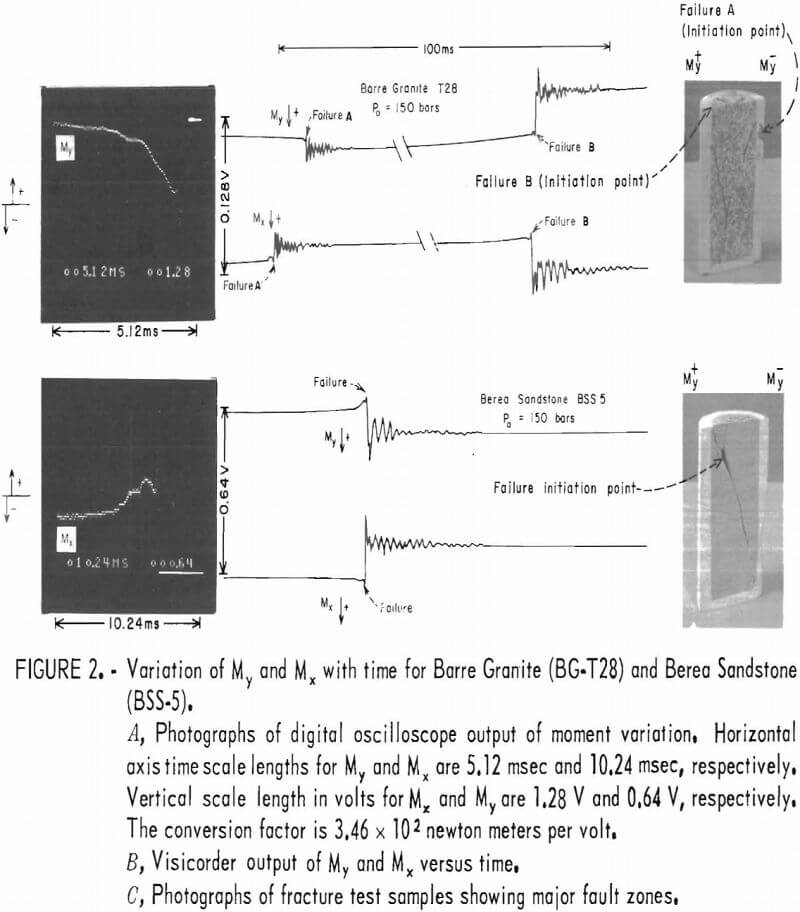
rock depends only on such influences as confining pressure, uniformity of loading, and the existence of local inhomogeneities within the specimen. Fractures in both BG-T28 and BSS-5 bisected the x- and y-axes. In figure 2A, the horizontal axis length represents the time scale in milliseconds for both moments. The vertical axis length (measured in volts) represents the magnitude of the moment changes with a conversion factor of 3.46 x 10² newton meters per volt.
Analysis of the data in figure 2 shows that anomalies in Mx and My were present prior to both fractures in BG-T28 and the single fracture in BSS-5. The time duration of these anomalies is 1 to 2 msec. Note that bending, or tilting, occurs first in a direction toward the eventual direction of fault growth. This is followed by a reversal in the tilt direction away from the direction of eventual fault growth; that is, toward the region where fault growth is initiated. The inferred initiation locations for failure (based on these moment changes) were substantiated by microscopic examination that showed increased crack concentrations in these locations (fig. 2C).
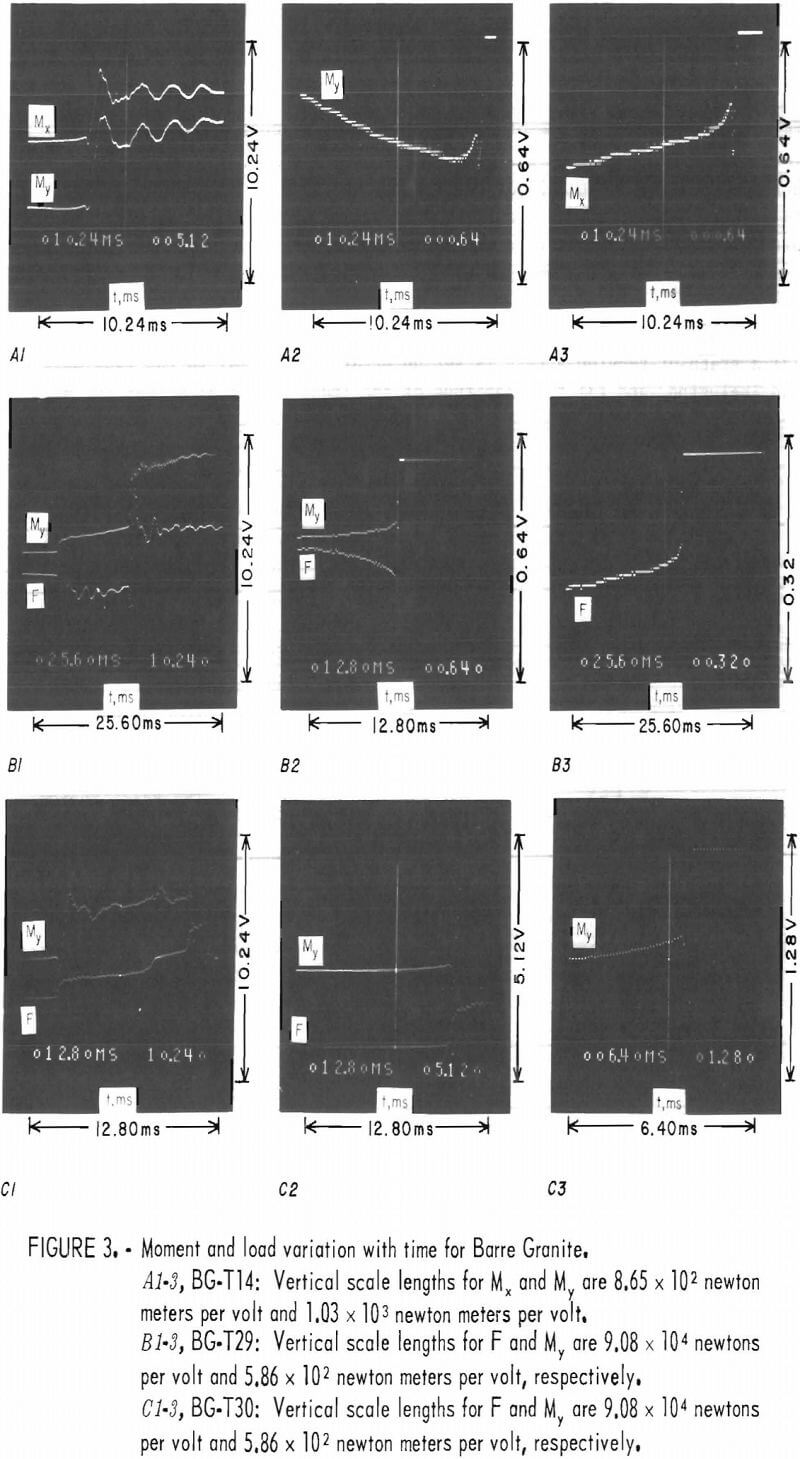
Moment and total load (F) variation with time for Barre Granite specimens T14, T29, and T30 is shown in figure 3. Vertical scale lengths for Mx and My for T14 are 8.65 x 10² newton meters per volt and 10.38 x 10² newton meters per volt, respectively. Vertical scale conversion factors for My and F for T29 and T30 are 5.86 x 10² newton meters per volt and 9.08 x 10 4 newton meters per volt, respectively. Horizontal time scale in milliseconds is shown on the lower left side of each photograph. Vertical scale in volts is located on the lower right side of each photograph. Specimens T14(A) and T30(C) were single-fracture events. Specimen T29 was a multiple event. Moment and load changes for the first fracture in T29 are shown in panels B2 and B3 of figure 3.
The most prominent feature in figure 3 is tilting, first in the direction of eventual fault growth a few milliseconds prior to failure, followed by a reversal in tilt direction that culminates in a specimen failure. Note that total load in samples T29 and T30 decreases during this time interval. The load decrease and moment changes within these specimens during this time interval are about 2,500 newtons and 100 newton meters, respectively. Also, the time durations of the tilt and load change anomalies are nearly identical. However, our results suggest that the tilt anomaly always precedes the load change in this case, load decrease by a time interval that is usually less than 1 msec. Since the load changes within the specimen occur over such a small time interval and because the primary hydraulic loading system of the machine cannot respond to deformation changes in less than approximately 100 msec, load changes within the specimen are transferred to the columns of the test machine (fig. 1). Thus, the sample continues to shorten during this time interval. It is not difficult to show theoretically that, under these conditions, the post-failure stiffness of the sample decreases during the anomaly time interval. Catastrophic failure occurs only when the postfailure stiffness of the sample equals the loading system stiffness.
Discussion
A scale-invariant theory of failure governing the initiation and growth of faulting in rock was proposed recently. This scale invariance in failing rock provides an explanation of why the precursor time-magnitude-length relationships hold for both mine failures and earthquakes. Very briefly, the key hypothesis of this theory, termed the inclusion theory, is that the intense crack concentrations experimentally observed to develop within localized regions in rock just prior to failure can be mathematically modeled and physically replaced by low-modulus inclusions. The inclusions produce a threefold effect: (1) The local principal stress axes rotate both within and outside the inclusion during the formation of the inclusion, (2) a state-of-tension stress is set up within and normal to the long axis of the inclusion, and (3) the magnitude of the least principal stress increases in compression in the focal region of the inclusion; that is, the region into which the inclusion and its associated fault(s) will grow (fig. 4). As the least principal stress increases in compression and the principal stress difference decreases, cracks in the local region of the inclusion which opened during the dilatant phase begin to close. The focal region begins to store strain energy that will eventually be released as high frequency seismic radiation at the moment of failure. The total amount of energy stored within the sample as it is deformed from zero load to ultimate load is released in the low frequency spectrum and should not be confused with the energy released by failure in the focal region of the inclusion. The inclusion theory provides an explanation of a wide range of precursor phenomena, including tilt prior to failure. In the theory, precursor time is defined to be the time interval between the initiation of crack
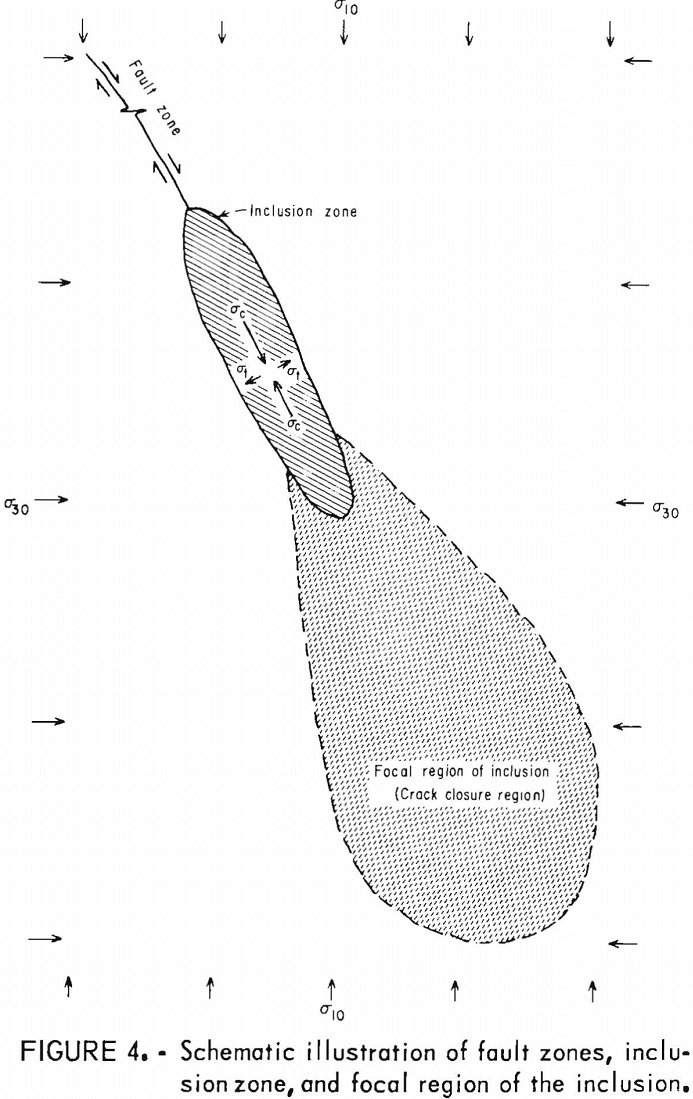
closure and failure; that is, the time between intense dilation and the failure. The theory rests on the postulate that failure occurs when all cracks in the focal region of the inclusion close. At this point in time, the tension stress within the inclusion reaches a maximum and failure occurs. Macrocrack growth within the inclusion zone causes load to decrease within the inclusion and increase in both the focal region and fault zone. Data in figure 3 support this observation.
Anomalous tilt behavior prior to failure is predicted by the theory. For example, during the formation of the inclusion zone, tilting will be in a direction away from this zone. The tilt direction will reverse as cracks close in the focal region. The theory also predicts that the time duration of the tilt anomaly is independent of rock type and is a function of the size of the failure. For example, a time anomaly of a few milliseconds will occur prior to failure in laboratory size (1-10 cm in length) specimens. Also, the anomaly time will be independent of rock type.
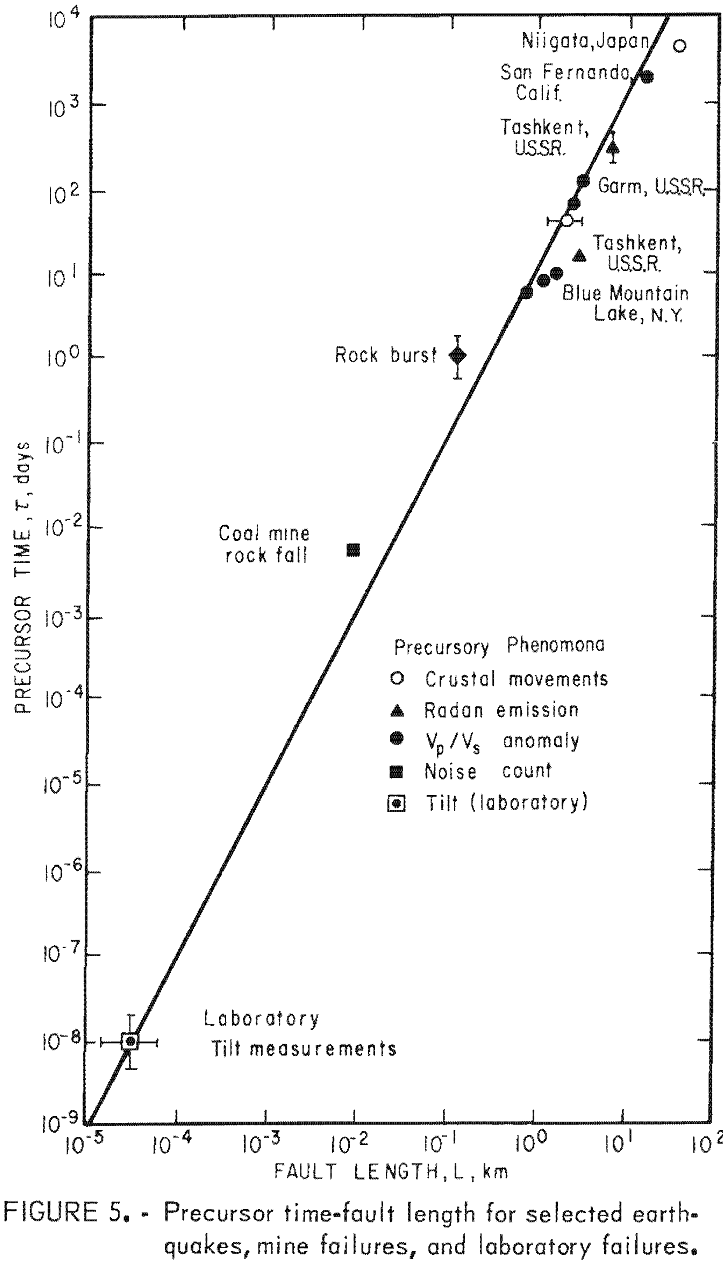
Figure 5 illustrates precursor time-fault length for selected earthquakes, mine failures, and laboratory failures (based on previous experimental data). Fault length that is proportional to inclusion zone length for the laboratory specimens was estimated to be within 1 and 10 cm. Note that the time anomalies for the laboratory failures lie where predicted. Thus, the scale-invariant property of the rock failure, at least within a precursor time interval of 10 -8 day to 10 4 days or, alternatively, seven orders of magnitude in fault length, appears to have experimental justification, Tests on other rock types, such as oil shale, schist, marble, and hydrostone, suggest tilt precursor anomalies also of a few milliseconds. How¬ever, further experimental work will be required to adequately test the prediction that anomaly time is independent of rock type.