
Table of Contents
A novel technique has been employed by the U. S. Bureau of Mines to determine the zeta potential of particles for a far-reaching series of material types in a wide variety of baseline waters, both alone and with many different chemical additives. The materials tested ranged from naturally occurring Sioux Quartzite and Tennessee marble to commercially produced magnesium oxide bricks. The waters tested ranged from ultrapure distilled, deionized water to municipal tap water and mine-site water. The chemical solutions tested included inorganic additives, such as aluminum chloride (AlCl3) and sodium chloride (NaCl); organic additives, such as dodecyltrimethyl ammonium bromide (DTAB); and nonionic polymers, such as polyethylene oxide (PEO). The results of precise zeta potential determinations have application in a large number of laboratory studies as well as in various mining and processing operations.
There are many areas of research and manufacturing that make use of either zero zeta potential or some other zeta potential value to control desired product properties. A knowledge of a system’s unique zeta potential characteristics is therefore required to successfully perform many research or manufacturing tasks. Manufacturing and production applications for zeta potential range from processing techniques for such diverse items as paints and detergents to selective mineral flotation by cation or anion control. Optimum flocculation of turbidity- producing particles by zeta potential control is a critical aspect of municipal water treatment and purification systems. Some research areas related to zeta potential include studies of hardness and dislocation mobilities of rocks and other materials, understanding the nature of rock weathering, characterizing differences between minerals of similar chemical composition, studies of rock penetration by diamond indenters, and the use of chemical additives in drilling fluids.
With respect to chemical additives in drilling fluids, the Bureau found that optimized drilling performance could be obtained under zero zeta potential conditions. This zeta potential controlled drilling requires precise knowledge about the point of zero charge (PZC) concentration for a given fluid additive in relation to the rock being drilled. Because of the critical nature of this process, it was necessary to develop a way to accurately predict the PZC concentration for a given material-additive system. These results have also demonstrated that testing the zeta potential of ground particles does indeed represent the whole material zeta potential. At the PZC concentration demonstrated by the material particle tests, the performance of the drilling tests was maximized, as postulated by many researchers.
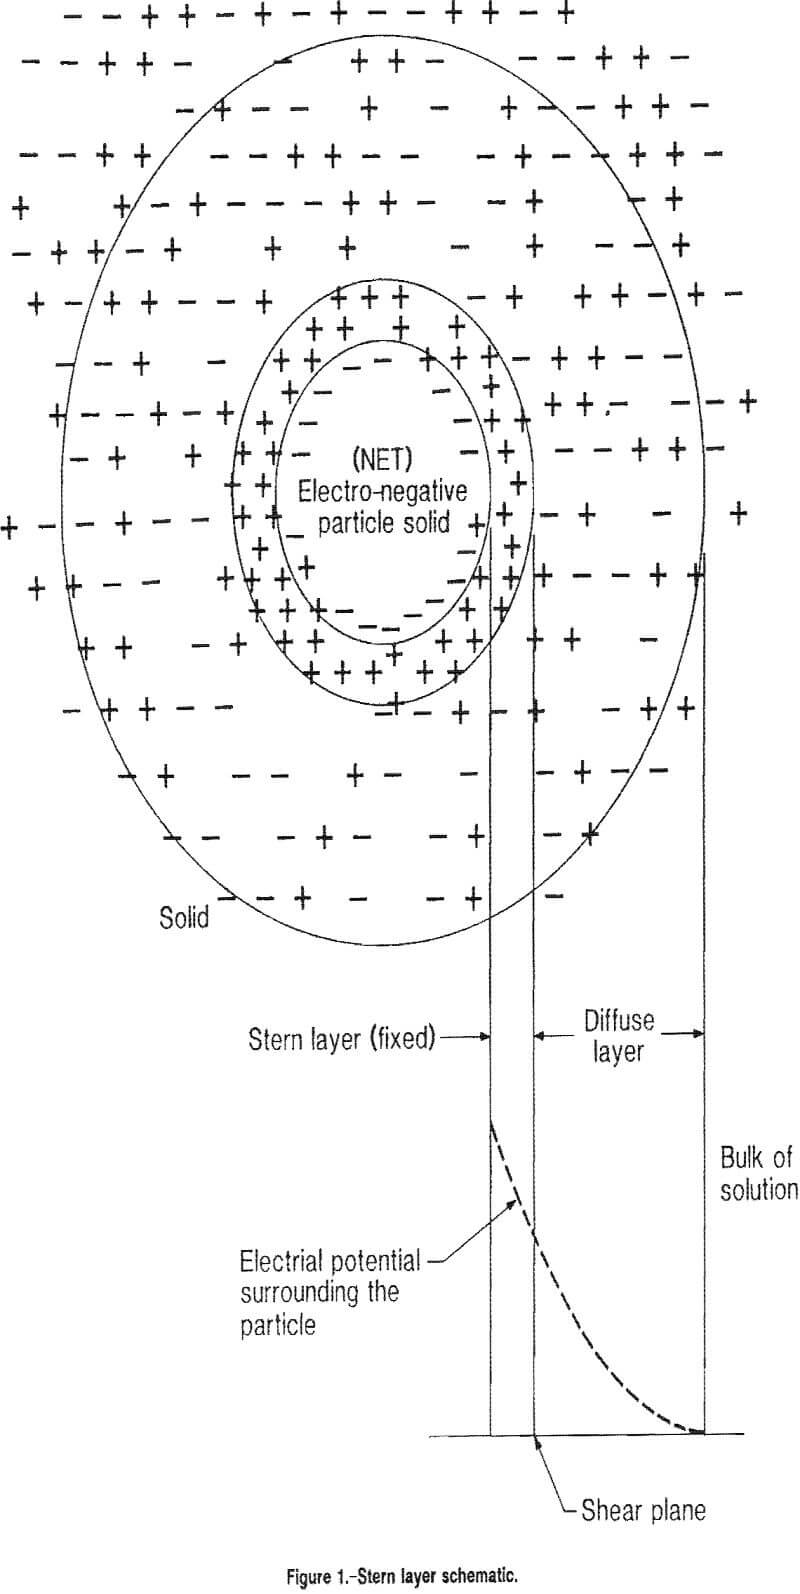
The Stern model of the electrical double layer of ions can be employed to explain the electrical equilibrium state set up around a solid in a liquid phase. In that model, the solid has a rigidly fixed electrical charge and the innermost layer of ions, called the Stern layer, is a practically immobile layer of oppositely charged ions in the liquid phase that are absorbed on the solid. Farther away from the solid, next to the Stern layer, is the mobile diffuse layer of ions, which is composed of mobile positively and negatively charged ions in the liquid phase. This layer may have a net charge of the same or opposite sign from that of the Stern layer.
The electrical potential difference that develops between the solid and the bulk solution (across the Stern and diffuse layers) is called the Nernst potential. This potential is the balance between the electrostatic attraction of the solution counter ions to the solid surface and their tendency to diffuse away from the surface. The potential drop that occurs across the diffuse layer is called the zeta potential and it is that potential that is readily varied through changes in bulk solution concentrations (see figure 1). As the zeta potential drops to zero, the diffuse layer thickness approaches zero and the Nernst potential drop occurs totally within the Stern layer. Under these conditions, a PZC or zero surface charge (ZSC) exists on the solid surface.
The zeta potential of materials in water of nearly neutral pH can be negative (usually the case) or positive (chrysotile and magnesium oxide). By adding cations or anions to the water, the magnitude of the charge on the material surface can be reduced until the zeta potential reaches zero. Continued addition of cations or anions will result in a zeta potential of increasing magnitude and opposite sign.
The procedure developed by the Bureau and described herein is a unique and novel approach for zeta potential determinations. Most of the older methods used for determining the zeta potential of any given material particle in a given solution rely on single tests of a unique fluid composition. If the PZC concentration is to be known, several separate and discrete tests must be performed and the PZC concentration determined by interpolation, or worse by extrapolation. If there are any contaminants or foreign particles present during any single test, repeatable results may not be obtained in subsequent tests if the same contaminant is not present or if other contaminants or foreign particles are present. In the technique described in this report, the zeta potentials can be determined for a complete range of additive concentrations with the same contaminant levels being present at all the additive concentrations. By adding small known increments of additive to the closed system, the PZC concentration can be precisely determined in a simple calculation and subsequent graphing procedure.
Experimental Laboratory Procedure
Zeta Potential Test Equipment
The procedure for determining the zeta potential was the same regardless of the chemical additive or the water (distilled, deionized [DDIW]; tap; or mine) used for a baseline fluid. The same commercially available electrophoretic mobility-type apparatus was used for all the tests.
The electrophoretic apparatus operates on the basis that the surface charge of a material particle is proportional to the speed of the particle in a fluid in an electric field. The zeta potential for each fluid concentration increment was determined by following the movement of an individual material particle across a monitor screen in an electric field of 10 V/cm, matching the speed of a grid line on the screen to the particle speed, and noting the zeta potential as displayed on the digital readout. When using calcium chloride (CaCl2), magnesium sulfate (MgSO4), or sodium chloride (NaCl), the required high ionic strength led to electrolysis at 10 V/cm, therefore, 5 V/cm was used, with no loss of accuracy.
Zeta potential values are temperature sensitive, which the zeta reader instrument accounts for in calculating the resulting, displayed zeta potential. All of the tests were conducted at room temperature, and the zeta reader was consistently between 25° and 40° C. The temperature values were noted for each test to assure that the test was conducted within that temperature range.
A plastic beaker was used as the fluid-material particle reservoir for all of the tests in order to prevent erroneous values resulting from possible adherence of ions to a glass beaker. The baseline fluid-particle mixture was kept in suspension with a magnetic stirrer. However, when a magnetic (or suspected magnetic material) was tested, a stirring propeller (“milkshake” stirrer) was employed to prevent biasing the zeta potential results to nonmagnetic particles resulting from removal of magnetic particles by attraction to the magnetic stir bar. In fact, a few materials that were not originally thought to be magnetic proved to be; and those tests were repeated using the milkshake stirrer.
Zeta Potential Test Procedure
In preparation for each test, the zeta reader was cleaned by flushing ultrapure distilled, deionized water (DDIW) through the system until no particles were observed on the monitor screen and the specific conductance read <10 µS/cm. After thoroughly cleaning the plastic beaker, 1,000 mL of fresh baseline water was put in it and the appropriate stirring system employed. The apparatus intake and outflow tubes were placed in the water and the stirrer was started. Next, approximately 0.2 g of minus 100-mesh crushed material particles was added to the baseline water. In the few cases (most notably Wausau quartzite) when the particles were very difficult to detect on the screen because of low optical density (semitransparent), 0.5 g of particles was added to make the tracking of particle movement easier.
Thirty zeta potential determinations were made for material particles in the baseline water system. After this test was completed, a precise amount (0.01 to 1.0 mL) of the test additive was added to the system from a concentrated stock solution, and again 30 zeta potential readings were made. Incremental additions of concentrated stock solution and zeta potential determinations were continued until the zeta potential value was positive for several concentrations or until a relatively high concentration of additive was added without attaining a positive zeta potential reading, i.e., the zeta potential remained at or very near to zero or the zeta potential remained constant.
For magnesium oxide (MgO) brick, the zeta potential of particles in DDIW is positive below a pH of 12.4. For those tests, the procedure was identical to that described, except that the MgO zeta potential in DDIW was initially positive and changed to negative with incremental additions of an anionic additive. In tap water, however, the normally positive charge of MgO was more than neutralized by adsorbed anions from the tap water; the resulting initial zeta potential being negative as with most materials.
Three separate tests were performed for each cationic additive. Because there was no PZC concentration to be determined, only one test was performed for the anionic and nonionic additives to indicate performance trends.
Zero Surface Charge Concentration Determination
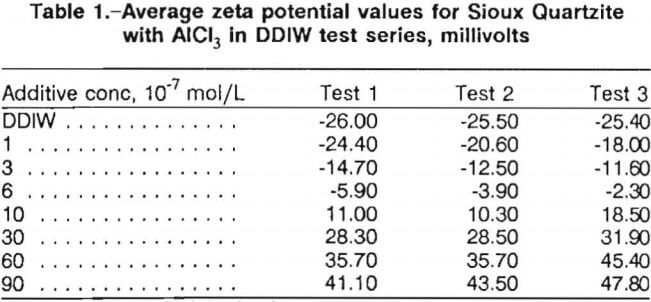
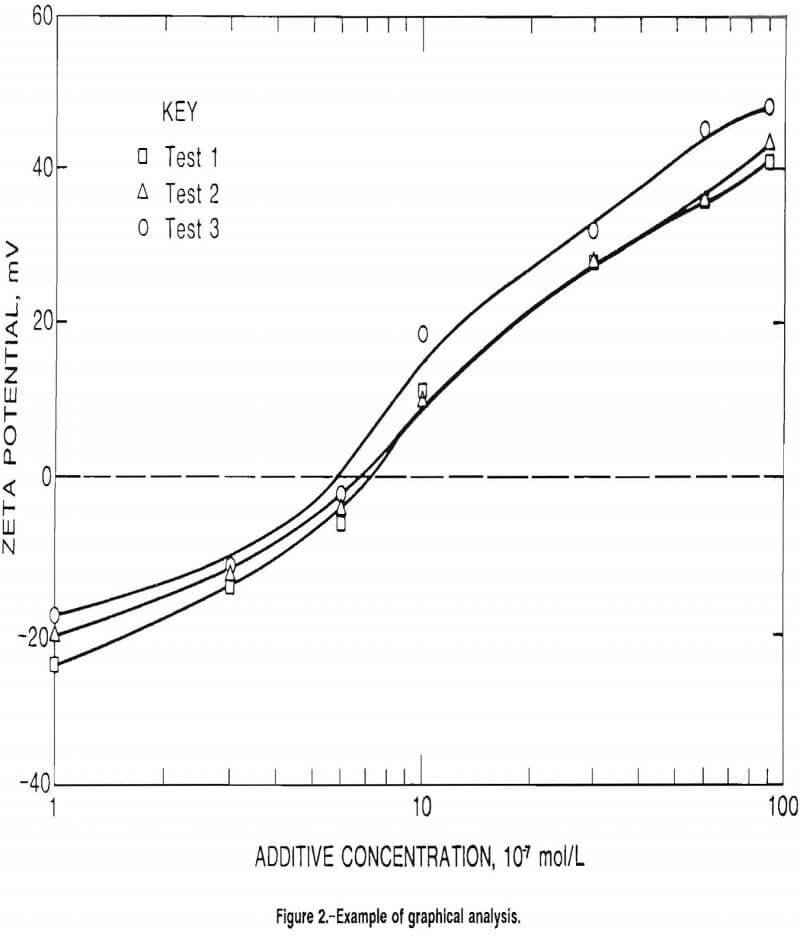
PZC concentrations were determined using the following procedure. The 30 zeta potential determinations made in the baseline water and each additive concentration were respectively averaged. These average zeta potential values were then plotted as a function of additive concentration. Table 1 lists the average zeta potential values for the series of tests for Sioux Quartzite with aluminum chloride (AlCl3) in DDIW. These values (in millivolts) were plotted versus AlCl3 concentration (in moles per liter). The best curve was drawn through the points of each test using a curve-fitting program, and the concentration where the curve crossed the zero zeta potential line was taken as the PZC concentration. Figure 2 illustrates these curves for the Sioux Quartzite-AlCl3-DDIW system.
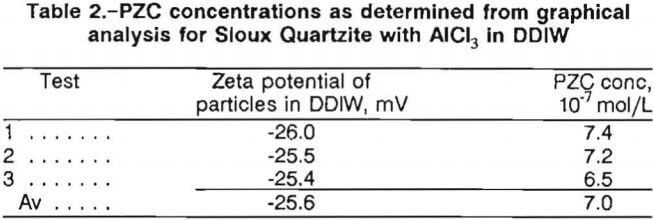
For cationic additives, PZC concentration values were determined for each of the three replicate tests and then averaged to get a single PZC concentration for each material-additive system. Table 2 lists the average zeta potential values and the average PZC concentration for the Sioux Quartzite-AlCl3-DDIW system. This procedure was followed for all of the cationic additive tests.
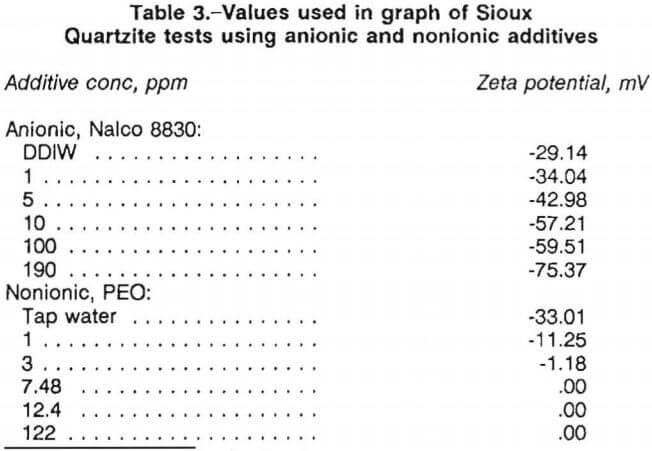
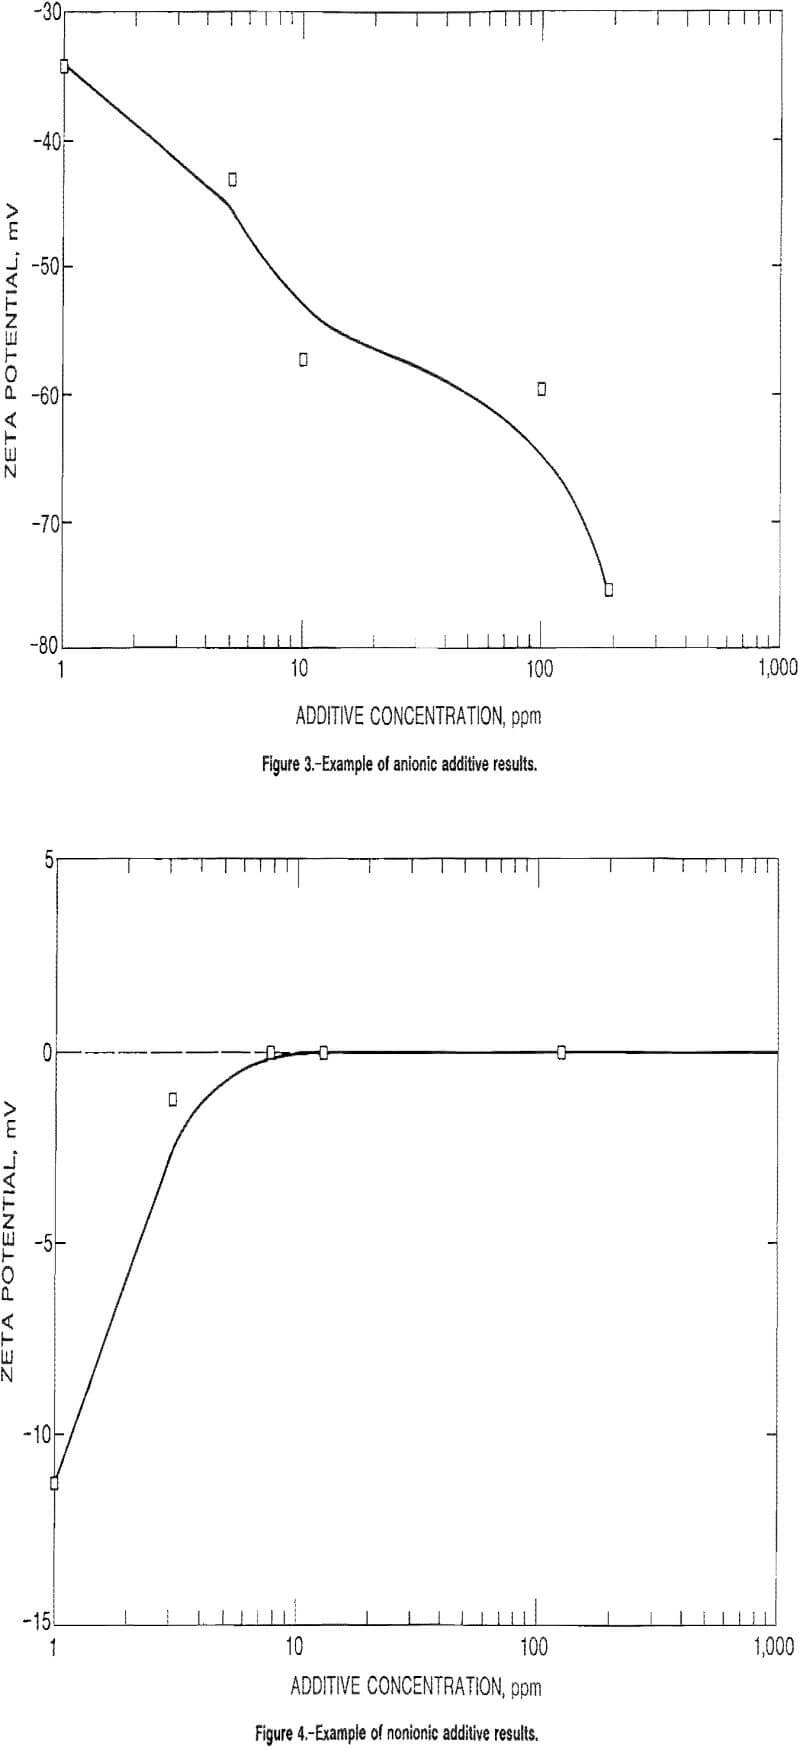
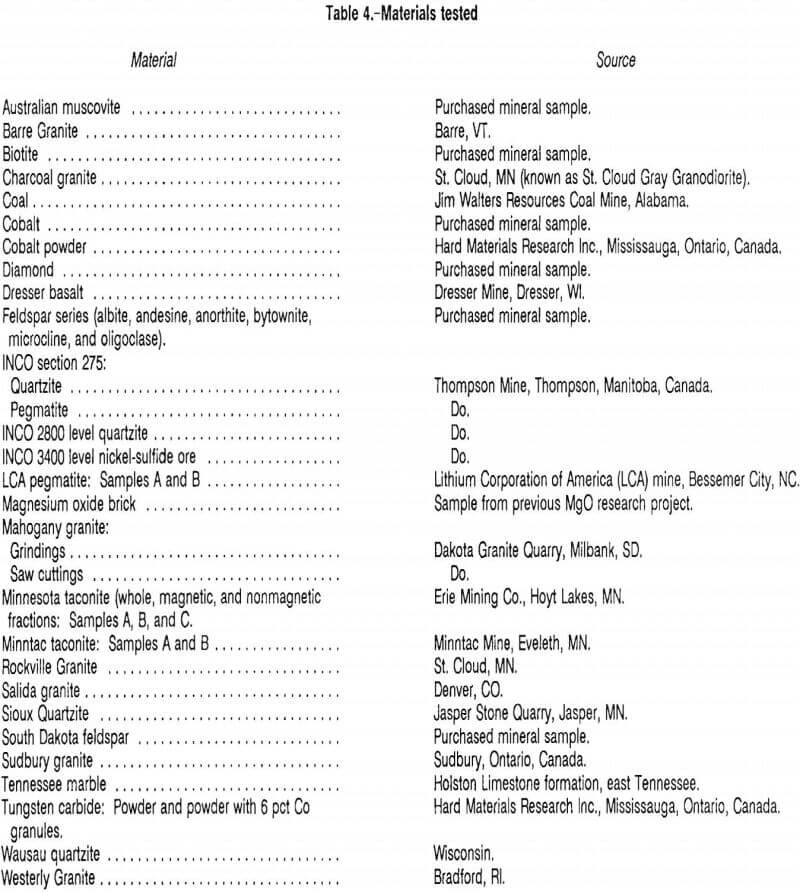
For anionic and nonionic additive tests, the graphing procedure was similar. The average zeta potential values for the single test were plotted versus additive concentration. Figure 3 is a representative graph for the results of Sioux Quartzite in the anionic surfactant, Nalco 8830, while figure 4 illustrates the results for Sioux Quartzite using the nonionic polymer, polyethylene oxide (PEO), with the values used in plotting the curves in these two figures listed in table 3.
Results and Discussion
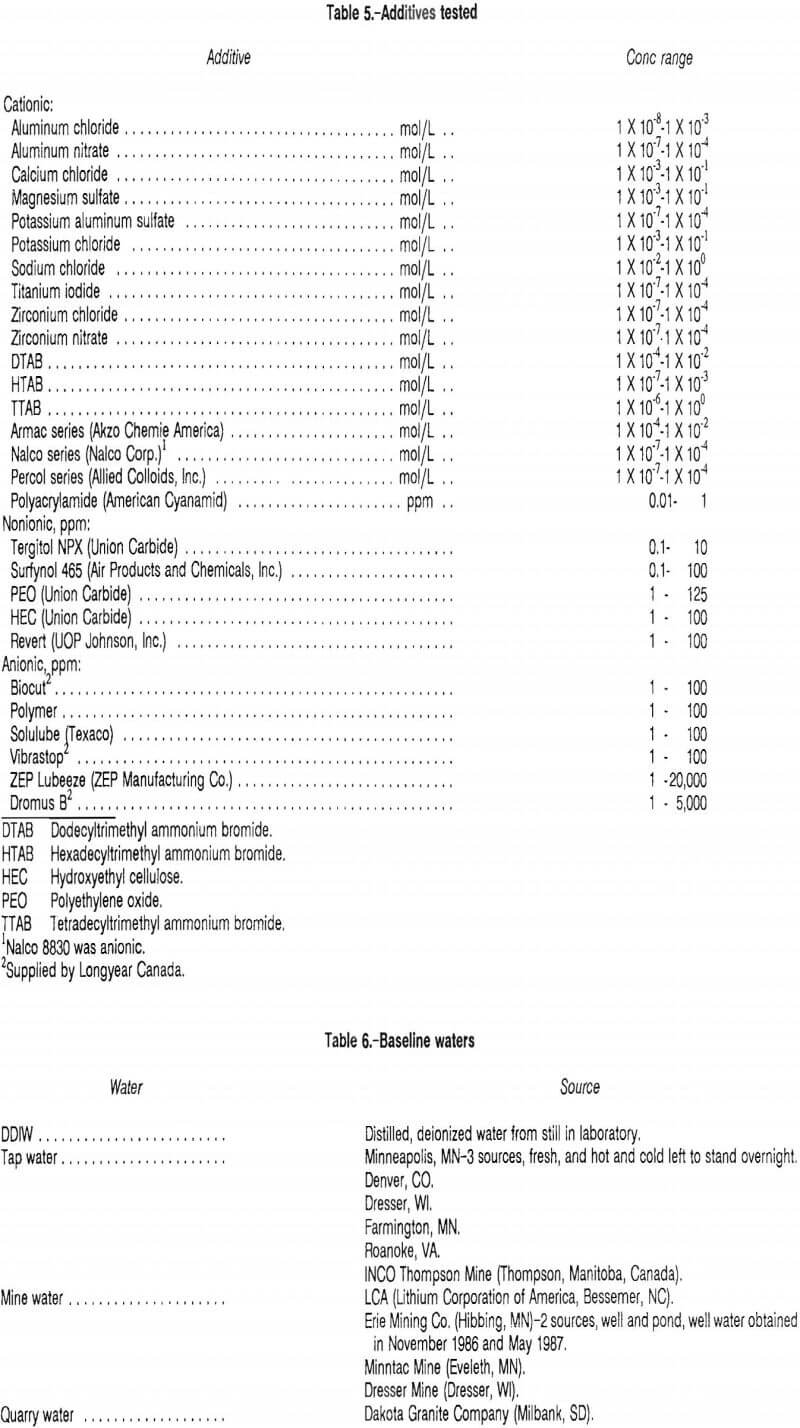
The wide variety of materials, the diverse series of chemical additives, and the baseline waters used in these tests are listed in tables 4, 5, and 6, respectively. Test results and additional information is contained in the appendix. Table A-1 compiles the zeta potential tests performed for each additive categorized by material type, while table A-2 lists the same data for each material tested, categorized by chemical additive. Table A-3 is a compilation of the chemical analyses for the waters tested; table A-4 lists the oxide content of the materials tested; and table A-5 describes the special materials of coal, diamond, and cobalt. These tables are presented to explain the differences between the subsequent zeta potential results for the materials. The zeta potential and PZC values for cationic and anionic additives are listed by material type in table A-6 and by additive in table A-7. Table A-8 lists the pH modified zeta potential tests, table A-9 lists the cationic nonionic, and anionic results for Sioux Quartzite and the anionic results for Mahogany granite, table A-10 lists nonionic PEO results, table A-11 lists the results when using combinations of anionic additives with PEO, and table A-12 lists the results when using an excess of additive.
In comparing the results of these tests, several important and interesting correlations can be made from several critical factors in the zeta potential and PZC concentration determinations. These factors are water quality, material composition, inorganic additive cation valence, organic additive carbon-chain length, the effect of anionic and nonionic additives, the effect of anionic plus nonionic additive combinations, and the effect of excess cations on the zeta potential. These results given in the tables are discussed in the following sections.
Effect of Water Quality on PZC Concentration
With respect to water quality, the purer the water, the lesser amount of additive needed to neutralize the material surface charge and achieve the PZC condition. For example, in comparing DDIW and Minneapolis tap water results for Sioux Quartzite with AlCl3, the PZC concentration for DDIW was 7.0 x 10 -7 mol/L, while with tap water it was 4.5 x 10 -5 mol/L. The naturally occurring anions in the relatively hard and chemically treated Minneapolis tap water adsorb onto the material surface and drastically change the amount of Al+3 required to reach the PZC condition (tables A-6 and A-7). Because of the critical nature of water quality as demonstrated by these results, chemical analyses were conducted for all the waters tested. These analyses are listed in table A-3. The quality of the water will be a major determining factor in the zeta potential and ultimate PZC concentration. This phenomenon was observed in all the material-additive combinations tested in varying baseline waters (tables A- 6 and A-7).
For Al3+ ions, water pH is also important because of the propensity of Al3+ ions to precipitate and flocculate as Al(OH)3 above a certain pH. Several tests were conducted that used acid (HCl) to lower the pH of the water to a level where the Al3+ ion was stable in solution. The presence of the acid markedly affected the PZC concentration for all the materials tested in AlCl3, as was evident when comparing the PZC concentration values for Sioux Quartzite in tap water. Without pH modification, when the water was at pH of 7.0 to 8.0 the PZC concentration was 4.5 x 10 -5 mol/L. However, with addition of HCl to keep the pH below 4.0, the PZC concentration rose to 1.17 x 10 -4 mol/L. Table A-8 lists the results for this series of tests using tap or mine water and AlCl3 with pH modification to below 4.0.
Effect of Material Composition on PZC Concentration
It has been suggested in discussions with other researchers that the zeta potential for any material type would be very consistent; i.e., any granite would react the same to any specific additive. However, this research has shown that the zeta potential and PZC concentration values are critically related to specific material composition, in addition to water quality.
In tests of several different granites, the zeta potential and PZC concentrations in the same water with the same additive were quite different. The zeta potential for Charcoal granite in DDIW was -25.20 mV, while that for Westerly Granite was -18.20 mV. The resulting PZC concentrations were 1.40 x 10 -6 and 7.26 x 10 -7 mol/L, respectively. Even the slight difference in chemical composition between these two granites of similar mineralogy made a considerable difference in the zeta potential and PZC concentration.
This phenomenon was observed for all material types tested (tables A-6 and A-7) since they are composed of differing minerals and materials making up the whole material. Because of this factor, chemical analyses were obtained for most material particles tested to determine which minerals and oxides are present in each material (tables A-4 and A-5).
A separate series of tests was conducted on an artificial material substance, MgO bricks. Magnesium oxide is known to have a positive zeta potential in pure water below a pH of 12.4. These tests were conducted to see if zeta potential modifiers could also be used to approach and obtain the PZC condition if the initial zeta potential of the material was positive. Using an anionic surfactant (Nalco 8830) in DDIW, a PZC condition was realized at 2.15 x 10 -4 pct. When testing MgO brick in tap water, however, anions from the impure water adsorbed on the particles to give them negative surface charge just like the other materials with initial negative surface charge. Results of these MgO brick tests are summarized in tables A-6, A-7, and A-10.
Effect of Inorganic Salt Cation Valence on PZC Concentration
It is evident from a comparison of results for cations of different valances (tables A-6 and A-7) that, in general, the higher the cation valence, the more effective the cation will be in producing the PZC condition. The exception is Zr4+ ions which are not stable in aqueous solution and most likely react with an OH ion to form the Zr(OH)3+ ion in solution. Using Sioux Quartzite as an example, AlCl3 caused a PZC to occur at 7.0 x 10 -7 mol/L for DDIW. However, using CaCl2 in DDIW required much more additive, reaching the PZC at 1.6 x 10 -2 mol/L, while NaCl required 2.17 x 10 -1 mol/L. This phenomenon held true for all material-additive suites tested, as well as for all waters tested.
Because of an interest in other additives, and since most of the zeta potential tests concentrated on inorganic salts, a series of organic surfactants was also tested. Three long- carbon-chain surfactants were used: dodecyltrimethyl ammonium bromide (DTAB), tetradecyltrimethyl ammonium bromide (TTAB), and hexadecyltrimethyl ammonium bromide (HTAB). The resulting PZC concentrations for Sioux Quartzite in DDIW were 9.35 x 10 -4 mol/L for the 12-carbon DTAB, 7.23 x 10 -5 mol/L for the 14-carbon TTAB, and 1.56 x 10 -6 mol/L for the 16-carbon HTAB. In this case, the longer-chain additives behaved like the higher valence additives. This again held true for all the materials tested with these three additives (tables A-6 and A-7).
Effect of Anionic and Nonionic Additives on Zeta Potential
Another group of tests was conducted to determine the effect of anionic and nonionic additives on the material particles. As expected, the anionic additives produced a more negative zeta potential without attaining a PZC condition, while all but one of the nonionic additives produced no effect on the zeta potential at all. Table A- 9 lists the results for several anionic and nonionic additives in which the zeta potential never reached a zero value, with figure 2 illustrating the results.
The exception to those results was quite interesting and unique. Polyethylene oxide, being nominally nonionic and not expected to affect the zeta potential in any way, did achieve a ZSC concentration. In fact, the most interesting phenomenon is that the ZSC conditions remained constant after a certain concentration was reached, with the zeta potential not changing sign. Table A-10 lists these results for a large suite of materials in various waters. These results are illustrated in figure 3 for Sioux Quartzite in tap water and are representative for all materials tested.
Effect of Anionic Plus Nonionic Combinations on Zeta Potential
Because of the success the nonionic PEO demonstrated in neutralizing surface charge, combinations of anionic additives with PEO were tested. ZEP Lubeeze is a cutting oil currently used in cutting or sawing of granite slabs, while Dromus B is used as a lubricating oil in drilling operations. Because both of these anionic agents are currently used in cutting-drilling operations, it was of interest to see what effect, if any, the PEO would have when added to solutions at concentrations used in the field. While requiring a bit more than when used alone, the PEO nevertheless still neutralized surface charge. The results for the two combinations tested, varying anionic additive concentration as a baseline and adding PEO until neutralization occurred, are summarized in table A-11.
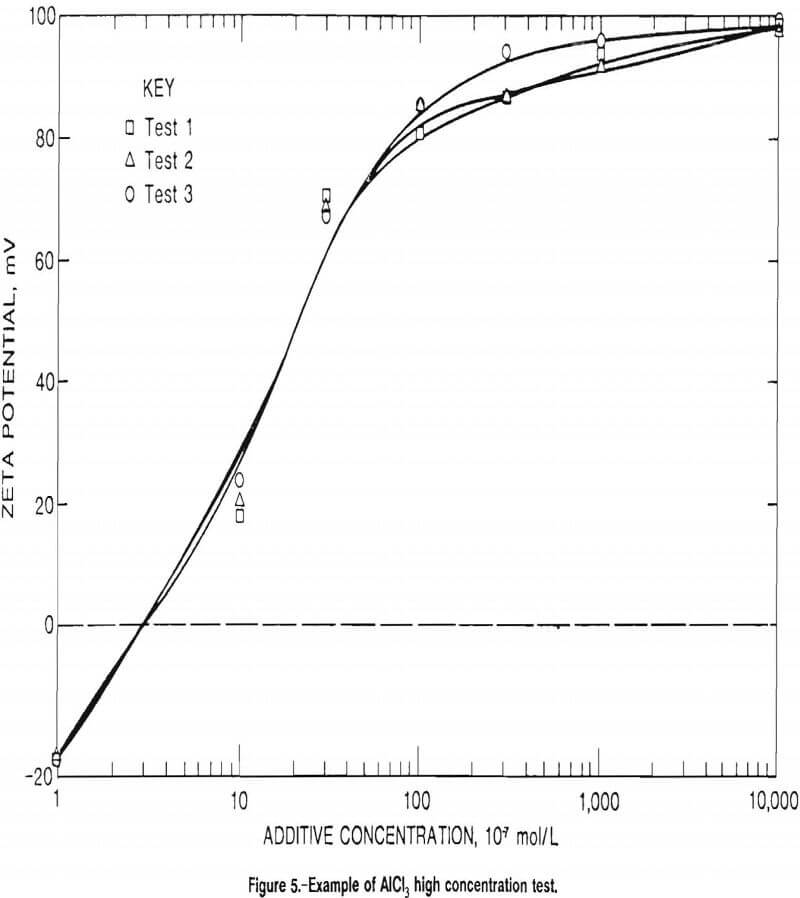
Effect of Excess Cationic Additive on Zeta Potential
The last test was conducted to see what effect, if any, very high concentrations (much stronger concentrations than required for the PZC condition) of cationic additive would have on the zeta potential and the PZC. Table A-12 lists the values for that test conducted to determine what those excess ions would do to the zeta potential for Sioux Quartzite with AlCl3 in DDIW; figure 5 illustrates the effect of those high zeta potential values. The excess ions only increased the zeta potential to a level that almost exceeded the limitations of the zeta reader, but did not create a measurable second PZC condition as had been predicted by surface science theory.
Conclusions
This novel technique for the determination of the zeta potentials and the resulting PZC and/or ZSC concentrations for materials in baseline water and additive solutions under many varied conditions should prove to be useful in other operations as well as in drilling, cutting, and grinding. Any needed zeta potential and/or PZC concentration values for a given system should be obtainable with the use of this closed-system technique and should prove to be very accurate, reliable, and repeatable. Any electro-phoretic mobility-type zeta potential equipment can be adapted to this technique. The zeta potential and PZC concentration values in this report, and the noted variations in the values because of changes in additive and/or baseline waters, should further the understanding of how to control zeta potentials in many processes.
Several conclusions can be drawn from the zeta potential results by comparing the diversity of effect on the zeta potential caused by water quality, material type, cationic additives, anionic additives, and/or nonionic additives. The critical effect of each of these parameters must be considered when determining zeta potentials and predicting PZC concentrations for any chemical additive-material system. Generalizations and close approximations can be made regarding the response of any particular material and/or additive in a zeta potential experiment. However, when precise or accurate zeta potentials and/or PZC concentrations are required, special care must be exercised. The use of the closed-system and graphing technique should yield those precise values required by the experimenter.