Gravity Separation of Heavy Minerals
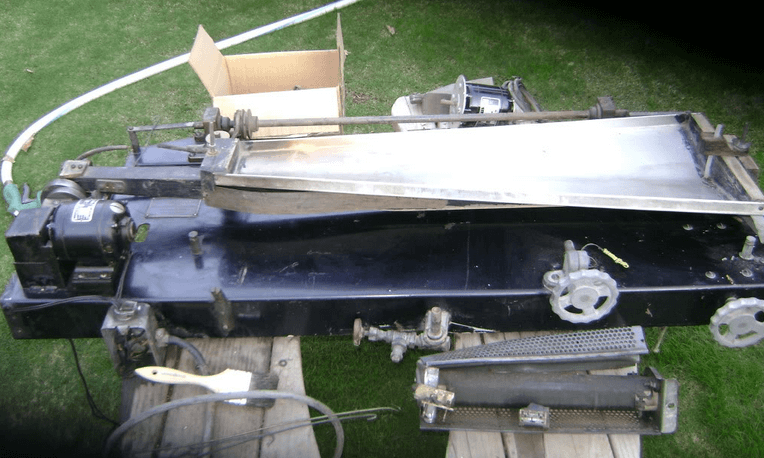
To perform Gravity separation of heavy minerals in the range 600 microns to 12 microns and to simulate gravity recovery performance on a sample hoping recovery and grade achieved can by higher than in plant operation, will let you analyze the grade/recovery curves permitting a relative assessment of performance. You will use a superpanner as […]
Laboratory Magnetic Separator & Test Procedure
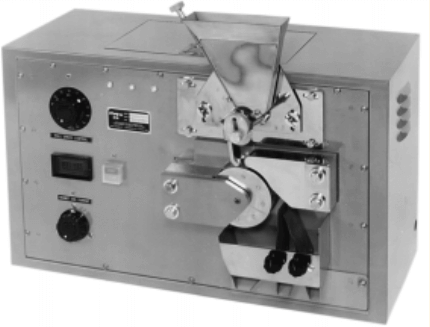
This Laboratory Magnetic Separator is a high intensity dry device which uses a rotating iron disc to concentrate the magnetic field and remove the magnetic particles from the non-magnetic. It essentially consists of an electromagnet (the applied current is controlled by a rheostat) which produces a magnetic field across the air gap and a belt which […]
Magnetic Separation Method
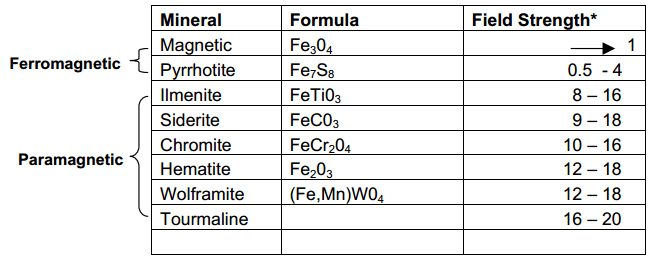
Magnetic separation is a process used to separate materials from those that are less or nonmagnetic. All materials have a response when placed in a magnetic field, although with most, the effect is too slight to be detected. The few materials that are strongly affected (magnetised) by magnetic fields are known as “Ferromagnetics”, those lesser […]
Heavy Media Analysis – Ericsson Cone Separator
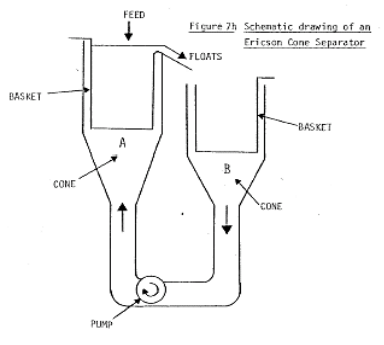
Where large samples (both in top size and weight) have to be examined it is not practical to use heavy liquids (being both expensive and time consuming). A laboratory heavy media separator may be used which simulates the action of a heavy liquid bath. Here is a schematically shows an Ericsson cone separator. Sized fractions of […]
Specific Gravity Distribution (Tolerance) Curves
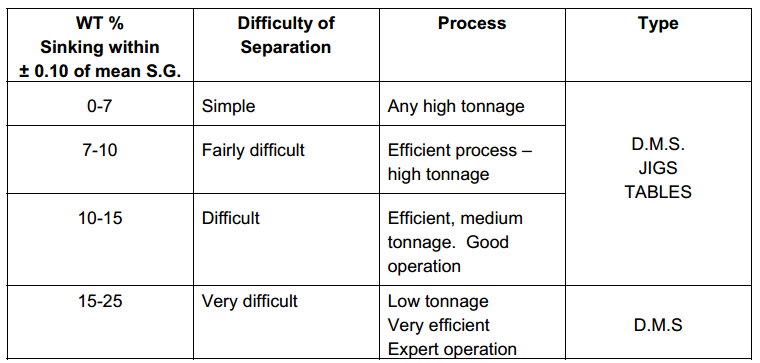
The three types of curve described so far completely define the behaviour of the material in a heavy liquid under ideal sink-float conditions. In practice, we wish to use the data to predict the performance of a commercial process such as D.M.S., Jigs, Tables, etc. In these processes, the S.G. of separation will vary between […]
Characteristic of Elementary Assay Curve
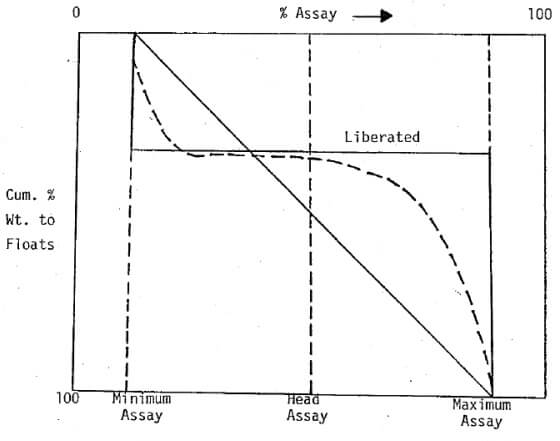
The incremental assays obtained for each S.G. are plotted against the average cumulative % weight of sinks and floats. This curve shows the assay of the richest particles in a float or sink. If it is used in conjunction with the cumulative assay of floats or sinks curve, it indicates the spread of assay values obtained […]
Cumulative % Assay of Floats or Sinks Curve
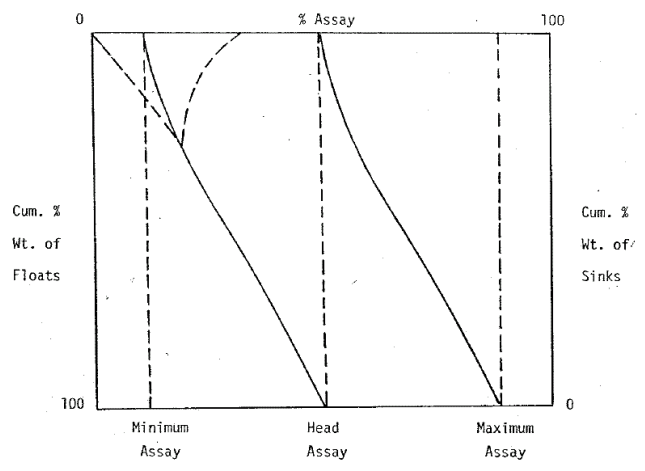
The cumulative % assay of the floats or sinks is plotted against the cumulative % weight of the floats or sinks. These curves indicate cumulative assay that the cumulative floats or sinks will have at a particular S.G. of separation. They are used in conjunction with the S.G. curve and can thus predict the weights […]
Washability Curves
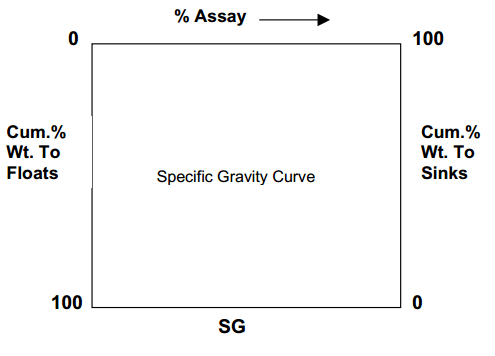
Heavy liquid data can also be interpreted by washability curves. To plot these curves, the axes shown here. The cumulative % wt. Floats or sinks is plotted against S.G. If the material consists of two minerals completely liberated from each other, the curve will be a stepped line. The width of the step indicates […]
Tromp Curve – Example of Partition Curve
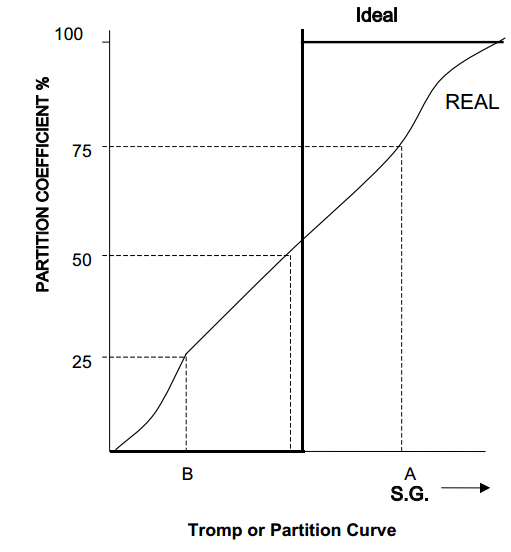
As may be seen from the table, a separation at S.G. 2.75 would result in a float product of 68.5% of the weight contain 3.8% of the tin of that size fraction. Laboratory separations in heavy liquids are “ideal” – all the sinks should report to the sinks and all the floats to the floats. […]
Drop Weight tests using JKMRC Rotary Breakage Tester
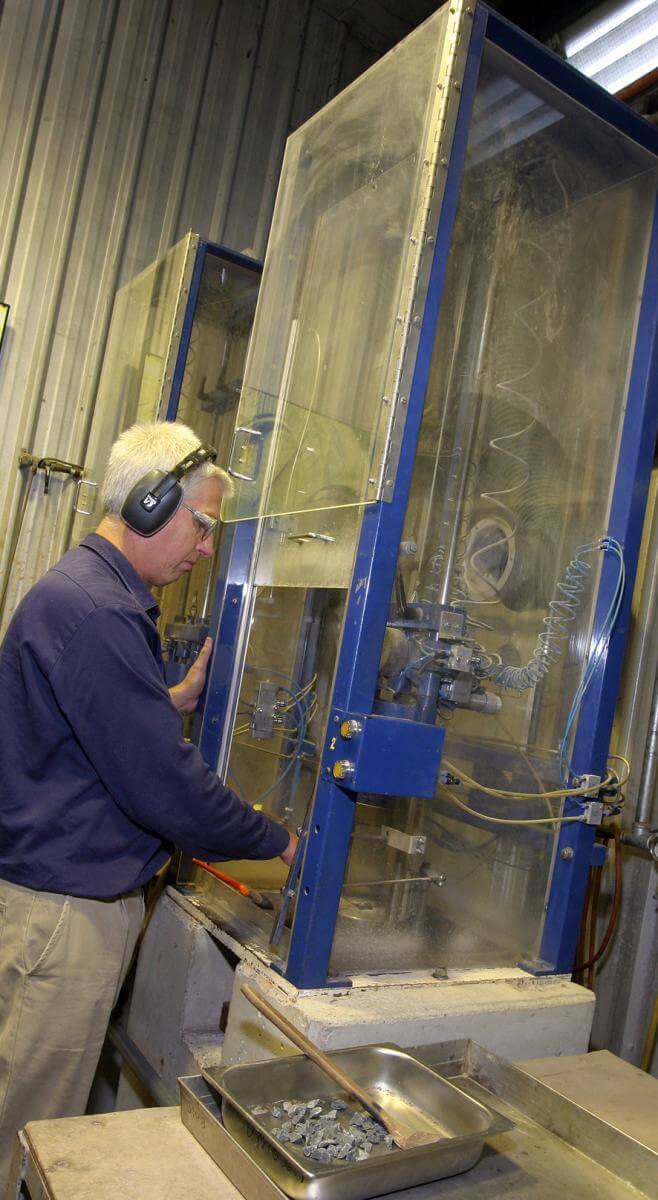
The Drop Weight tests (DWT) by JK is now replaced by the JKMRC Rotary Breakage Tester. It is faster as confirmed by Tony and now used by many since its intro https://www.min-eng.com In an AG/SAG mill there are two main mechanisms of breakage, namely impact (high energy) and abrasion (low energy). The industry accepted JK impact breakage parameters, […]
