Table of Contents
The four nomograms presented in this method were designed to simplify and make more, rapid the calculations connected with the compression and transmission of air. The formula involved are rather complicated, but the graphic solutions are simple; their use requires an ability to follow explicit directions and to interpolate values on a logarithmic scale. For the sake of convenience, the nomograms will be divided into two classes, and the purpose and accuracy of each will be discussed.
Compression
It is frequently desirable to determine the horsepower necessary to compress a given amount of free air from atmospheric pressure to a certain final pressure. The nomograms in Figs. 1 and 2 present a rapid method of calculating the horsepower required to compress 1 cu. ft. of free air per minute by single or two-stage compression. The general formula for the horsepower required to compress air adiabatically is:

where:
P = absolute atmospheric pressure at compressor, in pounds per square inch.
P’ = final absolute pressure of compressed air, in pounds per square inch.
V = volume of free air compressed per minute, in cubic feet.
S = number of stages.
n = exponent of the compression curve.

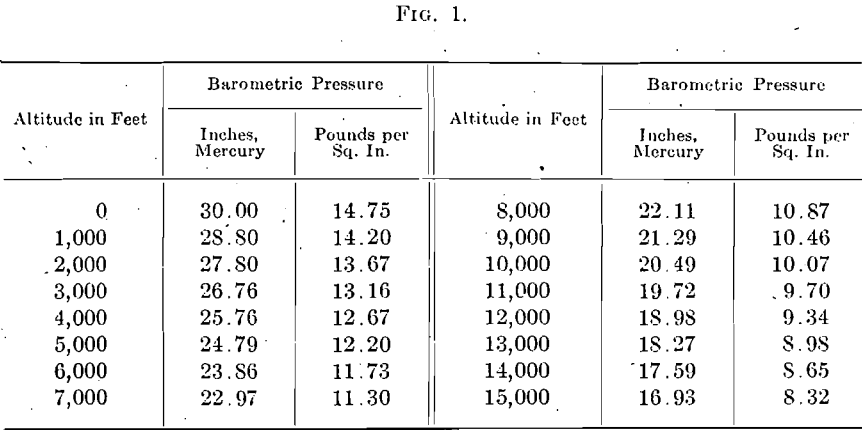
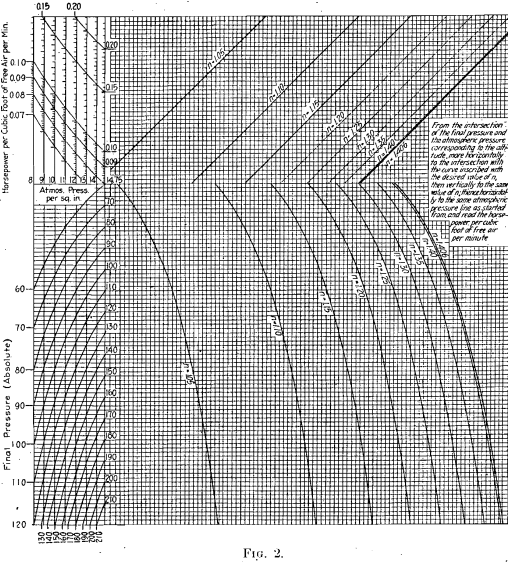
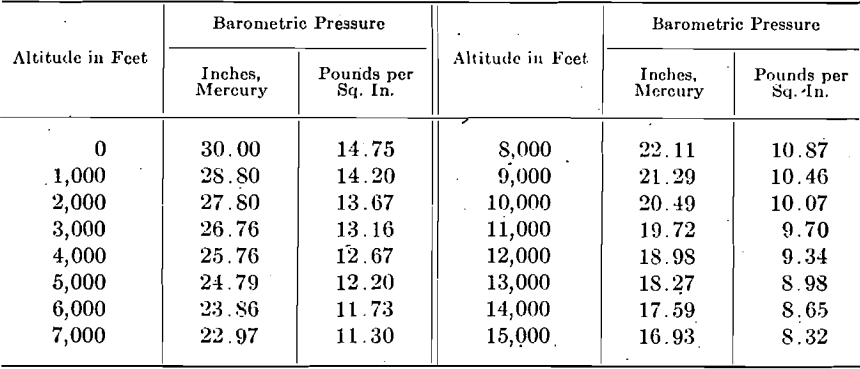
The exponent n is the ratio between the specific heat of air at constant pressure and its specific heat at constant volume. For theoretical adiabatic compression n = 1.406. The value of n in actual compression varies with the design of the compressor and the efficiency of the cooling arrangements. In well-designed single-stage dry compressors, the value of n ordinarily lies between 1.25 and 1.35. Well-designed two-stage compressors give values of n as low as 1.15, though 1.20 to 1.25 is more common. Additional values of n have been added on the nomograms for the sake of completeness. Values of P for different altitudes are given in the tables accompanying Figs. 1 and 2.
Directions for using Figs. 1 and 2 are printed on them. It should be noted that the scale for the horsepower per cubic foot of air starts from a different ordinate for each value of P. Formula (1), of course, makes no allowance for the mechanical losses in the compressor.
Speed and Accuracy
To test the diagrams, six problems have been taken at random as shown in Tables 1 and 2. They were solved first by the use of Figs. 1

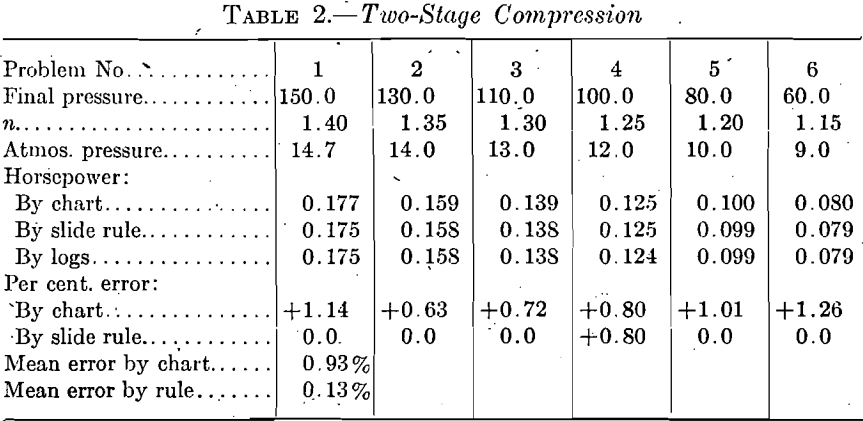
and 2 and then by means of a 20-in. slide rule applied to formula (1). The average time required to solve a problem with the diagrams was 1 min. 45 sec. as compared to 3 min. 45 sec. for the slide rule. The mean error in these calculations, disregarding + and — values, was 1.15 per cent, for the graphic solution and 0.28 per cent, for the slide rule.
Transmission
Fig. 3 gives a graphic solution of D’Arcy’s formula for the transmission of compressed air in pipes. This formula is:

where:
D = the volume of compressed air in cubic feet per minute discharged at the final pressure.
c = a coefficient varying with the diameter of the pipe, as determined by experiment.
d = actual diameter of pipe in inches.
l = length of pipe in feet.
P1 = initial gage pressure in pounds per square inch.
P2 = final gage pressure in pounds per square inch.
W1 = the density of the air, or its weight per cubic foot, at initial pressure.
The nomogram, Fig. 3, allows the solution of this equation without reference to tables for values of c√d5 and √P1 – P2/W1 which are ordinarily used for this purpose.
The following cases may arise in connection with the transmission of compressed air through pipes:
- Given the volume of compressed air, the length of pipe, the initial pressure, and the maximum allowable drop in pressure; required, the diameter of the pipe.
- Given the length of pipe, the diameter of pipe, the initial pressure, and the maximum allowable drop in pressure; required, the volume of compressed air which the pipe will carry.
- Given the diameter of the pipe, the volume of compressed air, the initial pressure, and the maximum allowable drop in pressure; required, the maximum length of pipe of the given diameter which can be used under these conditions.
- Given the diameter of the pipe, the volume, of compressed air, the length of pipe, and the maximum allowable drop in pressure; required, the pressure at which the air must enter the pipe.
- Given the diameter of the pipe, the volume of compressed air, the length of pipe, and the initial pressure; required, the drop in pressure.
The graphic solution of each of these problems maybe obtained from Fig. 3 as follows:
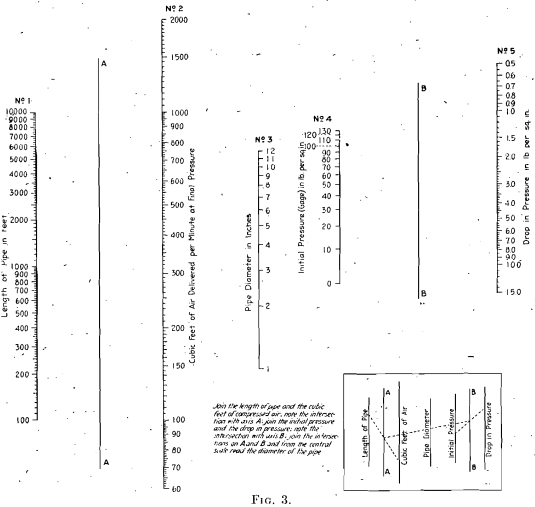
Case 1.—With a straight edge, join the length of pipe and the cubic feet of compressed air (not free air); note the intersection on axis A; join the initial pressure with the drop in pressure; note the intersection on axis B. A line joining, the two points on A and B will intersect scale number 3 at the required pipe diameter.
Case 2.—With a straight edge, join the initial pressure with the drop in pressure, note the intersection on axis B; join the intersection on B with the diameter of the pipe; note the intersection on axis A. A line joining this point on A with the length of pipe will intersect scale number 2 at the required volume of compressed air.
Case 3.—With a straight edge, join the initial pressure with the drop in pressure; note the intersection on axis B; join the intersection on B with the diameter of the pipe; note the intersection on axis A. A line joining this point on A with the given cubic feet of compressed air intersects scale number 1 at the required maximum length of pipe.
Case 4.—With a straight edge, join the length of pipe with the volume of compressed air; note the intersection on axis A; join the intersection on A with the diameter of the pipe; note the intersection on axis B. A line joining this point on B with the allowable drop in pressure intersects scale number 4 at the required initial pressure at the entrance of the pipe.
Case 5.—With a straight edge, join the length of pipe with the volume of compressed air; note the intersection on axis A; join the intersection on A with the diameter of the pipe; note the intersection on axis B. A line joining this point on B with the given initial pressure will intersect scale number 5 at the required drop in pressure.
Speed and Accuracy
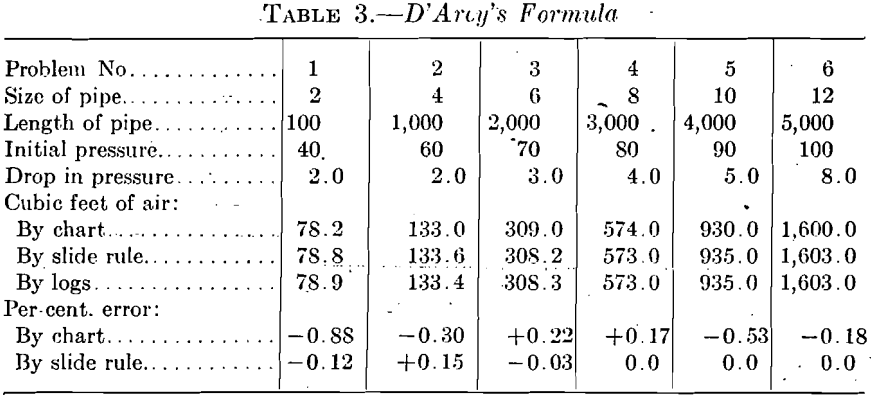
The six problems given in Table 3 were worked out to test this nomogram. An average time of 1 min. 45 sec. was required to solve a problem using a 20-in. slide rule in connection with the tables published in Peele’s Compressed-Air Plant. These same problems were solved by the nomogram in an average time of 1 min. The mean error of the nomogram is less than 0.5 per cent, as shown by Table 3.
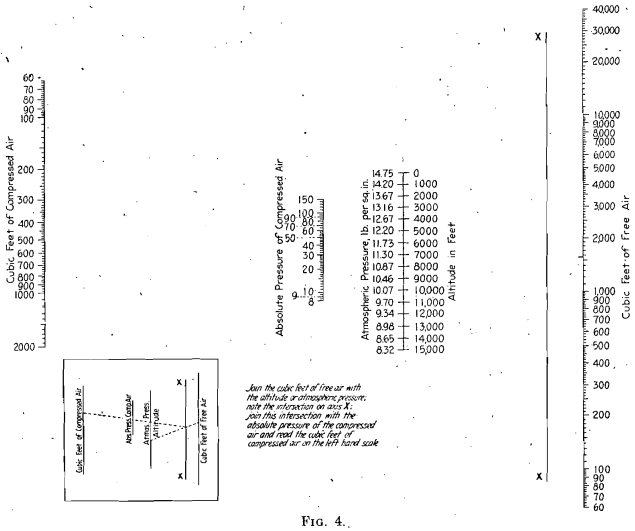
Many of the data on the capacity of air compressors and the air consumption of rock drills or other machines are expressed in terms of cubic feet of free air. The volume of compressed air to be transmitted must be known before the nomogram for D’Arcy’s formula, Fig. 3, can be used. Volumes of free air at different altitudes can be converted into corresponding volumes of compressed air at different absolute pressures by means of nomogram on Fig. 4. This diagram is based on the equation:
pv = p’v’
where:
p = initial absolute (atmospheric) pressure in pounds per square-inch.
v = initial volume of air in cubic feet.
p’ = final absolute pressure of compressed air in pounds per square inch.
v’ = volume of compressed air in cubic feet.
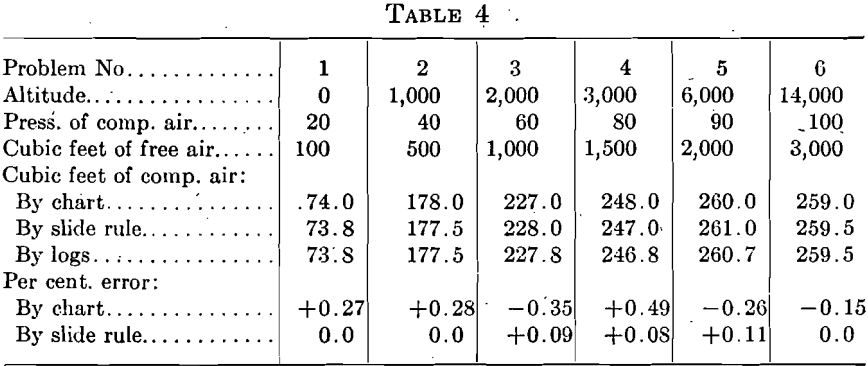
The accuracy of this chart as compared to calculations with a 20-in. slide rule and with logarithms is shown by Table 4.
The figures given above for speed of work with Figs. 1, 2, and 3, as compared with the slide-rule work, do not indicate the true value of the nomograms. The problems were worked out at a time when the author had been using equations (1) and (2) and was entirely familiar with their terms and their algebraic solution. At a later date, when he had become somewhat rusty perhaps both in his mathematics and his knowledge of compressed air, the graphic solution would take relatively much less time and be more apt to give numerically correct results.
In conclusion, the author desires to give credit to Prof. H. L. Seward for many helpful suggestions regarding the construction of the nomograms and to Prof. J. F. McClelland for kind assistance in the preparation of this article.
