Table of Contents
The results of investigative work on chemical, optical emission spectrochemical, and X-ray spectrographic methods were presented. Of the two chemical methods studied, the iron reduction method is superior in both time required for an analysis and in the detection limit, and the precision is quite satisfactory for the concentration and impurity range studied. The optical emission spectrochemical methods investigated were unsatisfactory in the 0.01 and 1.0 percent tin range. However, a satisfactory method was developed for the 10- to 100-p.p.m. range. The precision of the X-ray spectrographic methods is satisfactory and these methods are recommended for use when the equipment is available.
Research undertaken by the Bureau of Mines in 1938 has resulted in the development of titanium from a laboratory curiosity to a commercial metal. Along with processes for producing the metal, it was necessary for the Bureau to develop methods for analyzing the metal, raw materials, and intermediate products. Some of the methods developed have been published.
General Services Administration (GSA) was responsible for purchasing titanium metal under Defense Production Act contracts with commercial producers. GSA designated the Federal Bureau of Mines to analyze this metal and establish its compliance with Government .specifications. A substantial quantity of tin was found in some of the samples analyzed, and in July 1957 tin was added to the list of impurity elements to be determined. The specifications limited the amount of tin in titanium sponge to a maximum of 0.10 percent. A program was immediately initiated to investigate methods and techniques for determining tin in the range of 0 to 1.0 percent. A method accurate at the 0.10 percent level was necessary, as this level was the critical range for acceptance or rejection of the metal.
The program included investigation of wet chemical, spectrochemical, and X-ray spectrographs methods. Modifications of two chemical methods were satisfactory. The iron reduction method was acceptable in the 0.01- to 1.0- percent range and the lead reduction method in the 0.03- to 1.0-percent range. Emission spectrochemical investigations resulted in the development of a satisfactory method for the 10- to 100-p.p.m. range. The main part of the report was devoted to a new method using a fluorescent X-ray spectrograph. This method was extended to cover the range of 0.004 to 50.0 percent tin in titanium.
Chemical Methods
Iron Reduction Method
Summary
The sample was dissolved with dilute sulfuric and fluoboric acids, and the titanium was oxidized with hydrogen peroxide. Tin was reduced with iron metal powder and determined by titration with a standard solution of iodine. The normal impurities found in titanium sponge do not interfere. The concentration range investigated was 0.01 to 1.0 percent tin.
Reagents
- Fluoboric acid, 48 percent.
- Sulfuric acid (1:1).
- Hydrogen peroxide, 30 percent.
- Antimony trichloride solution, 1 percent – dissolve 1 g. of SbCl3 in 20 ml. of HCl and dilute to 100 ml. with water.
- Sodium bicarbonate solution, 10 percent.
- Soluble starch solution, 1 percent.
- Iron powder, reduced by hydrogen.
- Standard iodine solution, 0.02 N. (Note 1.)
- Hydrochloric acid, concentrated, 10. Marble chips.
Procedure
- Weigh a 2-g . sample of titanium metal into a 500-ml, Erlenmeyer flask.
- Add 100 ml. of water, 20 ml. of sulfuric acid (1:1), and 10 ml. of fluoboric acid.
- When the sample has dissolved, add 3 ml. of hydrogen peroxide. The color of solution should be a light orange at this point. If particles of tin are still present, heat gently until dissolved and then cool to room temperature.
- Add 60 ml. of hydrochloric acid, 150 ml. of water, and 3 drops of the antimony trichloride solution.
- Add 5 g. of hydrogen-reduced iron powder and close the flask with a one-hole rubber stopper. A ¼-in. glass tube is inserted into the hole with the end flush with the bottom of the stopper. The other end of the tube is bent downward and immersed in a beaker of 10 percent sodium bicarbonate solution. The stopper and glass tube arrangement is referred to as a “tin head”.
- Heat gently until all the iron has dissolved and then boil for 1 minute. The solution should be a clear green. Place the flask in an ice bath and cool to approximately 10° C, with the tin head outlet still immersed in the sodium bicarbonate solution.
- Remove the tin head; add 3 ml. of sodium bicarbonate solution, a few marble chips, 5 ml. of starch solution and titrate immediately with the standard iodine solution to the first permanent blue color.
- A reagent blank must be determined. (Note 2.)
Notes
- The iodine solution was standardized with a standard tin solution containing 0.0010 g. of tin per milliliter. This solution was made by dissolving 1 g. of pure tin in 100 ml. of hydrochloric acid and diluting to 1 l. with water. The standardization was accomplished using the same procedure as for the samples.
- A reagent blank should not exceed 0.20 ml. Some lots of fluoboric acid give high blanks.
Calculation
(ml. I2 – ml. blank) x tin factor x 100/weight of sample = % tin
Precision and Accuracy
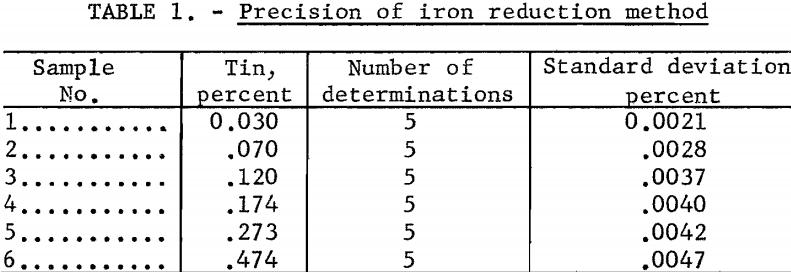
The precision of the method was measured by quintuplet determinations of selected samples in the range of 0.03 to 0.47 percent tin. Table 1 gives the results of these tests.

The accuracy of the method was checked by adding known amounts of tin to a previously analyzed titanium sample. The results obtained on each sample are the average of three analyses and are reported in table 2.

Lead Reduction Method
Summary
The sample was dissolved with dilute fluoboric and hydrochloric acids, and the titanium was oxidized with hydrogen peroxide. The tin was reduced with test lead and determined by an iodine titration. A limiting factor of the method is a maximum sample weight of 1 g. The concentration range investigated was 0.03 to 1.0 percent tin.
Reagents
- Fluoboric acid, 48 percent.
- Hydrogen peroxide, 30 percent.
- Test lead.
- Starch solution, 1 percent.
- Standard iodine solution, 0.02 N
- Hydrochloric acid, concentrated.
- Carbon dioxide, gas.
Procedure
- Weigh a 1-g. sample of titanium into a wide-mouth, 500-ml. Erlenmeyer flask.
- Dissolve the sample with a mixture of 50 ml. of water, 5 ml. of fluoboric acid, and 10 ml. of hydrochloric acid.
- When the sample has dissolved, add enough hydrogen peroxide to oxidize the titanium. The solution should be a light orange at this point.
- Add 70 ml. of hydrochloric acid and dilute to 350 ml. with water.
- Add 5 g. of test lead and stopper the flask with a three-hole stopper. An inlet tube for carbon dioxide is placed in one of the holes, a glass-rod plug in the second, and an air condenser ½ in. in diameter and 12 in, high, capped with a U-tube bubbler is inserted in the third hole. A current of carbon dioxide, enough to maintain a positive pressure of the gas in the flask, is started flowing through the tube.
- Place the flask on a hot plate and boil the contents gently for 30 minutes. Cool in a water bath to 10° C. Increase the carbon dioxide flow if necessary to prevent air from entering the flask.
- Remove the glass plug from the stopper and add 5 ml. of starch solution. Insert the tip of a 10-ml. buret in the hole and titrate with 0.02 N. iodine to the first permanent blue color. The carbon dioxide is allowed to sweep through the flask during the titration.
- Determine a blank using the same procedure as that used for the samples.
Notes
The iodine solution was standardized with a solution containing 0.0010 g. of tin per milliliter. The standardization procedure was the same as that used for the samples.
Calculation
(ml. I2 – ml. blank) x tin factor x 100/Weight of sample = % tin
Precision and Accuracy
The iron reduction method was faster than the lead reduction method, and had a lower detection limit. The reliability of the iron reduction method was determined by adding known amounts of tin to solutions of tin-free titanium metal and then analyzing for tin. The tin recovery was greater than 95 percent in the 0.03- to 1.0-percent range.
Optical Emission Spectrochemical Investigation
Titanium sponge samples have been analyzed satisfactorily for several years in the Bureau’s laboratory for common impurities by the solution-spark rotating-disk technique. It would, therefore, have been very convenient to determine the tin in such samples in this manner. Upon investigation, however, no set of solution-spark conditions were found which would produce a useable tin spectral line.
Several other techniques were examined, such as a method similar to that used by Duffendack and Wolfe in 1938 to analyze caustic liquors. In this method, several drops of the sample solution are transferred to a ¼-in. diameter lower graphite electrode and then dried. When completely dry, the electrodes are arced using rectified d.c. excitation. Many variations were tried both in electrode types and in excitation conditions. The precision required in the critical concentration range of 0.09 to 0.11 percent could not be obtained.
Another common basic method was investigated in which samples and standards were converted to dry oxides by chemical treatment followed by ignition in a muffle furnace. The oxides were mixed with graphite powder, packed into graphite electrodes, and excited in a d.c. arc. This method was similar to the one used by Standen except that in an effort to improve the precision, an internal standard titanium line was used. Again, the method did not produce results of sufficient accuracy. A procedure using this technique but with germanium dioxide added as an internal standard was developed by the Bureau to analyze high-purity titanium for many impurities including tin. This method was quite satisfactory when the impurity elements were present in the range of 10 to 100 p.p.m. No further study of emission spectrochemical methods was made.
Fluorescent X-Ray Spectrographic Method
Summary
Early in the period of the spectrochemical investigation, the use of the fluorescent X-ray spectrograph appeared promising, and a program for studying this method was established. It was soon determined that the intensity of the tin spectral line, K α, first order, from titanium hardness test buttons could be reproduced. From this observation a procedure was developed to determine the tin, using the hardness-test button as the sample. The method was broadened to include a technique which converted the metal to the oxide, after which it was pelletized, and the pellets were used as samples. This procedure was used when hardness-test buttons were not available. Also the concentration range of the determination was extended to include 0.004 to 50.0 percent tin—far beyond that originally required.
Instruments and Accessories
A commercial fluorescent X-ray spectrograph unit was used in this investigation and method development work without modifications and consisted of the following components: A stabilized power supply capable of supplying 50 ma, at 60 kv, to an FA-60 tungsten target X-ray tube; a vertically mounted goniometer supplied with a helium path attachment; a gas-flow proportional counter and a scintillation counter. Also, suitable electronic circuits were provided whereby fixed-time counting, fixed-count versus time, or chart recording could be used to evaluate the intensities of the X-ray spectra. Parallel plate collimators and flat analyzing crystals were used.
A collimating system consisting of a restricted pathway for the secondary radiation was located between the sample and the diffraction crystal, and a collimator 4 in. long, made of flat plates of nickel 0.001-in. thick, parallel spaced 0.005 in. apart, was placed between the crystal and the detector. The diffraction or analyzing crystals used were sodium chloride cut along the 100 plane with a “d” spacing of 2.8197 A., and lithium fluoride cut along its cleavage plane with a “d” spacing of 2.0138 A.
The detector used for all of the procedures except those of the lowest range was a scintillation counter consisting of a hermetically sealed crystal of sodium iodide activated with thallium. For the lowest range procedures a gas-flow proportional counter was used. This was a side window counter tube horizontally mounted on the unit chassis. A constant stream of a mixed gas consisting of 90 percent argon and 10 percent methane was passed through the tube at slightly above atmospheric pressure.
A standard sample holder supplied by the manufacturer was used for the titanium metal hardness test button samples. For analysis of titanium in the oxide form, a hydraulic press capable of a pressure of 20 tons per square inch (t.p.s.i.) upon a 1-in. plunger was used to pelletize the samples. The sample holder for the oxide was the same as for buttons except that it was modified to hold a 1-in.-diameter by 1/8-in.-thick pellet. The modification consisted of a 1-in. hole drilled in an aluminum plate 2 in, long, 1-5/8 in, wide, and 1/8 in. thick. The hole was located so that the maximum intensity of the X-ray beam could be utilized. This plate was backed by another plate of the same dimensions without the hole. These plates were held in the sample holder with a microscope stage clip.
Preparation of Standards
Hardness-test buttons to be used as standards were prepared by a method developed at the Bureau’s Metallurgy Research Laboratory Boulder City (Nev.) and described in a Bureau of Mines report. The buttons were made from approximately 70 g. of titanium sponge. After the hardness measurements were made, the buttons were resurfaced on a lathe to approximately ¼-in. thick to remove the hardness-test depressions and to obtain a smooth surface. No further treatment of the surface was necessary. The buttons were sawed to fit the sample holder. When analytical values had been obtained on the X-ray spectrograph, the buttons were turned on a lathe to a thickness of 1/8 in. by removing equal amounts from each side. This technique provided the chemical laboratory with sufficient metal for confirmatory analysis. The recut buttons were then analyzed on the X-ray spectrograph to verify the homogeneity of the sample. At least five determinations were obtained by chemical analysis and the standard values were ascertained from these results. The original sponge also was chemically analyzed to determine if any tin had been lost during the melting of the samples.
Buttons were selected for use as standards according to their tin content as determined by chemical analysis of drillings from compacted sponge. In this manner, the concentration range of 0.03 to 4.22 percent tin was covered. No attempt was made to extend this range upward by the preparation of synthetic standards.
For the titanium dioxide procedure, appropriate quantities of minus 100- mesh high-purity titanium dioxide and stannic oxide to cover the range of standards used were weighed and mixed in a dental-type amalgamator for 5 minutes. Then 1.500 g. of the standard and 1.500 g. of corn starch were weighed and mixed for 5 minutes. The corn starch was added as a binder. This mixture was transferred to a press and a pressure of 3.5 t.p.s.i. was applied for 2 minutes. Pellets compacted in this manner could be handled without crumbling. Standards prepared by the method of successive dilution or prepared singly gave similar results.
The high-purity titanium dioxide was prepared by adding pure titanium tetrachloride to distilled water and hydrolyzing the titanium with ammonia gas at a pH no higher than 6.0. The precipitate was centrifuged and the mother liquor was decanted. Water was added and the process repeated at least three times to wash the precipitate free of the mother liquor. The washed precipitate was then dried and ignited in a muffle furnace at 1,000° C. for 2 hours. X-ray diffraction patterns revealed that the resulting titanium dioxide was in the rutile form. The intensity of the analytical peaks used were quite constant when the oxide had been ignited for 2 hours at 900° C. to 1,000° C. in a muffle furnace; whereas, when the oxide was dried and/or ignited at lower temperatures, these same peak intensities were inconsistent and lower.
Since the lower limit of the wet chemical procedure used was 0.01 percent tin, some additional steps were necessary to establish an analytical curve for buttons in the range of 0.004 percent. Part of the same portion of the button cuttings analyzed by the wet method was oxidized, ignited for 2 hours at 900° C., and pelletized. X-ray results obtained from these pellets were compared with results obtained from their corresponding buttons. This verified that the values found by these procedures were in agreement. Therefore, the the lowest range button procedure was established by analyzing the original buttons, the pellets formed from the button cuttings, and the recut buttons.
Preparation of Samples
Button samples were prepared in the same manner as the standards except that they were not turned on the lathe a second time.
When the metal was not available in button form it was dissolved in hydrochloric acid, evaporated to dryness, and ignited for 2 hours at 900° C, to the oxide. Solutions containing hydrofluoric acid were avoided because some tin was lost during ignition. The titanium metal was oxidized directly in a muffle furnace if the particles were small. After the sample was converted to the oxide, it was pelletized in the same manner as the standards.
Procedures
A block diagram illustrating the two methods tried is shown in figure 1. The first method was developed for use on hardness buttons and the second for analyzing other physical forms of the metal samples. These methods were developed along parallel lines, each being subdivided into two submethods or techniques which are referred to as the ratio technique and the count technique.
With all techniques, tin values from appropriate standards were determined at the beginning, in the middle, and at the end of each sequence of analytical determinations in order to adjust for any temporary fluctuations of the analytical curves. These curves, as plotted from either counts per second or total counts versus percent tin, were almost linear with slightly more curvature appearing at the bottom end of the two lowest ranges.

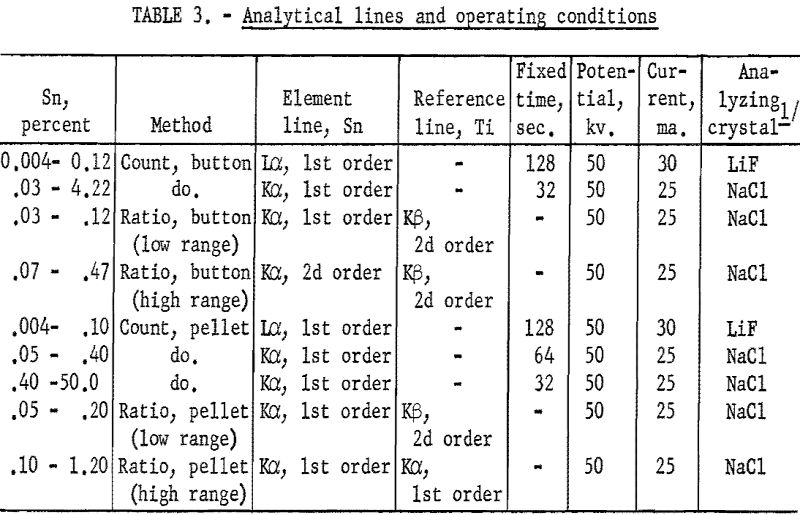
Table 3 lists the analytical lines and the operating conditions used with these procedures.
Ratio Technique
The peak heights were recorded on a strip-chart by scanning the tin and titanium peaks from an angle 2° lower than the peak at a rate of 1° (2 theta) per minute. The curves were established by using the arithmetic ratio between the tin and titanium peaks (after background values had been subtracted from each) as one coordinate and the percent tin as the other.
Count Technique
A faster method covering the same range was developed by observing the number of counts for a fixed time. The 2-theta angle was adjusted to the maximum of the tin peak, and the counts were observed for definite time. An arbitrary point of consistent background was chosen and the counts taken during the same time interval. The net result from the tin peak count, minus the background count, was plotted as one coordinate and the percent tin as the other. The point chosen for the background count in this method was 15.00° (2 theta) for the Sn Kα peak. At this point the count was lower than the time background directly under the maximum of the peak, thus the curve plotted using linear coordinates did not pass through the origin. To obtain the true background count directly under the peak, it would have been necessary to take the count on a standard sample containing zero percent tin after each unknown sample, or to subtract a constant value obtained on such a standard previously determined. The method was chosen for two reasons: (1) The background at the previously mentioned point could be determined on each unknown sample; (2) any unusual fluctuation of the background count at the point chosen would indicate a bad sample, either due to improper sample preparation or to a highly impure original sample. Any point of consistent background could have been chosen for this work as the variation from the normal count is the important factor. The precision of this technique was acceptable, and all samples were analyzed by it except where the tin results were in close proximity to the maximum value of the specification. In these instances the samples were analyzed by both techniques.

Precision and Accuracy
A button formed from a sample of titanium sponge was analyzed by the count and by the intensity ratio technique. It was then cut in the manner shown in figure 2, and the cuttings were analyzed by the iron reduction method. A portion of the cuttings was analyzed by the pellet technique.

Finally, the fresh surfaces on both sides of the button were analyzed by count and ratio methods. As shown in table 4, these values indicate not only the precision of the various methods, but also are a measure of the accuracy.
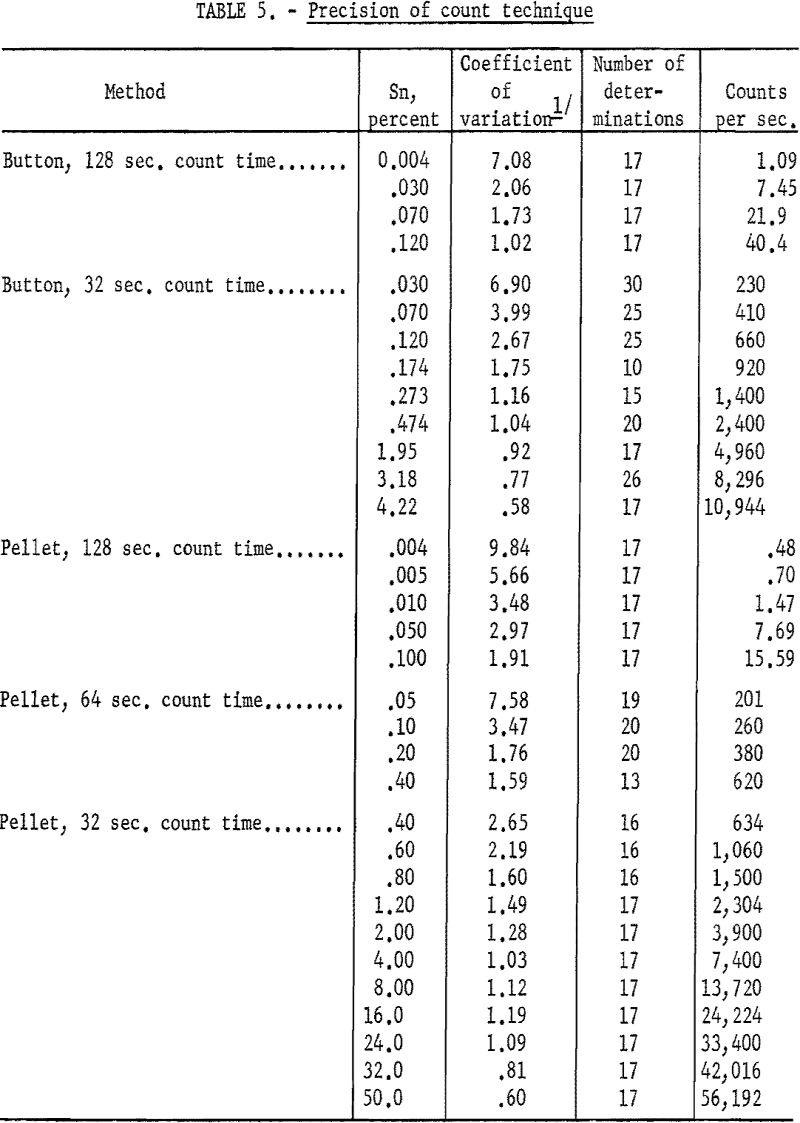
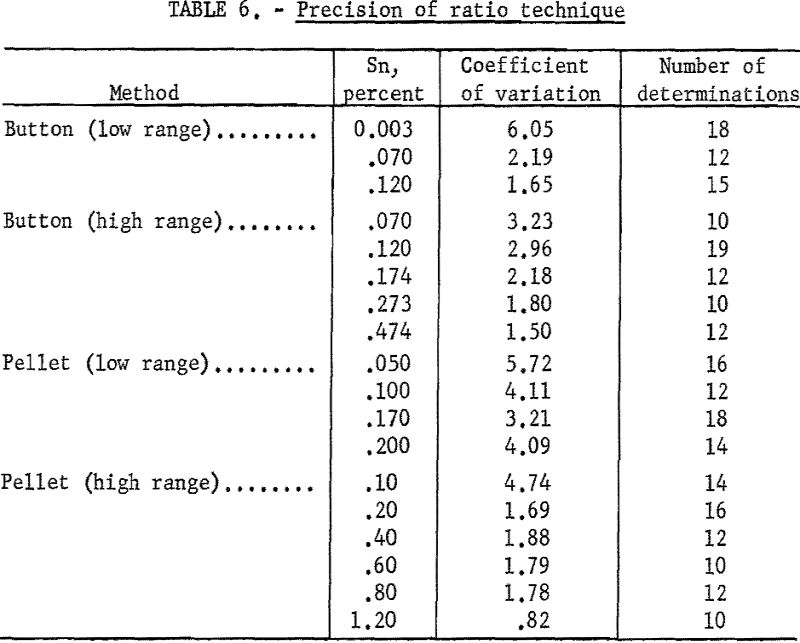
Tables 5 and 6 indicate the precision of the individual methods developed. A comparison of results obtained by the iron reduction chemical method is given in table 7. Sixty samples of titanium sponge, submitted by a producer, were analyzed by both methods. X-ray analyses were made on hardness buttons prepared from the sponge which was analyzed chemically.

Discussion
The reliability of this procedure (carried out by three operators using the same unit) has been observed for over a year. A relatively high order of precision is maintained in the method. However, it is advisable that no variables be introduced.
The use of the lithium fluoride analyzing crystal improved the results for the lower quantities of tin but there was no appreciable difference in the results in the upper range.


where X = average concentration, in percent
d = difference of the determination from the mean, and
n = number of determinations.


The high level of background prohibited the use of the tin K-alpha peak in the lowest range so the gas-flow proportional counter and the tin L-alpha peak were used. Helium flow was necessary for these low range procedures. It might be possible to cut the counting time from 128 to 64 seconds for the range of 0.004 percent tin, thereby saving considerable time for large numbers of routine samples. The same high order of precision could not be maintained, however, due to the great reduction on total counts obtained in the shorter time interval. Judging from count values, the button procedure might be extended to 0.002 percent tin.
Where the slope of the high range button-count curve is proportionate to that of the pellet-count curve, it is valid to assume that the button curve might be extended beyond its present limit of 4.22 percent tin to a point that is comparable to the uppermost point of the pellet curve.
The operating time for the ratio technique is at least eight minutes per sample. Use of the count technique is preferable wherever possible because it is faster. Further, as hardness-test buttons are prepared for a sizeable proportion of the samples to be analyzed, the only extra time involved is the time required to resurface and cut the buttons. In these instances, it is not necessary to convert the metal to the oxide, therefore, considerable time is saved in analyzing large numbers of samples.
The foregoing procedure is applicable to samples that do not have more than 3 percent of any single impurity element other than tin. For alloys ox samples that have high impurity levels, either new curves must be developed or experimentally determined correction factors would have to be applied.
