I have made a number of general remarks regarding the character of product delivered by crushers of various types, and under different conditions of operation. Generalities are of value only if we have some standard to which comparisons may be referred; therefore, we should like to present more specific information on the kind of product to be expected from crushing equipment under “average” operating conditions. Much of the data on which sizing/design curves and tables are based comes from operations involving those two very important types: gyratory and jaw crushers; therefore these curves and tables are more nearly representative of the work of these types than of rolls or hammermills. They may be used for these latter types however if due allowance is made for peculiarities of each type, as pointed out in the descriptions of the different machines.
 The preparation of a set of product gradation curves involves a considerable amount of work in the collection of the necessary test data, and a certain degree of discrimination in sorting such data and weeding out erroneous results. There are several reasons why no set of product gradation curves can be regarded as more than reasonably close approximations. First among these is the variation in physical structure of the many materials for which crushers are used; rocks exhibit a high degree of “rugged individualism” in their reaction to crushing. This variation is frequently quite pronounced between different ledges in the same quarry.
Gradation of the crusher feed also has its effect upon the product analysis. This is true even of screened feed, although deviations from the average are not likely to be so wide as they are for unscreened material, such as quarry-run or mine-run rock. We have commented on other variable factors, such as choke versus regulated feed, straight versus curved concaves, and so forth.
Fortunately, most materials do follow a certain definite gradation pattern and, by averaging a large number of test results, it is possible to plot a group of curves which can be classed as fairly close approximations. Even though approximate, these curves are of great value in crushing-plant design, or in the solution of problems concerning additions or alterations in the plant flowsheet. They simplify the problem of selecting secondary and tertiary crushers, as well as elevating and conveying equipment, and they are invaluable in the calculation of screen sizes. In short, they eliminate much of the old-time guess work in the preparation of the plant flowsheet.
Crusher-Setting, Product-Size
Gyratory and jaw crushers are always rated at certain open-side or close-side discharge settings. In order that we may select the particular curve, of a group of curves, which will most nearly represent the product of a crusher having any given discharge setting, it is important to know approximately what percentage of the total output will pass a screen opening of equal dimension. It was universal practice in past years to designate such screen openings as “ring-size” for the very logical reason that the leading screen of that day, the revolving type, was, almost without exception, fitted with sections having round holes. Now that the vibrating screen, with its wire cloth or square-punched steel plate sections, has pre-empted the field there is no longer any excuse for adhering to the “ring-size” product designation. Above is a list of the approximate percentages of product passing a square opening test sieve whose holes are equal to the discharge setting of the crusher. Several different conditions are tabulated, and each condition is accompanied by estimates for four different classes of material.
In gravel pit operations it will usually be found that some one of these listed base rocks will predominate, and no great error will be introduced if this predominant rock is used as the basis for product calculations. Most base rocks will be close enough in physical structure to one of the listed varieties so that the percentages can be used for them without serious error. The same statement applies to the product gradation curves to be discussed. It must be remembered that the entire process of securing and compiling data of this nature is, at best, one which is susceptible of only approximate results.
Primary Crusher Product
It was formerly the custom to consider one set of product gradation, or screen analysis, curves as being suitable to represent the products of both primary (unscreened) and secondary (screened) feeds, making no allowance for the undersize material which is always present, to some extent, in quarry-run and mine-run materials. The average quarry does not produce as much of this undersize rock as the average mine, but the usual practice in mining operations is to scalp off most of the undersize ahead of the primary crusher, whereas this practice is the exception rather than the rule in quarry operations. As a matter of fact, where the secondary crushers are fitted with straight concaves, or jaw plates, as used to be standard practice, the dif-ference between product curves on screened and unscreened feed was not significant, and no great discrepancy was introduced by considering them under the one heading.
With the introduction of non-choking concaves in the standard gyratory crushers and reduction crushers, and the development of high speed fine-reduction crushers with high choke points, it soon became apparent that there was a substantial difference in the screen analyses of the two kinds of product, that is, crusher products on unscreened and screened feeds. The difference is especially significant in the lower part of the curve, where undersize in the feed would naturally show up, and where the cleaner breaking of the non-choke crushing chamber would likewise be reflected.
Here above is shown a family of curves for primary crushing of unscreened feed, such as the average quarry-run material in which the undersize (minus crusher setting) rock is present in proportions normally resulting from blasting operations. The same curves may be used for mining operations with stationary bar grizzlies ahead of the primary crusher.
In such operations the amount of undersize going into the crusher will usually be about the same as for the quarry operation without pre-scalping.
It should be noted that the test data on which these curves are based were taken from gyratory and jaw crusher operations, but, as we have stated before, they may be used for other types of crushers if allowance is made for the characteristics peculiar to each type. As a matter of fact, so far as crushers of the Fairmount single-roll type are concerned, there is a natural compensation which brings the curves fairly well into line. The Fairmount crusher is inherently a somewhat cleaner breaking machine than either the standard gyratory or standard jaw types, but the class of rock for which the former crusher is largely used is usually subject to greater than average degradation during the blasting and loading operations in the quarry, which tends to level out the difference in crushing performance. Using Crusher and Screen Charts
The method of using the curves is so simple as to require little comment. The vertical axes represent material sizes, which may be taken as either square or round openings; provided of course that the same shape of opening is used throughout any particular analysis. The horizontal axes represent cmmdative percentages passing corresponding screen openings. If we wish to check the product to be expected from a crusher set at some predetermined discharge opening, we first refer to the table showing the approximate percentage of product which will pass an opening equivalent to the crusher setting. This gives us a point in the group of curves which may, or may not, be exactly on one of them. In the latter case we interpolate by following an imaginary curve between the two curves on either side of our point. We can thus tabulate cumulative percentages passing all of the product sizes in which we may be interested. Non-cumulative percentages; which are important because they are used to determine expected amounts of specific products are simply the difference between the upper and lower cumulative percentages for the particular product limits under consideration.
For those not familiar with the use of product gradation curves an example may be helpful. Suppose that a tentative selection of a 3.5″ open- side discharge setting has been made for a standard gyratory primary crusher to be used for crushing quarry-run limestone. Referring to the table which lists percentages of product passing an equivalent square opening, we find that 85 to 90% of the crusher product should pass a 3.5″ square opening. Choosing the lower percentage, to be on the conservative side,, we follow the horizontal line, denoting the 3.5″ product size in the curve chart, over to the vertical line marking the 85% value. We find that the point we have established does not fall directly upon any of the’ group of curves, but lies so close to one of them that it may be used without appreciable error into our calculations.
Let us suppose that we wish to know how much of the product of our primary crusher will be retained on a 1.5″ square opening screen, so that we may estimate the size and number of secondary crushers required to recrush the plus 1.5″ contingent. Following the curve down to the 1.5″ line, we find that 43% of the primary crusher output may be expected to pass this screen opening; 57% will be retained, which means that we must provide secondary crushing capacity to take care of 57 tons for each 100 tons fed to the primary crusher.
Occasionally it happens that we wish to scalp off a salable product from the output of the primary crusher; for example, a plus 1.5″ minus 3.5″ material for highway base- rock. The difference between the cumulative percentages at the 3.5″ and 1.5″ points on the curve gives us the amount, of such product to be expected from the output of the primary crusher This is 85 minus 43, or 42% of the primary crusher product.
If our problem had covered a crushing condition calling for 80 instead of 85% passing the opening equivalent to the crusher setting, we would have found that our point fell exactly on a curve, regardless of what crusher setting we had selected. This is because all of the family of curves are based on the 80% line. Obviously a group of curves might be based on any percentage line, but it is usual practice to choose the 80 or 85% values.
It will be noted that the curves bend upward in very marked fashion above the 75-85% region. This simply reflects the tendency of practically all materials to slab, or spall, to some extent in the crusher. As a matter of fact, product gradation in this upper range (above the open- side setting of the crusher) is of a distinctly uncertain and variable nature, and about all that a group of curves can do is to reflect the general tendency. Fortunately the exact screen analysis in this fraction of the primary crusher output is recrushed in succeeding stages, and all that is required is to know approximately how much of it there will be to recrush.
Although the group of curves we have been considering are intended for calulations involving primary crushing operations, they may also be used for secondary crusher products in those cases where no screening is performed between primary and secondary stages. Such an arrangement is seldom encountered in modern plant design, except where large jaw crushers, set very wide, are followed by a secondary, usually of the standard gyratory type, to reduce further the very coarse output of the jaw crusher to a size which can be handled by the recrushing, screening, and elevating equipment in the balance of the plant. In such cases it is simplest to consider the two-stage set-up as a single machine with discharge opening equal to that of the secondary crusher.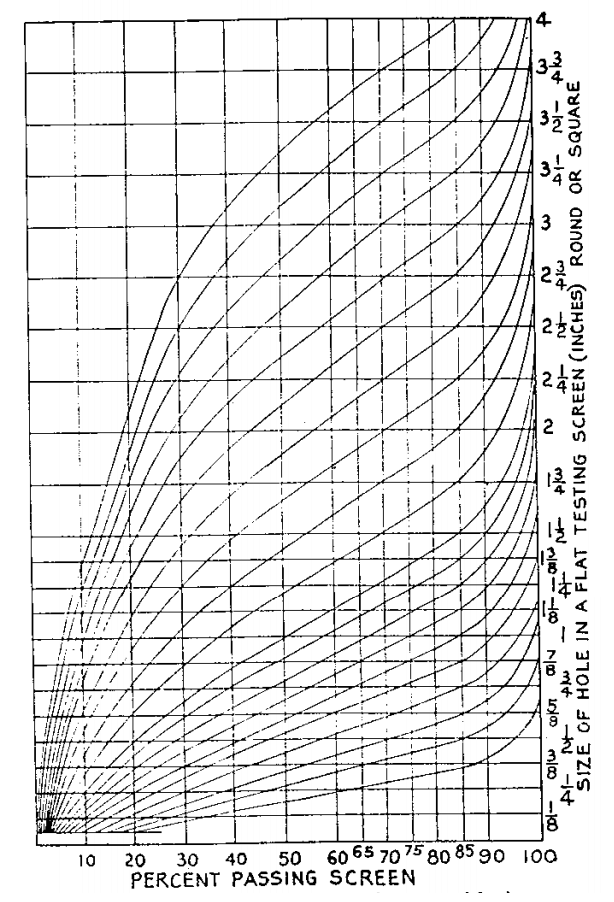
Curves for Screened Feed
The group of curves on the right is charted from screen analyses of the products of crushers receiving screened feed. They are useful in predicting the character of output from secondary and tertiary crushers, and are of great value in the preparation of plant flowsheets, and in calculating vibrating screen capacities. Their use in the latter connection will be discussed in the screening section of this series.
There is no need for extended comment on this group of curves; the method of taking off cumulative percentages, and non-cumulative fractions, is exactly the same as for the chart we previously discussed. The difference in the shape of these curves is attributable to the absence of fines in the crusher feed, and to the cleaner breaking action of the modem reduction crusher.
Closed-Circuit Product Analysis
The product gradation curves for screened feed, described under the preceding sub-heading, can be used as a basis for calculating approximate screen analysis of products from closed-circuit crushing stages, but the values cannot be taken directly from the curves.
For example, consider a crusher set to turn out a product 70% of which will pass a 5/8″ square opening, and in closed circuit with a screen which is equipped to remove the minus 3/4″ product. The curve shows that approximately 85% of the crusher product will pass the 3/4″ square openings.
Suppose that we wish to know how much minus 0.25″ fines we may expect from the circuit. We do not go to the curve which touches the 100 percent ordinate at the 3/4″ value; we calculate the percentage from the same curve which was used to predict the proportion of minus 0.75″ in the crusher discharge. This curve shows approximately 29 percent of minus 3/4″ in the material as it comes from the crusher, or 29 tons of fines in each 100 tons of crusher output. But, for the circulating load, we are only interested in that fraction of the crusher output which will pass the 3/4″ screen, which is 85 tons. That part of the product gradation curve which lies below the 85 percent value represents the gradation of the finished product, and 29 tons out of each 85 would be minus 0.25″.
Let x equal percentage of minus 0.25″ in the finished product, then x_100=29:85 or x = 34.1 percent of minus 0.25″ rock from the closed circuit operation. Any other size of product may be estimated in a similar manner. Note that if we had used a curve touching the 100 percent ordinate at the 0.75″ value, we would have arrived at a value approximately 50 percent for the minus 0.25″ fraction; a value which is obviously erroneous for rock of average characteristics. We will comment on closed circuit crushing, and upon certain assumptions which have to be made in closed circuit calculations, in a later discussion of reduction-crushing.
Square Openings VS Round
Although the long established practice of designating crusher products by “ring-size” is not compatible with present-day screening practice, there are occasions when it is desirable to convert our calculations from one shape of opening to the other. So far as the curves themselves are concerned, once we have established the shape of screen opening—round or square—we can use them for either so long as we stick to one shape throughout the process of taking off percentages-passing. If, as occasionally happens, we have to deal with both shapes of screen opening in the same set of calculations, one or the other of them must be converted to equivalent sizes of the opposing shape. For example, if most of the screen openings are to be square, but one or two of them must be round, the round-hole sizes should be expressed in terms of equivalent square openings.
Inasmuch as the table of crusher settings versus equivalent product percentages is based on square openings, it is necessary to convert to equivalent round openings before this table can be used for such openings.
Below is the information needed to make conversions from round to square holes, or vice versa. The two columns at the left showing equivalent sizes for flat testing screens, are the columns to use in connection with crusher product calculations. Admittedly, listings of equivalent round and square holes, such as we show in this table, can be only approximately correct for the many different materials with which we must deal in crushing and screening computations. The infinite variety of shapes encountered renders absolute accuracy an impossible attainment. Practical experience, however, indicates that the comparisons shown in our table are in most cases close enough for all practical purposes.
Relation Between Round And Square Holes In Revolving Vibrating And Flat Testing Screens
| Product Size | Corresponding Size Holes | |||
|---|---|---|---|---|
| Through a flat testing screen | Allis-Chalmers vibrating screen | Revolving Screen | ||
| Round holes | Square holes | Round holes | Square holes | Round holes |
| 1/8 | 3/32 | 5/32 | 1/8 | 5/32 |
| 3/8 | 3/32 | 7/32 | 3/16 | 1/4 |
| 1/4 | 3/14 | 9/32 | 1/4 | 1/16 |
| 1/2 | 1/4 | 11/32 | 1/12 | 3/8 |
| 3/8 | 3/10 | 7/16 | 3/8 | 1/2 |
| 1/4 | 3/8 | 1/2 | 3/16 | 3/18 |
| 1/2 | 1/10 | 1/4 | 1/2 | 5/8 |
| 3/2 | 1/2 | 5/8 | 1/18 | 11/10 |
| 3/8 | 2/10 | 11/10 | 6/8 | 3/4 |
| 11/10 | 5/8 | 3/4 | 11/10 | 7/8 |
| 3/4 | 11/10 | 7/8 | 3/4 | 1 |
| 7/8 | 3/4 | 15/18 | 7/8 | 1 1/8 |
| 1 | 7/8 | 1 1/16 | 12/10 | 1 1/4 |
| 1 3/8 | 1 | 1 2/18 | 1 1/18 | 1 3/8 |
| 1 1/4 | 1 1/16 | 1 3/8 | 1 1/7 | 1 2/14 |
| 1 3/8 | 1 1/8 | 1 1/16 | 1 1/4 | 1 3/4 |
| 1 1/2 | 1 1/4 | 1 3/18 | 1 3/8 | 1 7/8 |
| 1 5/8 | 1 3/8 | 1 3/4 | 1 3/10 | 2 |
| 1 3/4 | 1 1/2 | 1 7/8 | 1 3/16 | 2 1/4 |
| 1 7/8 | 1 5/8 | 2 | 1 3/4 | 2 3/8 |
| 2 | 1 3/4 | 2 1/8 | 1 7/8 | 2 1/2 |
| 2 1/8 | 1 7/8 | 2 1/4 | 2 | 2 5/8 |
| 2 1/4 | 1 15/18 | 2 3/8 | 2 1/16 | 2 3/4 |
| 2 3/8 | 2 | 2 1/2 | 2 1/8 | 2 11/16 |
| 2 1/2 | 2 1/8 | 2 6/8 | 2 1/4 | 3 1/8 |
| 2 5/8 | 2 1/4 | 2 3/4 | 2 3/8 | 3 5/12 |
| 2 3/4 | 2 3/8 | 2 7/8 | 2 1/2 | 3 1/2 |
| 2 7/8 | 2 1/2 | 3 | 2 5/8 | 3 5/8 |
| 3 | 2 5/8 | 3 1/4 | 2 3/4 | 3 3/4 |
| 3 1/4 | 2 3/4 | 3 1/2 | 3 | 4 |
| 3 1/2 | 3 | 3 3/4 | 3 1/4 | 4 3/8 |
| 3 3/4 | 3 1/4 | 4 | 3 1/2 | 4 3/4 |
| 4 | 3 1/2 | 4 1/4 | 3 3/4 | 5 |
| 4 1/2 | 3 7/8 | 4 3/4 | 4 1/8 | 5 1/2 |
| 5 | 4 1/4 | 5 1/4 | 4 1/2 | 6 1/4 |
| 5 1/2 | 4 3/4 | 5 3/4 | 5 | 6 7/8 |
| 6 | 5 1/4 | 6 1/2 | 5 1/2 | 7 1/2 |
| 6 1/2 | 5 1/2 | 7 | 5 3/4 | 8 |
| 7 | 6 | 7 1/2 | 6 1/2 | 8 3/4 |
| 7 1/2 | 6 1/2 | 8 | 7 | 9 3/8 |
| 8 | 7 | 8 3/4 | 7 1/2 | 10 |
| 8 1/2 | 7 1/4 | 9 1/4 | 7 3/4 | 10 1/2 |
| 9 | 7 3/4 | 9 1/2 | 8 1/4 | 11 1/4 |
| 9 1/2 | 8 | 10 | 8 1/2 | 11 3/4 |
| 10 | 8 1/2 | 10 1/2 | 9 | 12 1/2 |
https://geology.com/articles/crushed-stone/ and https://www.metso.com/
