“It would seem as if the methods used to date for the elucidation of this complex problem have yielded all they are capable of yielding and that further straining of these methods will only serve to confuse the issue, the point having been reached when this juggling, no matter how skilfully done, with allotropy, solid solutions, and strains is causing weariness without advancing the solution of the problem. The tendency of late has been to abandon the safer road of experimental facts and to enter the maze of excessive speculations, in which there is great danger of some becoming hopelessly lost. The conclusion seems warranted that new avenues of approach must be found if we are to obtain a correct answer to this apparent enigma.
With some degree of fitness we may say this of other problems. It seems likely that one of the new avenues of approach to many metallographic problems is the study of crystal structure, or more accurately, the atomic arrangement by means of the X-ray spectrometer.
The crystal structure of some materials has been carefully worked out by the mineralogist, but his methods are, in general, unsuited to commercial metals and a method that yields even better information is at hand as the result of work on the diffraction of X-rays by Laue and the Braggs and later by Hull, St. John, and others. It should be understood that the contour of free crystals, which is the subject of measurements by the crystallographer, is the result of the atomic structure and, in general, bears a simple and obvious relation to it. The use of the X-ray spectrometer has been described frequently, so the procedure will not be given here.
All metals are normally crystalline. Crystallinity requires regularity in atomic spacing; hence, parallel planes of regular spacing can be passed in many ways through a crystal grain containing all the atom centers. The distance between such planes are the data recorded photographically by the X-ray spectrometer. These planes act as a three-dimensional
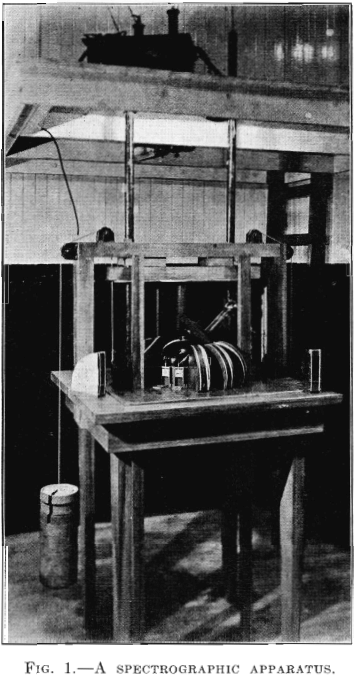
grating for diffraction; the nature of the assortment of such interplanar distances found in a crystal determines its type. The ultimate measure of these plane spacings is merely the distance along a strip of photographic film where darkened lines appear exactly as they appear on a photograph of the spectrum of visible light, for instance. Of course, instead of having a constant grating and analyzing the wave length, we have a constant wave length and measure the grating. When we derive the angle of diffraction from these dark lines and deduce the atomic plane spacing by the classical formula nγ = 2d sin θ (in which n is the order, γ the wave length, d the atomic spacing, and θ the angle of diffraction) we have only to construct in space a lattice that has spacings to conform to those recorded. A photograph of a complete spectrographic equipment is shown in Fig. 1.
The logical first step in applying such study to metals is the determination of the atomic arrangement or crystal structure for all the useful pure metals. This work has already been done largely by Dr. A. W. Hull and Dr. W. P. Davey. In his investigations, the author has added one or two elements to the list and has had occasion to work out independently many of the metals announced by Hull. In every case, the greater the refinement of experimentation the closer was the agreement with Hull’s figures.
Table 1 shows the metals as they fall in the various types of crystallinity, together with their atomic spacings and ratios. It is fortunate that the metals crystallize in so few simple types of great symmetry; the workability of the majority of metals probably follows as a result of this circumstance. To date, metals have been found only in the face-centered cubic, body-centered cubic, face-centered tetragonal, body-centered tetragonal, close-packed hexagonal, and diamond arrangement in both isometric and rhombohedral types. Some metals have been found to exist in two lattices, corresponding to allotropic modifications with stability in different temperature ranges; for example, iron and cobalt.
As has been stated, both the type and the dimensions of the space lattice for the atoms in metals are computed from the pattern of lines on the spectrogram. Hence, this photographic pattern is essentially characteristic for each metal. A number of such photographic films are here shown. So far as is known, the pattern for any metal differs at least in dimensions from the pattern of any other material. Conceivably, two metals might be identical in lattice size but the author has not found any cases of apparent identity that, with greater accuracy of measurement, did not show some difference. Thus, the cube edge of tungsten differs from the cube edge of molybdenum by only about 0.25 per cent. So the spectrogram takes on the significance of a highly characteristic, even though insensitive, qualitative analytical method. The expressions copper lattice or zinc lattice, for example, refer to perfectly definite spacings—atom center to atom center; so that we may with no sense of vagueness refer to a copper lattice as an entity even though some points in the lattice are occupied by other elements. Equipped with a qualita-


tive method for recognizing the characteristic atomic arrangement of atoms in the various metals, a method that is able to penetrate many thousands of atoms deep into a specimen and destroy none of the specimen—we might hope to glean knowledge of some heretofore undiscovered facts.
Physically, the simple eutectic in metals is regarded as a mixture of the two more or less pure elements. As might be expected, from eutectic specimens the film obtained shows simultaneously two patterns; the one of metal A the other of metal B. The relative intensities of the two superimposed spectra are dependent (among other things) on the composition of the particular eutectic in question. The pattern grows more intense for A or for B as the eutectic is mixed with proeutectic A or B by a change in composition. There is, then, no inherent difference between a eutectic and a mechanical mixture of the powders of two metals, except that in the eutectic the grain size of one constituent is larger than the grain size of the other, the continuous phase having the larger grain.
In eutectics studied by the author, there were cases of limited solubility in the solid. But the two patterns revealed on the film were substantially identical with the two pure-metal patterns. Thus, the tin-lead eutectic showed both the pattern of lead and the pattern of tin, while in fact there were no crystal-grains of pure lead present but a solid solution of a small amount of tin in lead. Silicon-aluminum eutectic showed exactly the same evidence, though aluminum dissolves over 1 per cent, of silicon. This led to the prediction that a solid solution has a crystal structure nearly identical with the structure of the solvent.
COPPER-ZINC SERIES
The question immediately was raised “What happens to the atomic arrangement in a crystal grain of copper when zinc dissolves in it in the solid?” Here the X-ray spectrometer gives the answer at once. In Fig. 2 is shown the first few lines of the pure copper pattern and alongside,

for comparison, the same pattern range for alpha brass of over 30 per cent. zinc content. They are identical so far as our measurement shows— face-centered cubic with cube edge 3.60 x 10⁻⁸ cm. Here 30 per cent, of zinc has been dissolved in solid copper without changing the copper atomic arrangement or spacings to an extent that could be observed on the pattern. Zinc atoms replace copper atoms in the space lattice without materially altering the copper lattice. If we start with a unit volume of copper and add to it zinc in solid solution, maintaining the whole homogeneous, we shall find that the increase in volume is equal to the atomic volume of copper multiplied by the number of zinc atoms added. When metal n dissolves in metal m, the density of the solid solution will be represented by

In which D is the density of the mixture and d the density of the solvent metal. By this assumption we have fixed the density of solid solutions having the same lattice dimensions as the solvent metal. It is unfortunate that the author has not found data on density of solid solutions of sufficient accuracy or in sufficient abundance to prove this hypothesis completely. The approximate identity of alpha solid solution with copper has been shown for zinc, aluminum, and tin additions. Another example of limited solution in the solid is carbon dissolving in gamma iron to form austenite, whose lattice is that of gamma iron. From these tests and from those described subsequently under the isomorphous series, we are able to give a real distinction to the words solvent and solute. It seems logical to call that metal, of a pair in solid solution, whose lattice persists, the solvent. In the case of liquid solutions, such as alcohol and water for instance, there is little reason for giving either water or alcohol the distinction of being the solvent for their molecules are supposed to be constantly in erratic motion and never in a regular and orderly arrangement. What is usually done is to speak of the material in predominance as the solvent; it is thus that Gulliver uses the term in connection with solid solutions.
Just as there is a limit of solubility of a solute in a liquid, further additions of which refuse to become homogeneous with the saturated solution, in the case of solid solutions there is a limit to the amount of widely different foreign atoms that can remain in a parent lattice. The copper lattice can permit only about 35 per cent, of its points to be occupied by zinc atoms, or 6.8 per cent, of its points by tin. Further additions of solvent gather together, along with the largest number of solvent atoms possible, and establish a new lattice which is compatable with the leaner solvent composition; thus, in the copper-zinc and copper-tin series, a body-centered cubic lattice is formed for the still more diluted copper. It is impossible to say whether or not this is strictly the beta range of the constitution diagram for there is disagreement in the regions for those lattices that exist at room temperature. For still higher concentrations of zinc (around 75 per cent.) another stable lattice is rhombohedral. For pure zinc and its solution of copper for the very narrow range, the hexagonal zinc lattice is the only one observed, making four structures in all for the series.
It may be interesting to speculate on the possibility of a compound of copper-zinc being the parent lattice for the body-centered range of the series; it fits nicely into our conception of space lattices. The body-centered lattice is, in reality, two interpenetrating simple cubic lattices with the same cube edge as the body-centered type. If we picture each simple cubic structure as being entirely of one, metal, we have a very symmetrical form for a 1:1 compound. Knowing the ease with which copper is replaced by zinc, we can easily believe that this compound lattice could exist with some preponderance of zinc over the equal atomic ratio; this is in accord with the observed fact. We then have a case of solution of an element in a compound. The X-ray spectrographic evidence which the author has secured is a corroboration of the results of Mary R. Andrews who deals with the crystallinity of the entire copper-zinc series. It appears that the structures of the copper-zinc series is paralleled by the copper-tin alloys, although the spectroscopy is much more difficult caused probably by the great disparity in atomic weights.
SOLID-SOLUTION TYPES
The question arises, as to what dispensation we shall make of the so-called continuous solid-solution types exemplified by copper-manganese, copper-nickel, nickel-iron, nickel-chromium, nickel-cobalt, iron-manganese, copper-gold, silver-gold, tungsten-molybdenum, and other pairs. With the definition given, relating to the retention of the solvent lattice, how can there be isomorphism in an entire range that has two types of crystallinity depending on the two different solvents—two parent lattices? Obviously, in such a case a solid solution of A in B could not be identical with a solution of B in A, even of the same composition. The X-rays reveal the surprising fact that often they are not strictly isomorphous. It appears that the condition for a so-called, isomorphous series is merely that metal A can dissolve in its lattice an amount of B that overlaps the composition of B in the solution of A and B lattice. Over a certain range both structures exist simultaneously.
These conclusions are based on the examination of the three series, iron-nickel, nickel-chromium, and copper-manganese. The two last- mentioned series were studied throughout their entire range from alloys chosen at 10 per cent, composition intervals. The first was studied only for a limited range; it had been the subject of investigation of very accurate work by Mary R. Andrews and accordingly only a few tests were made.
The chromium-nickel series was chosen for the example of continuous solution without minimum in melting points. All proportions melt
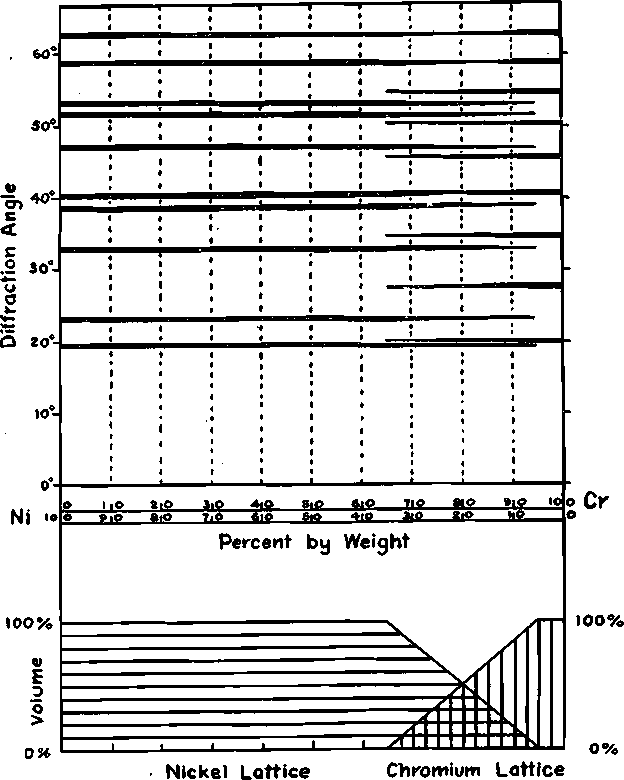
FIG. 3.—CONSTITUTION-PATTERN DIAGRAM; SPACE BETWEEN EACH 10 PER CENT. CHANGE IN COMPOSITION REPRESENTS PATTERN FOR THAT RANGE; HORIZONTAL BANDS ARE SPECTRAL LINES OF CONSTITUENTS EXACTLY AS PHOTOGRAPHED.
between the fusion temperatures of the pure metals. The lattice of chromium is of a different type from nickel, as may be seen from the table. Their patterns are so different as to enable one to follow the changes in structure very easily; Fig. 3 shows the patterns as they appeared on the successive films. The width of the bands are indicative of the intensity of the two patterns; the probably volume of the two lattices is also charted in the same figure. These relative volumes of the two structures are, of course, only approximate. This figure introduces what we shall call the constitution-pattern diagram. Fig. 4 shows photographs of the nickel and chromium spectra along with their Ni 20-Cr 80 alloy.

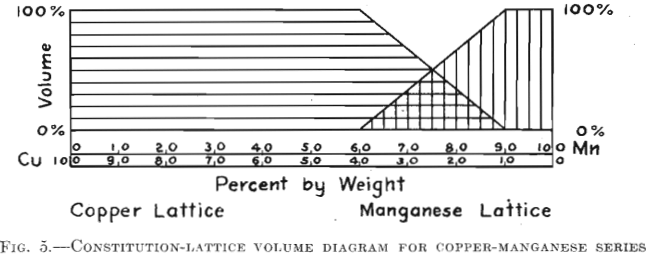
For the type of continuous solid solution series presenting a minimum in fusion temperature, copper-manganese is the example used. A vast difference in crystalline habit exists here and, as in the case of nickel-chromium, it is easy to follow the change in lattice by observing the pattern. Fig. 5 shows that the range of overlapping patterns is from 60-40 per cent, to 90-10 per cent. Mn-Cu. One would expect this range to include the minimum in freezing temperature, but such is not the case.
The iron-nickel alloys present a continuous series of solid solutions with a minimum melting point near the pure nickel range. This series has the distinction of being allotropic. The normal room-temperature condition for nickel is face-centered cubic and for iron (alpha iron or ferrite) body-centered cubic like chromium. The alternate form for iron (gamma iron) is face-centered cubic of almost identical dimensions with nickel. The patterns show that nickel dissolves in ordinary alpha iron to the extent of 25 to 30 per cent. Beyond this point we have the lattice of nickel alone. Gamma iron and nickel are as alike as copper and nickel and no doubt form the same kind of a series explained later.
We may assume that the iron, having a stable range in a lattice so like nickel, would be very soluble, having only to exhibit the tendencies of its allotrope to be completely soluble. In amounts of nickel around 25 per cent.; the carefully annealed metal shows only the body-centered lattice of alpha iron. However, if the metal is heated to a temperature above that of the transition to gamma iron and then quenched, the whole is rendered face-centered cubic. In other words, the range of overlapping patterns is shifted toward the iron end of the series by the quenching. Of course, if much carbon is present the metal is much more inclined to remain austenitic or face-centered. The alloys that, are purely of the nickel lattice are only slightly magnetic, while those of the overlapping range vary up to almost that of iron. Apparently the body-centered crystal is necessary to magnetism in iron.
The effect of thermal treatment was also evident in the case of the nickel-chromium series. In the well-annealed specimens, the chromium lattice was evident as far as 40 per cent, nickel—60 per cent, chromium; while in the same specimens quenched from 1000° C., it was just visible only at 30 per cent, nickel—70 per cent, chromium. This was unexpected, inasmuch as chromium has the higher melting point and would have relatively a more rigid lattice at the higher temperature.
As to the state of aggregation of the two forms of crystallinity existing simultaneously in some ranges of the continuous solution series there is little information, but there is some reason to believe that within the same grain both forms may be found. In the nickel-chromium series, rather large grains were developed by prolonged heating near the melting point. These films revealed, in the main, the characteristic dashed pattern of coarse grains. But in the overlapping pattern range, the stronger pattern alone was of the coarse-grained type; that is to say, above 80 per cent, chromium the nickel was fine grained and below this chromium content the nickel was coarse grained. It would seem, therefore, that a sort of martensitic structure was evolved. Within the grains of the dominant pattern small, perhaps submicroscopic, crystal units of the other lattice were present. In order to escape microscopic detection at high magnification after etching, the weaker lattice must be in extremely small units and likely aided in remaining undifferentiated by a chemical constitution identical with the dominant lattice, so that etching would proceed more evenly. The author hopes to grow excessively large, grains of the alloys in the double-structure range and then study the pattern obtained from a very small number of such grains. In connection with another problem specimens ranging from one to twelve grains only were examined the effect would be much more aggravated by this condition.
As we have seen, many of the continuous solid solution series are really aggregates of two kinds of crystallinity. But this is not necessarily the case. We know that thermal expansion and mechanical stress can alter the size of an atomic space lattice without destroying it or altering its type. The limits of this sort of purely elastic, temporary distortions are very small, perhaps not over 1 per cent, in most cases, roughly in the order of magnitude of the accuracy of our measurements with the spectrometer. It seemed possible to the author that if we could find a solution of two

metals, of very similar atomic volume, and identical in type we might discover a complete series whose atomic arrangement remained homogeneous but whose distances gradually increased from the dimensions of lattice A to the dimensions of lattice B. Actually, as later discovered, the lattice size may differ considerably and still give this condition.
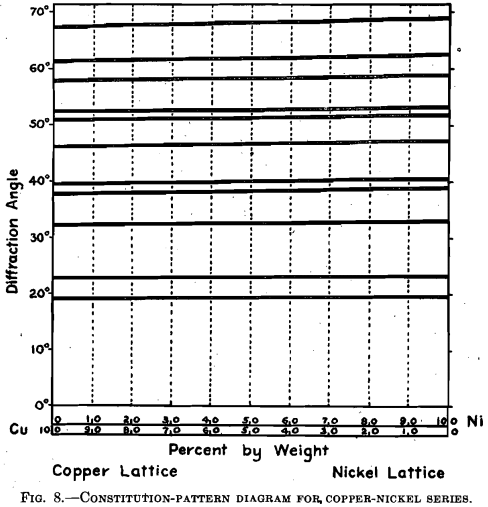
Copper and nickel proved to be one example; the patterns, Fig. 6, differ by about 3/32 in- (2.38 mm.) in the large angle lines. This is a deviation quite sufficient for identification; indeed with the patterns superimposed, the lines beyond the first three appear separate and distinct, as shown in Fig. 7, which was made from mixed powders. Bearing

these facts in mind, the patterns of the nickel-copper series present a unique appearance. In no case was there the slightest appearance of both patterns superimposed. The lattice for the solutions remains perfectly face-centered cubic in character throughout the entire range, the size only changing gradually from the dimensions of one to the dimensions of the other. It may be seen in Fig. 7 that causing solution in the solid to take place, by heating mixed powders, has changed a typical superimposed pattern of nickel and copper into a pattern of a single face-centered lattice of intermediate size. The film is lacking in contrast; the lines are difficult to see, but it offers ample proof of the reality of our true homogeneous lattice. Fig. 8 is the constitution-pattern diagram for the copper-nickel series. The alteration in lattice size, as measured from pattern change step by step, is almost too slight to be seen—yet the change is not quite linear. It is probably linear on an atomic per cent, scale.
Why the stretching or shrinking of the parent lattice in the continuous solutions of the widely differing crystal types studied to date should have been less than our inherent inaccuracies (except perhaps in the manganese-copper series) is not known. It is very likely that tungsten and molybdenum have the single lattice structure throughout their entire range, as they are more nearly identical in structure than even nickel and copper.
If we consider the stresses set up within the single crystal grain by distortions exceeding that of ordinary elastic deformation,, the extraordinary hardness of some of the solid solutions of soft metals entirely lacking a separate system of keying substances becomes easier to understand. The slipping of adjacent layers of atoms must certainly be opposed by such forces.
Another series studied was that of gold and copper. Both gold and copper are face-centered cubic but they are quite different in dimensions. The cube edge of copper is 3.60 x 10⁻⁸ cm. and the same dimension in gold is 4.08 x 10⁻⁸ cm.; i.e., larger by 13.3 per cent. Even half this figure is far in excess of any elastic deformation recorded. It seemed unlikely that this series would be like the copper-nickel series but it showed precisely the same behavior. The addition of 25 per cent, of gold expanded the copper lattice only slightly, while the addition of 25 per cent, of copper contracted the gold lattice only a little. Compositions between these amounts changed rapidly in lattice size with composition, always retaining the perfect face-centered cubic type. Fig. 9 shows, side by side, the spectrograms of pure copper and pure gold. Fig. 10 is the constitution-pattern diagram for the series.

A rather surprising deduction was made from some particularly well- annealed specimens of the copper-nickel and copper-gold series. It resulted from the explanation of some faint lines observed on the films corresponding to the 75-25 atomic per cent, alloys. These lines were entirely without the possibilities of a face-centered lattice. They proved to correspond to spacings just double some of the normal spacings of this lattice. The explanation is fairly simple. If a number of solute atoms were to distribute themselves with the utmost homogenity possible, they would arrange themselves regularly throughout the crystal grain in a manner presenting the greatest possible symmetry. The simplest way to arrange a ratio of 3:1 (75 per cent. A and 25 per cent. B) of unlike atoms is to choose alternate planes of atoms and in these alternate planes replace half of the atoms of B with A atoms. If we choose the planes of greatest symmetry in the structure for this alternate layer replacement we shall have a discontinuity of mass every other 111 plane (Miller indices). This produces a periodicity twice that of some of the normal distances. Bearing in mind that it is mass-periodicity that gives us the pattern we should expect these new lines. As the atomic weights of copper and nickel are in so close agreement, this discontinuity is extraordinarily slight and the surprising feature is that the lines are sufficiently contrasted to be visible. They were quite strong in one gold-copper pattern. This is not entirely a new phenomenon, for the extreme case of this sort of action is observed in the pattern of silver-chloride, in which the chlorine atoms are so entirely different in diffracting power from silver that only the silver spacings are revealed and the fundamental structure is inferred from the spacing of half the atoms. But so far as the author knows, it is the first occasion in which the actual atomic location of the separate metals has been shown in solid solutions. In this connection a reference should be made to the hypothetical structure of cementite composition in the austenitic condition by McAdam. If such material could be isolated it could be absolutely identified with X-rays.
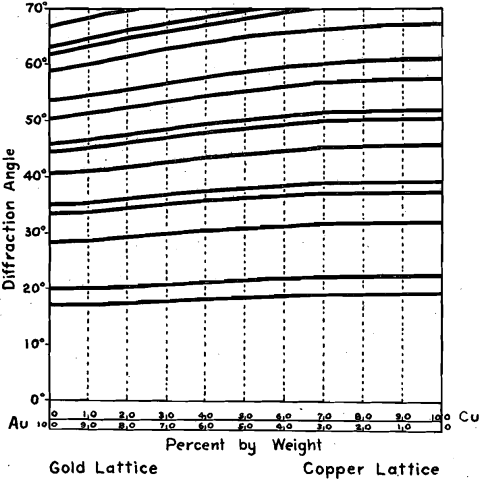
FIG. 10.—CONSTITUTION-PATTERN DIAGRAM FOR COPPER-GOLD SERIES
SUMMARY
- A solid solution forms by replacement of solvent atoms by solute atoms. If the pure solute is of a different crystal type from the solvent, the parent lattice changes very little in dimensions. In such cases, a limit of solubility is reached at which point a new lattice is formed which may be an intermediate or the lattice of the solute.
- Intermediate lattices, based on weak compounds probably, are present in the complex series.
- When two metals, alike in crystallographic type, form continuous solid solutions there may be a gradual change in lattice size from one pure metal to the other.
- Other supposed continuous isomorphous series are actually composed, for some range, of two separate crystalline phases. Both forms are likely in the same grain.
- Thermal treatment may shift the range of overlapping lattices toward one or the other pure metals. The effect is most noticeable if one of the pair of metals is allotropic.
- For some constitutions of perfectly annealed solutions, the location of the solute atoms is probably known.
- No case was observed where solid solution occurs by new atoms filling in the interatomic spaces (if such spaces exist), and it is not predicted that such cases will be found.
