 Apart from conducting a rate test in the correct manner, it’s important to collect the right number of concentrates and at the right times; doing this will ensure that the data you generate maximizes your analysis of flotation response. To properly define the relationship between recovery and time, you need a minimum of four concentrates and four data points on the graph.
 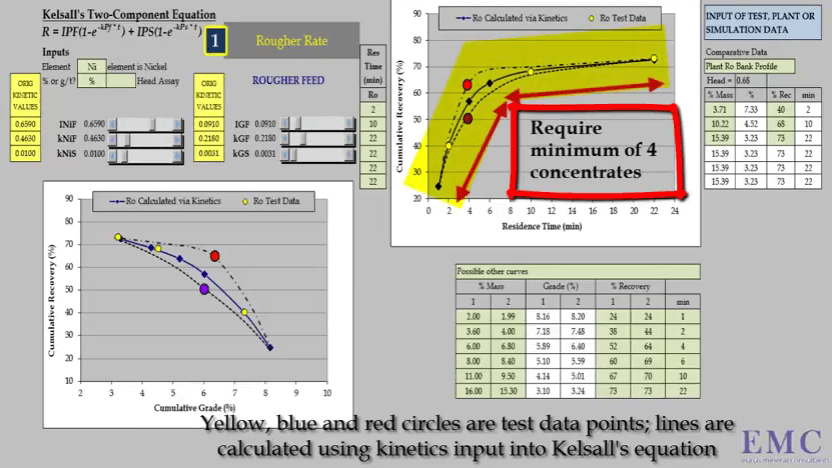 The timing of these concentrates is critical to ensure that the three major characterizing aspects of the recovery time curve are defined accurately. These aspects are the initial slope of the curve; the determination of fast floating rate is dependent on the accuracy of the slope.
 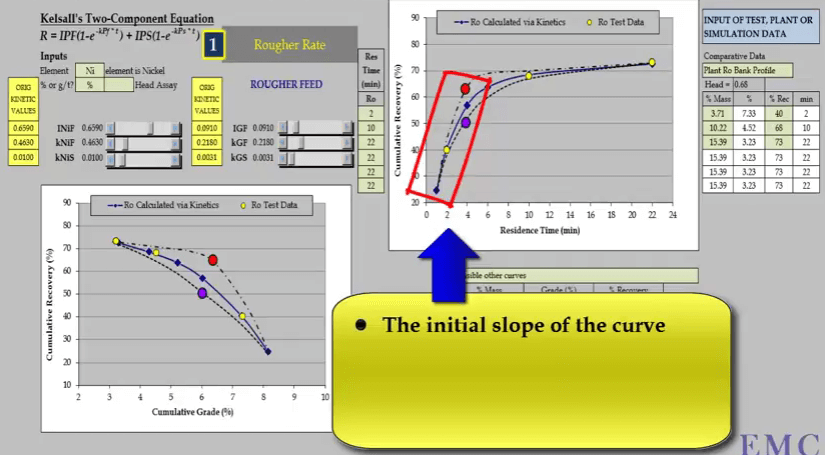 For this reason the first concentrate must be collected within two minutes; two minutes is the maximum time allowed. If concentrate is collected after this, calculated fast floating rate is less than its true value.
 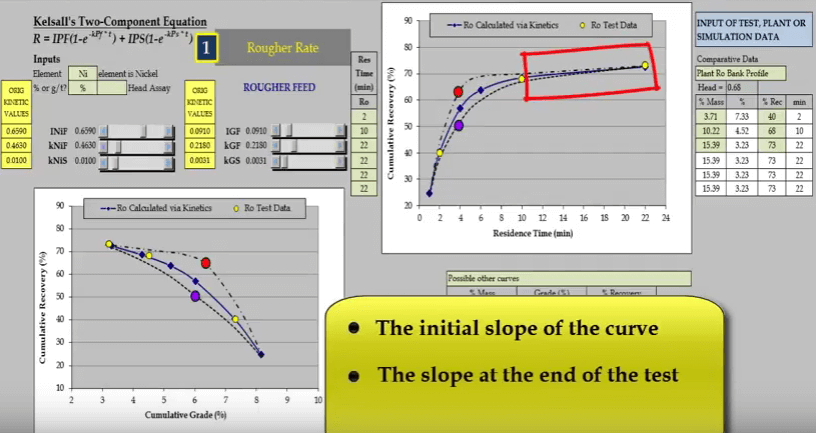 The second aspect is the slope of the curve at the end of the test; this determines the slow floating rate.
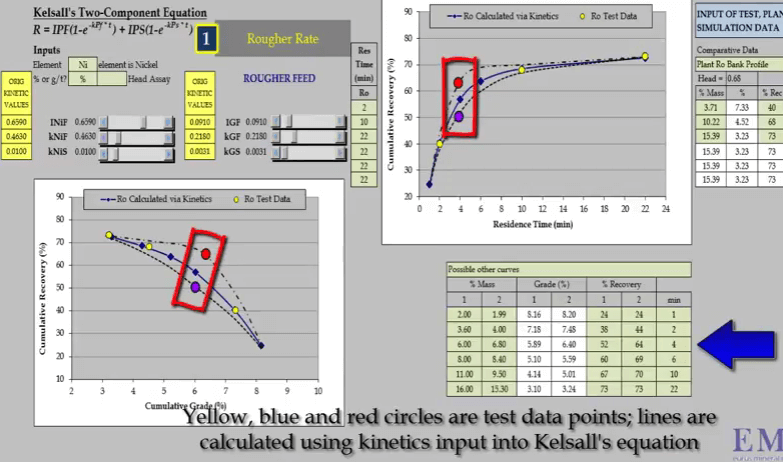
 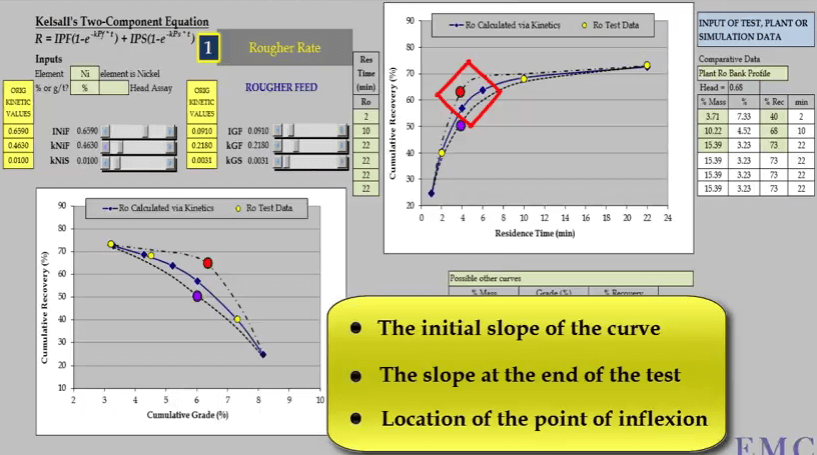 The third aspect is the location and general shape of the point of inflexion of the curve. This illustration of a rougher feed flotation rate test for a slow floating nickel ore- shows why a minimum of four data points are required. Three concentrate collection times are two, ten and twenty two minutes are shown as yellow circles on the two graphs of recovery versus time and recovery versus concentrate grade.
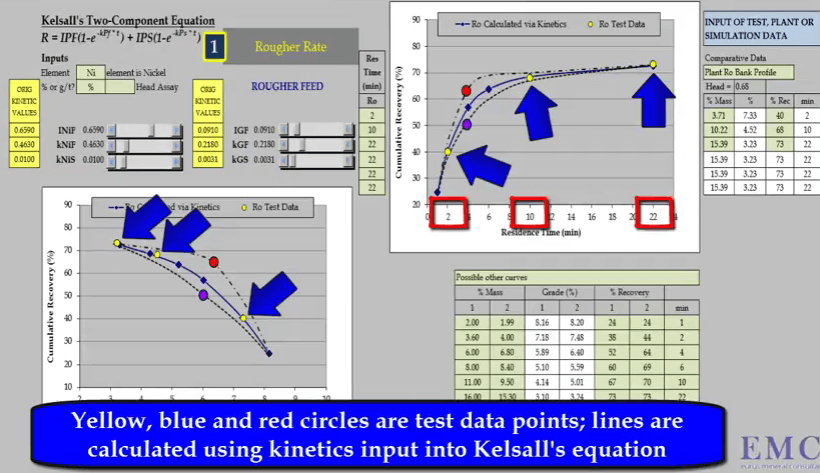
Inevitably the position of two of the points will adequately define only one part of the curve. Here it is a slow floating fraction leaving estimation of the fast floating fraction prone to error. 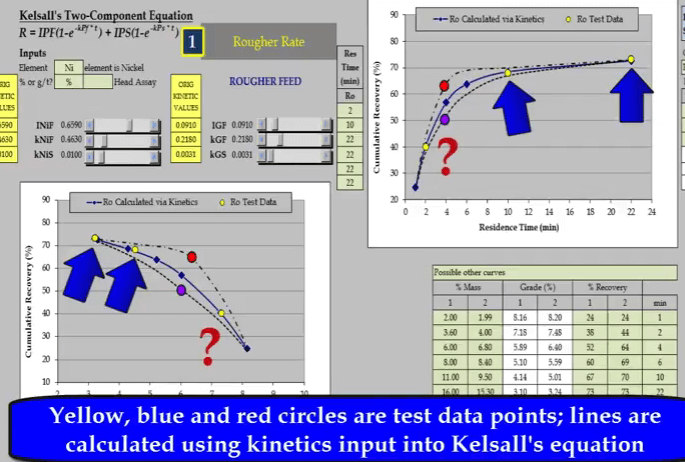 Two other possible relationships that pass through the test points are shown as broken lines. Both these lines have different floatation kinetics.
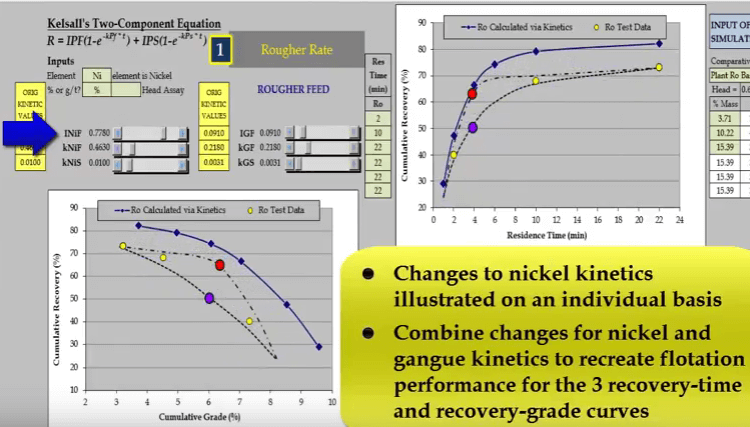
 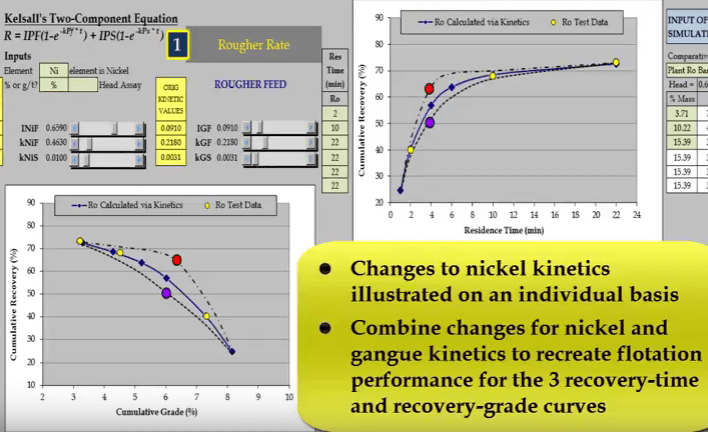 Nickel and gangue kinetics vary considerably depending on where the true recovery time and recovery grade curves lie. If I reduce just a nickel fast floating fraction denoted by INiF;
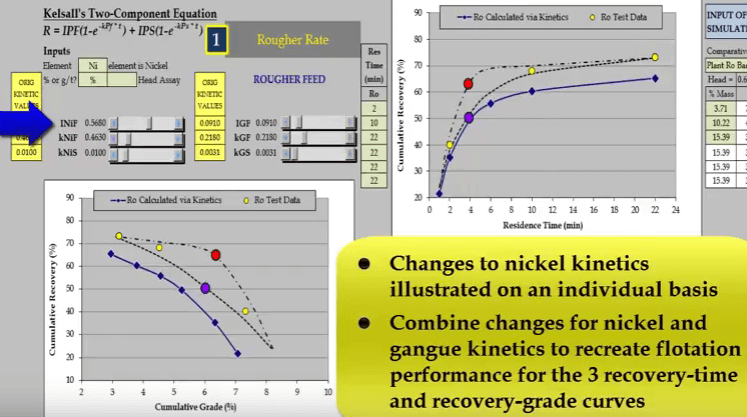 the curve passes through the blue data point and increasing INIF moves the curve so that it passes through the red data point.
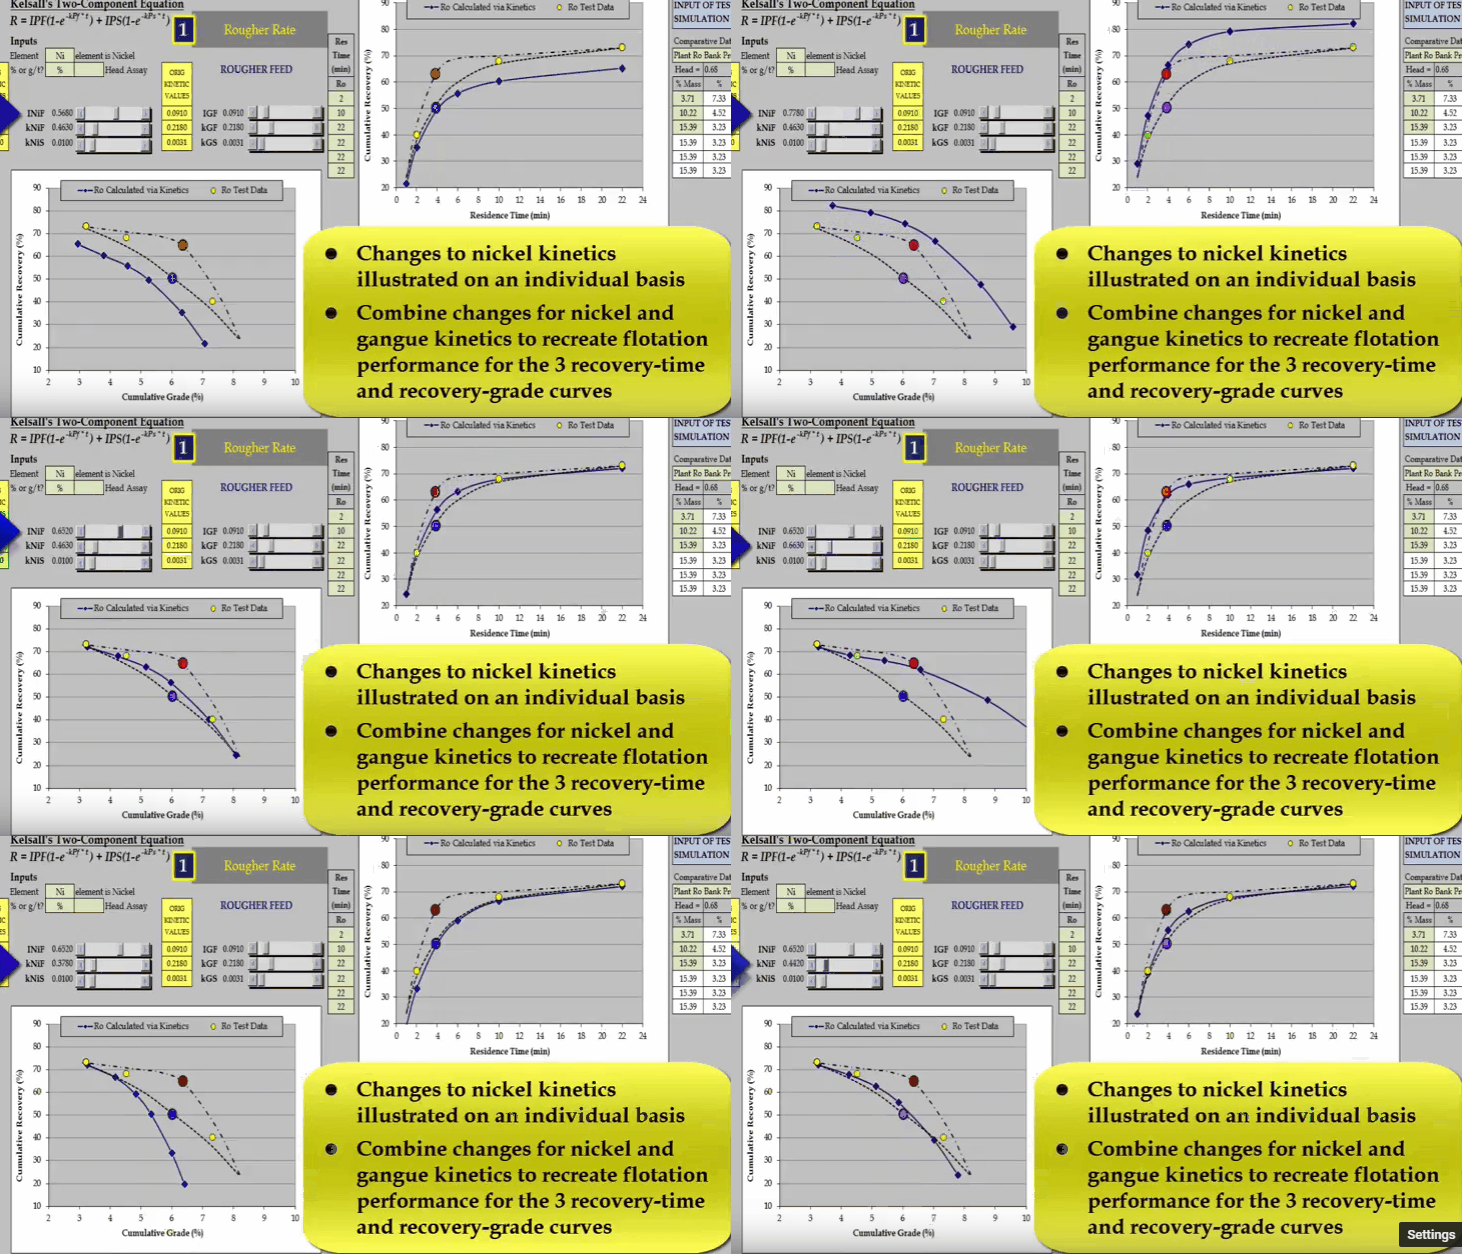
  Similarly, I can do the same with nickel fast floating rate KNIF. The effect is approximately the same but the influence on concentrate grade is much greater.
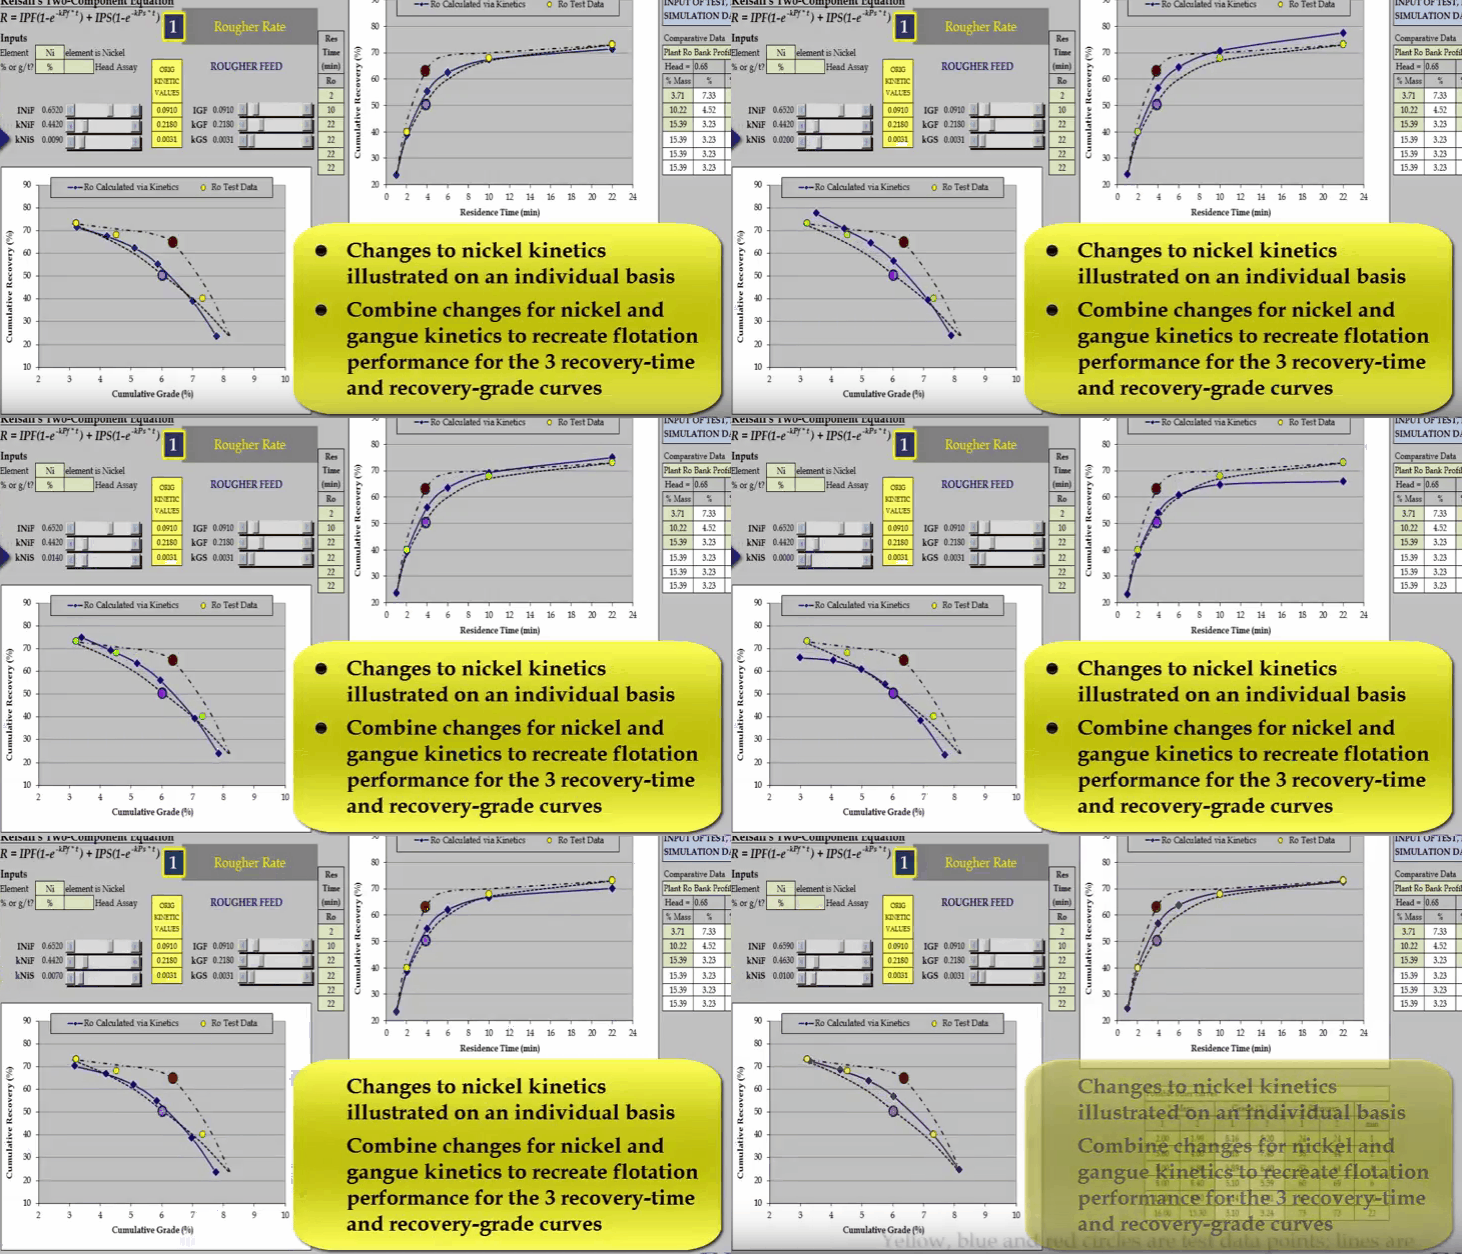
  And finally changing nickel slow floating rate KNIS moves a curve at the end of the float.
The problem with just three data points is that it is unlikely you will be able to estimate the collection time of the middle one so that it corresponds with the inflexion point. As flotation response of the ore and shape of the recovery time curve is an unknown. 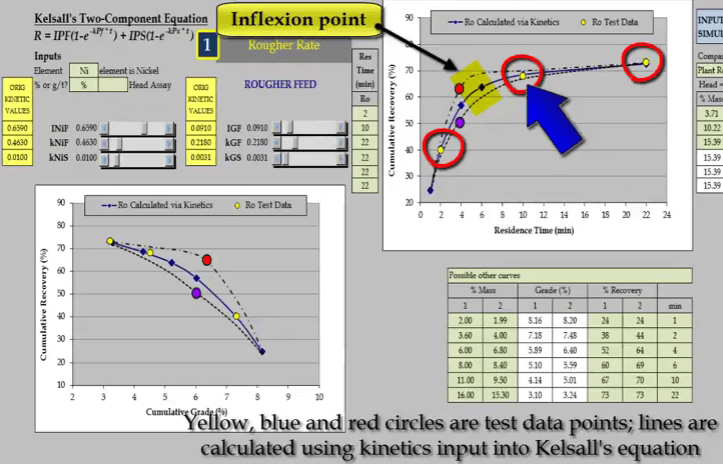 Depending on the ore, the shape and position of the recovery time can vary considerably. It is only when we have a fourth data point that the curve can be fully described. An additional concentrate collection at four minutes denoted by red and blue circles enables the true shape of the recovery time curve to be accurately defined.
If the four concentrate collection times are arranged carefully, they will cover any shape of recovery time curve. 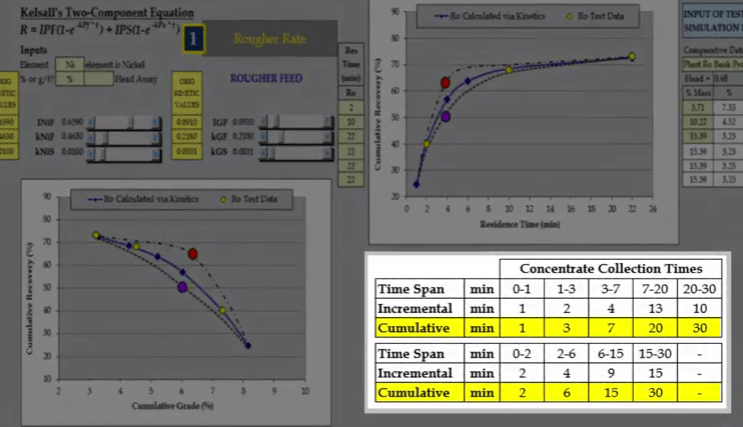 Over the years the time seen here have been found to cover the majority of all types. Concentrate collection times need to be varied in line with the characteristics of the ore. For example shown here is the recovery time for niobium in a carbonate and sulphur flotation stage.
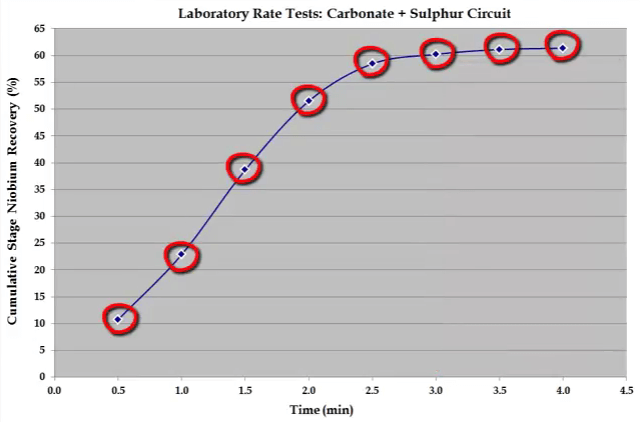
 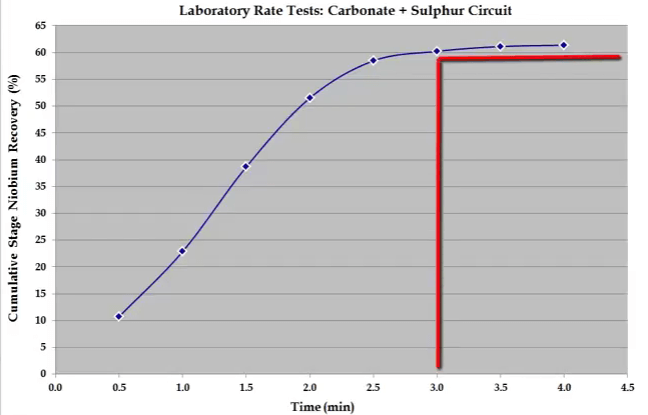 Recovery is rapid and the float reaches a plateau after just three minutes. In this case eight concentrates were collected at half minute intervals up to a total of four minutes.
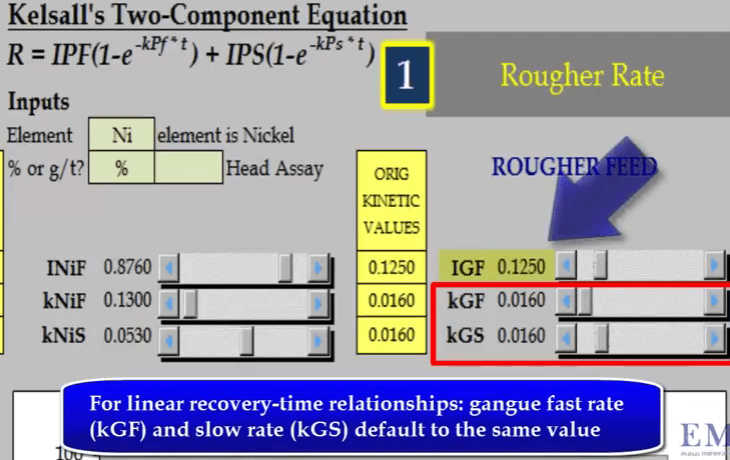
  Sometimes and this usually happens for a nickel ores; the recovery time curve for mass pull is almost a straight line because there is little difference between the floatability and rate of Fast and Slow floating gangue fractions.
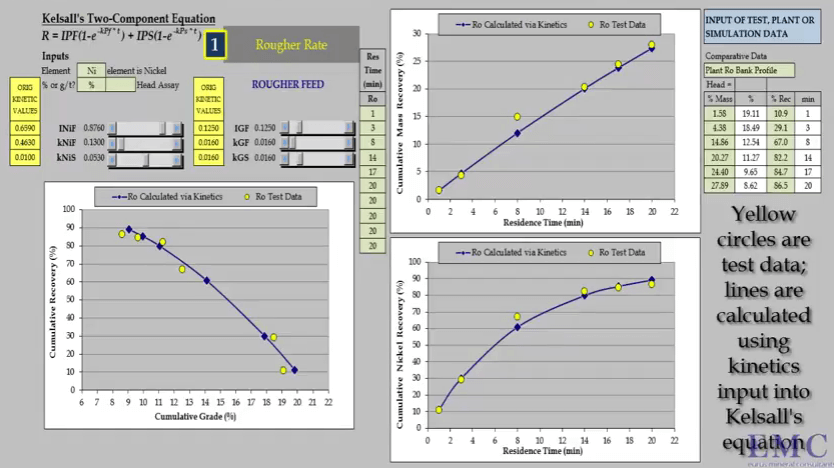
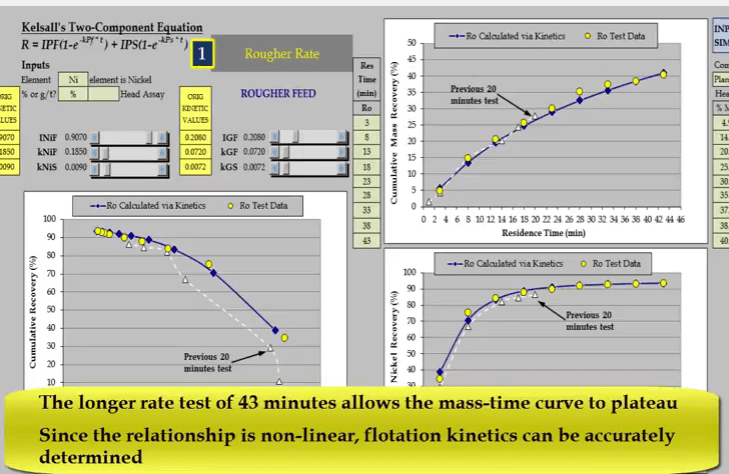
 One of the requirements of a rate test is to float long enough to ensure that the recovery time curve has plateaued or is beginning to plateau.
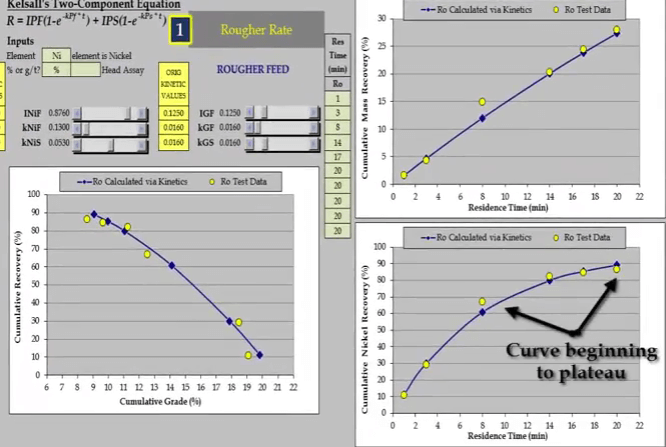
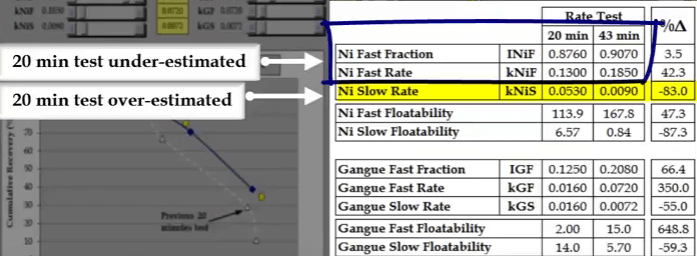
In the 2003 test in yellow; twenty minutes proved to be too short and the mass recovery time relationship is almost a straight line. 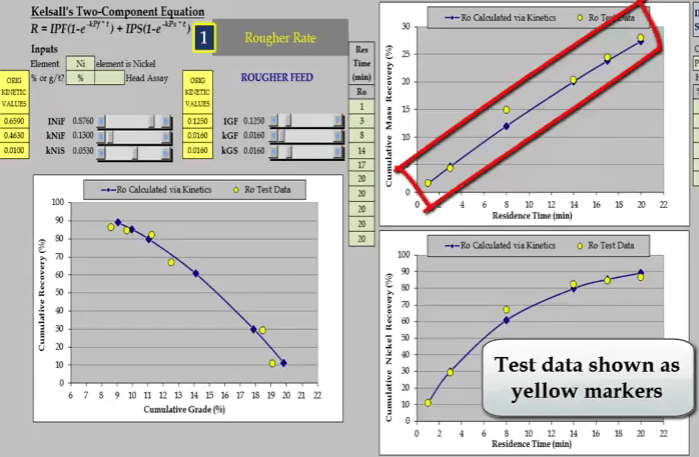 The test was redone for a longer period of time of forty three minutes. From about the twenty eighth minute the relationship is beginning to plateau and the recovery time curve is now suitable for estimating kinetics.
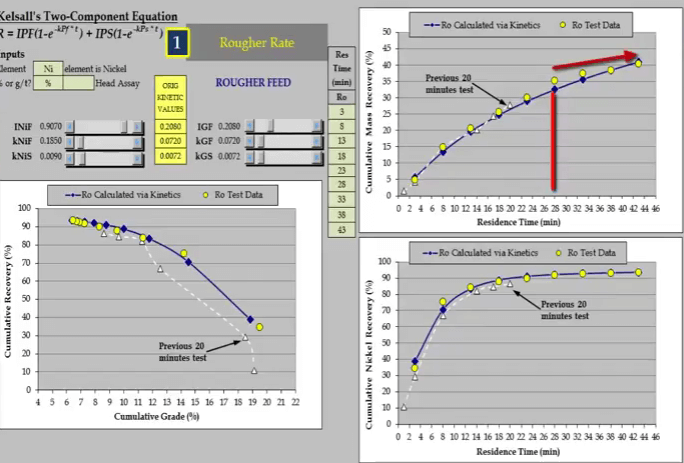 Flotation kinetics are estimated using Kelsall’s two component equation. This format is not suitable for describing a linear relationship. As seen here both fast and slow floating rates default to the same value and the value assigned to the fast floating fraction has no influence.
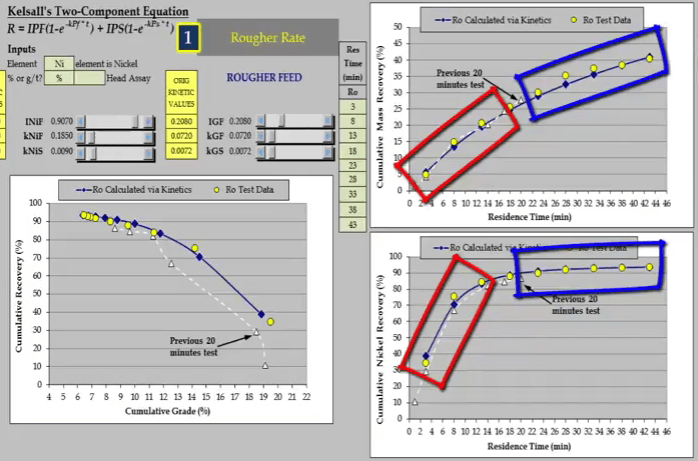
  With its mass recovery time relationship beginnings of plateau, nickel recovery time reaching a definite plateau. Data from the longer test provides a more accurate measure of floatation behavior.
  Note that there are enough concentrate collections of the beginning and end of the test to adequately model fast and slow floating rates.
  The difference in kinetics is significant and is far greater for floatable gangue.
 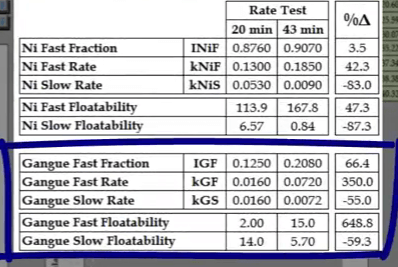 The shorter test under-estimated fast floating fraction and rate and over-estimated slow floating rate.
  A recovery time curve which exhibits a step change increase in recovery after a time consists of two separate components.
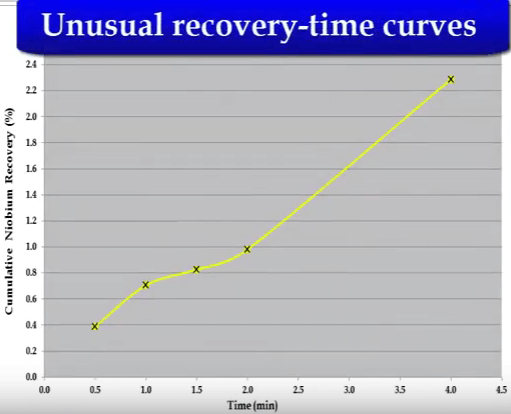 This can be caused by stage addition of reagents mid-way which reactivates mineral or by the presence of a second component that is free to float after the first component has been recovered.
 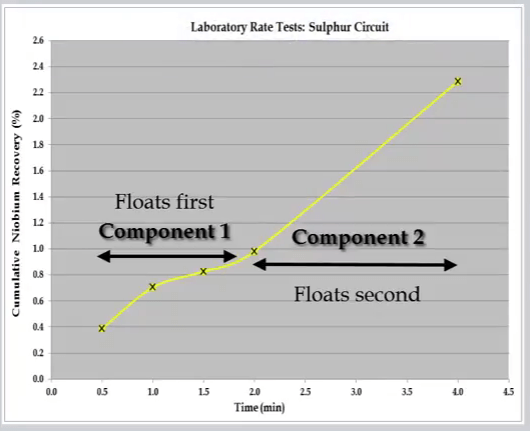 The example shown here is the initial recovery of a very floatable ultra-fine fraction followed by the recovery of a large coarse fraction.
 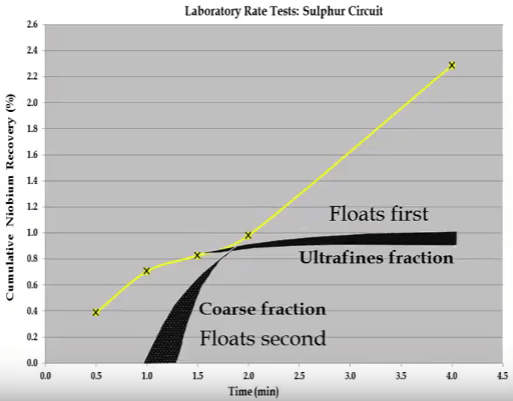 The overall S shaped recovery time curve cannot be modelled with the Kelsall whole equation.
 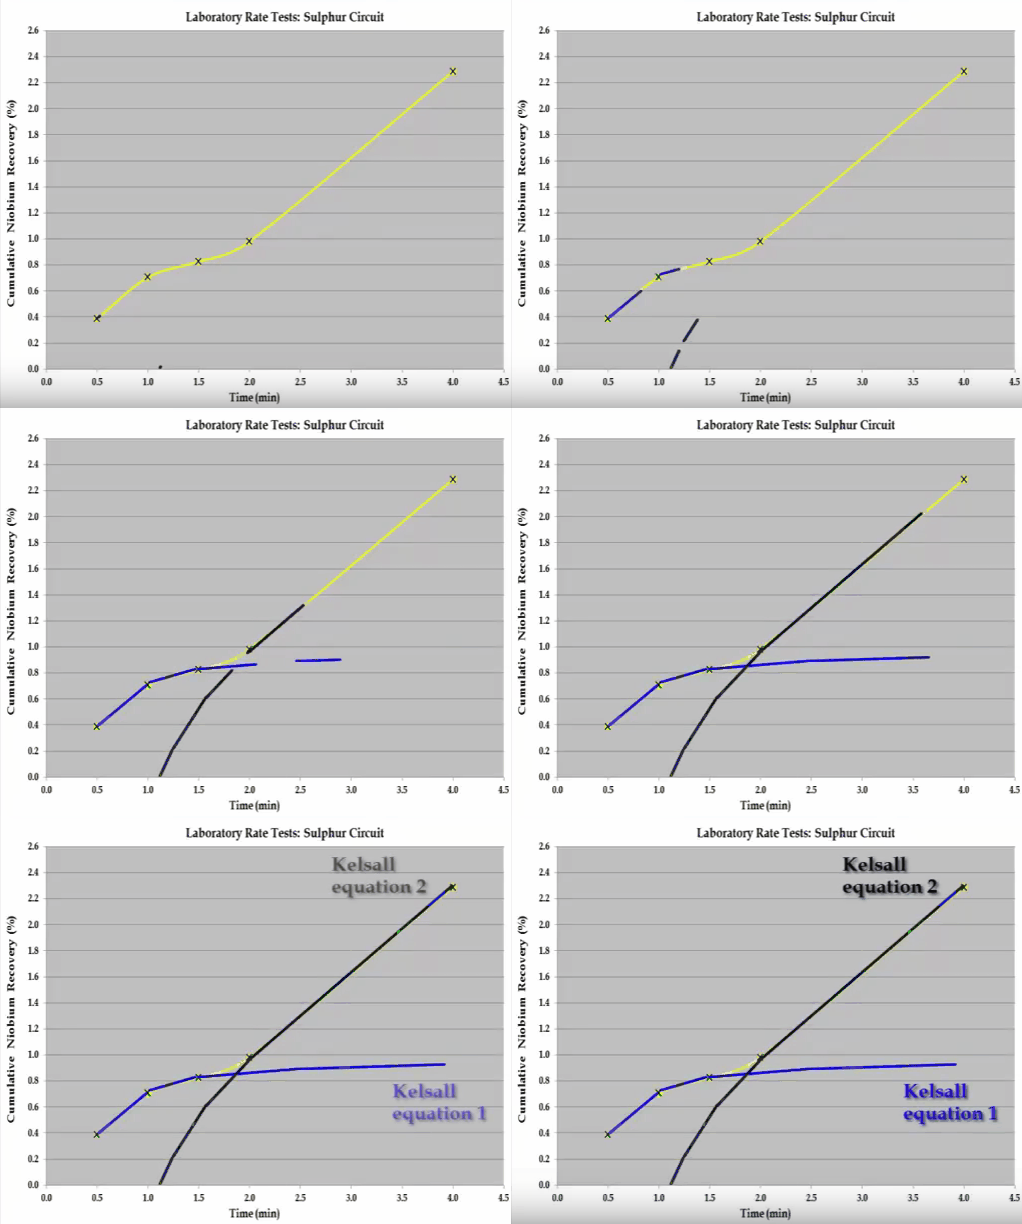 The system consists of two components and this can be broken down into two separate recovery time curves as indicated by the shaded sections. If possible the components should be separated and the rate tests return to obtain the kinetic specific to each component. If this is not possible then the mass grade recovery on time values making up the shaded sections can be inferred, so that when combined the overall recovery time curve is generated. Once this has been done the kinetics can be estimated. This concludes the overview of the important features of a flotation rate test.
