In the previous chapter, the various “laws” of comminution which have been propounded have been studied in relation to the physical process of size reduction and to the available results of experiments into the fracture of homogeneous and heterogeneous materials by impact and by slow compression. In this study it is seen that no satisfactory “law” of comminution has yet been deduced but that a number of more or less empirical expressions are available for the guidance of the designer of crushing machinery.
The present chapter will be devoted to a study of the process of grinding within a real mill. Since within a “tumbling” type of mill the size reduction can result from direct crushing, from shearing or abrasion between the particles in the feed, between the particles in the feed and the mill bodies or between the particles and the mill lining, the process is much more complicated than in the case of simple “free” crushing conditions considered previously. In addition to this complication, however, the motion of the ball charge itself is extremely complex. Thus the precise mode of transfer of the energy to the crushing surfaces can not be simply represented.
For these reasons, a rigid theoretical analysis of the parameters involved in the milling process becomes impracticable, and recourse is frequently made to pilot scale experiments in order to determine optimum milling conditions. Nevertheless, considerable experimental and theoretical work has been done on the crushing process in the “tumbling” mill, and it is desirable that these data should be analysed and an effort made to establish the extent to which the performance of a mill may be predicted from theoretical considerations. The experimental study of the performance of mills has, in general, been along the following lines:
- The energy relationships and theoretical efficiency of the ball mill from surface energy and thermodynamic considerations.
- The size distribution of the product in relation to the mill parameters.
- The rate of crushing in relation to the mill parameters.
Actually these three divisions are not independent since, clearly, if there is a definite relationship between the energy input to a particle and the change of surface area, in reduction ratio, it follows that a given mill, to which the energy input is constant, will lead to a definite rate of crushing; the rate being a function of the relevant mill parameters. In fact the increase in the surface area of the material, produced by the input of a unit of energy to the mill, is increasingly accepted as a criterion of performance for fine milling operations. Without doubt this is due to the technological importance of specific surface in the sub-sieve range, and to the establishment of reasonably satisfactory techniques for specific surface measurements. It is for this reason that Rittinger’s law, even though lacking a sound theoretical basis, is widely accepted as a basis for the calculation of the performance of such machines.
Let us apply these ideas to the derivation of an equation for the rate of grinding in a mill. It follows that if, as appears reasonable, the change of specific surface S cm²/cm³, within a mill depends upon the diameter of the mill, upon the ball diameter and upon the mean diameter of the particle, D, d and b respectively, upon the density of the balls and the pulp, q and σ respectively, on gravity, g, on the speed of the mill, N, upon u the diameter of the exit from the mill, upon E, the energy necessary to change the surface of the material by unit amount and upon the parameters J, U, V and Z, where J is the fraction of the mill volume occupied by the balls (or rods) and the space between them, V the volume occupied by the powder (or pulp) charge, including voids expressed as a fraction of the volume between the balls (or rods), U is the ratio of solid volume to total volume of the pulp, and Z is the ratio of circulating load to the total load when closed circuit operation is considered, and clearly, S will depend on the time of milling, t.
Then we may write symbolically:
S = ∅ (D, d, b, q, σ, g, Ν, Ε, t, J, u, U, V, Ζ) …………………………(5.1)
where, as before, ∅ denotes “a function of”.
The application of the principles of dimensional analysis, already illustrated in Chapter 3, leads to the following equation.
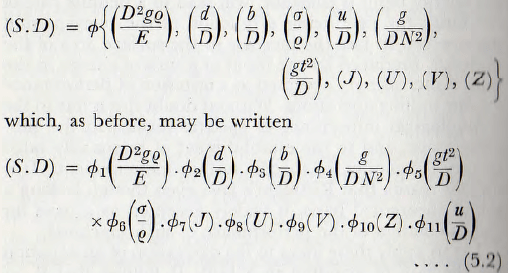
This equation (5.2), is the dimensionless equation giving the rate of production of specific surface in a tumbling, mill.
Purely theoretical considerations are insufficient to take the analysis further, but, in practice, the various dimensionless relationships may be established by reference to experimental data.
Before proceeding with such an analysis of experimental data, however, a digression will be made to introduce briefly a theoretical treatment of the internal dynamics of the ball mill propounded by one of the present authors, Rose. This, as far as the writers know, is the only attempt to deduce the general behaviour, including such factors as ball wear, from purely theoretical considerations. Furthermore, this theory can best be studied in conjunction with the analysis of the experimental results which is
necessary for the evaluation of the above dimensionless equation. This theoretical treatment is of necessity extremely tentative since the dynamics of a mill are of such complexity as to defy rigid analysis. Nevertheless, it is believed to form the basis of a more precise treatment.
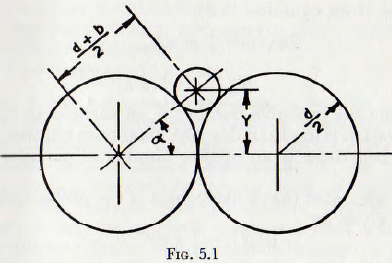
The basic idea underlying this treatment is that the whole behaviour of a ball mill depends on the probability of a particle arriving into a “zone of operation” between two balls, and on the probability of occurrence of some process when it arrives there. Outside this zone, no operation, such as crushing or metal wear, which demands the trapping of a particle between two balls can take place.
From Fig. 5.1 it follows that the zone of operation is a circular area of radius Y, where Y is given by
Y² + (d/2)² = (d + b/2)² = d²/4 + db/2 + b²/4
or, Y = √(db/2) ……………………………………(5.3)
provided b is small compared with d; d and b being the diameter of the ball and of the particle respectively.
Now the maximum number of particles, Nmax, which can be in the operating zone are those which just form a ring around the contact point.
Thus, from equation (5.3),

In fact the probable number Np of particles in the zone of operation is less than this; the maximum number occurring when there is an infinite number of particles in the system.
It is suggested that a likely form of the probability function is given by
∅(Ν) = 1-e-kv …………………………(5.5)
and if it is assumed that about 40% of the maximum number of particles are present when the void space between the balls is just filled, that is when V = 1, then
Np = 4.5 (d/b )1/2(1 – e-0·5V) ………………………………(5.6)
Thus, this equation gives the probable number of particles in the “zone of operation”, in terms of the ball
diameter and the quantity of powder present in the mill.
Consideration is then given to the equilibrium number of particles,Nc, embedded in the surface of a ball and this is clearly given by
dN/dt =Νi – Ν0 …………………………………………..(5.7)
where Ni is the number pressed in to the metal surface per unit time and N0 is the number of particles torn out per unit time.
Certain plausible probability functions are derived for these quantities and so an expression for the equilibrium number of particles embedded in the surface of a ball is obtained; this expression including terms to cover the hardness of the ball relative to the hardness of the particle.
It may then be stated that a relatively very soft particle will be crushed when trapped between
(a) Two bare metal surfaces,
(b) One bare surface and one surface “armoured” with embedded particles,
(c) Two “armoured” surfaces,
whereas a relatively very hard particle will be crushed only between two “armoured” surfaces (it will be pressed into an “unarmoured” one) and probability functions to cover these possibilities are introduced. On the basis of these functions, expressions for the rates of milling, in terms of the various mill parameters, are deduced. Similarly it may be deduced that metal wear will occur when, during relative sliding motion between a pair of balls, the “armoured” portion of the surface of one ball traverses the “unarmoured” portion of the surface of the neighbouring ball. From a knowledge of the equilibrium number of particles embedded in the surface of a ball the probability of such “armoured” to “unarmoured” contact is computed and expressions for metal wear deduced.
The analysis leads to extremely complex expressions for the rate of crushing; expressions which do not lend themselves to a general form of solution. For the two boundary conditions, in which the particles are either very hard or very soft compared with the balls, however, the equations, under certain assumptions, become tractable and the solution for these two conditions can be written in the form
Sa = Kt …………………………………………….(5.8)
where S is the specific surface of the particles, K is a constant, and a is ½ for very soft materials and 4.5 for very hard materials; all other cases falling between these two conditions.
It is interesting to note that the case in which a = ½ corresponds to the “Bond Law of Comminution” discussed previously. Furthermore, for some intermediate hardness there is an approximately (but not strictly) linear relation ship between the increase in specific surface and the milling time.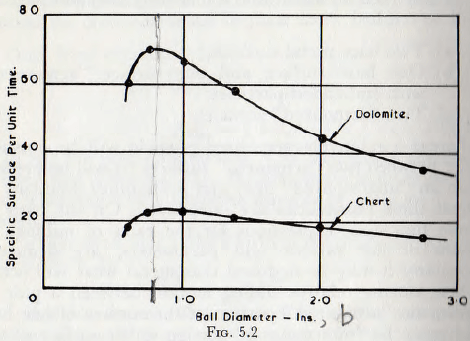
The analysis also reveals that the rate of grinding increases with decreasing ball size; the improvement “brought about by a given reduction of size being greater with soft material. This result is clearly confirmed by Fig. 5.2, in which results of tests by Coghill and Devaney on chert and dolomite, these materials having hardnesses in the ratio of about 3 to 1, are plotted.
Analysis of the fineness of grind in relation to the powder charge reveals that within limits, the fineness of grinding can be increased by reduction of the amount of powder in the mill; all other variables being held constant; a maximum being reached when the powder about fills one-tenth of the space between the balls. When a soft material is being ground, however, this effect is much less marked and also
the maximum is reached when the powder occupies about one-half of the space between the balls. The analysis also shows that the wear on the surfaces of the balls and mill is a function of the quantity of powder present; this function reaching a maximum when about one-tenth of the space between the balls is filled and thereafter decreasing rapidly.
One further matter of interest arises in connection with the concept of a “zone of operation” in the ball mill. It follows from equation (5.3), that the radius of the zone varies as the square root of the particle diameter. Other things being equal, therefore, there is a definitely reduced probability of the smaller particle entering the zone of operation and, consequently, a preferential grinding of the larger particles would be expected; provided, of course, that the particles are neither so big in relation to the ball size that they are expelled from the wedge-shaped space between the balls nor that the balls contain insufficient energy for the fracture of the particles. In fact, the “specific grinding characteristics” deduced by Theimer mid Moser show a marked tendency in agreement with these conclusions. This preferential grinding would also suggest that the size distribution of the material after grinding would not be geometrically similar to that initially, but that a “tail” initially on the right-hand side of the curve would be reduced; this geometrical similarity between mill feed and product would not be expected.
From this theoretical treatment the following tentative conclusions emerge.
- The processes occurring in a ball mill are controlled by the probability of particles entering a “zone of operation” between two balls and by the probability of occurrence of some process after they have entered the zone.
- The rate of grinding of the powder is a function of the quantity of powder in the space between the balls and this function reaches a maximum value when this space is approximately full.
- The fineness of grinding attained by a hard material in a given time of grinding increases rapidly as the quantity of powder between the balls is decreased; a maximum being reached when the powder fills approximately one-tenth of the space between the balls. When a soft material is being ground, however, this effect is much less marked and also the maximum is reached when the powder occupies about one-half of the space between the balls.
- The law giving the change of surface with time of grinding is of very complicated form and includes terms depending upon the hardness of the material undergoing grinding.
- The reduced probability of the smaller particles entering the grinding area would suggest that there is a preferential grinding of the larger particles. Thus it would follow that the size distribution curve of the material after grinding would not be geometrically similar to that initially, but that any “tail” initially to the right-hand end of the curve would be reduced; the negative slope of the curve thus being increased.
- The wear of the ball surfaces is a function of the equilibrium number of particles pressed into the surfaces and this number depends upon the relative hardness of the balls and of the particle. Thus it follows from the treatment, that there exists the possibility that soft balls will wear less than hard ones; since soft balls might acquire an artificial “hard” surface by reason of the hard particles embedded in the surface of the metal. This is in accordance with the practical observations of Engels, who states that the bodies of mills for grinding soft material should be hard whereas the bodies of mills for grinding hard materials should be soft.
- The wear on the surfaces of the balls and mill is a function of the quantity of powder present, this function reaching a maximum when approximately one-tenth of the space between the balls is filled, and thereafter decreasing rapidly.
The general validity of these conclusions will be discussed later in this chapter in connection with the study of the results of grinding tests.
Reverting now to the study of the grinding tests by use of the dimensionless equation (5.2), it is found that Gross has, given figures for the values of “Rittinger’s Constant” for galena, sphalerite, pyrite and calcite, as determined by use of a laboratory ball mill, run under specified conditions, and also figures for the Rittinger’s constant as determined by the use of a drop-weight apparatus.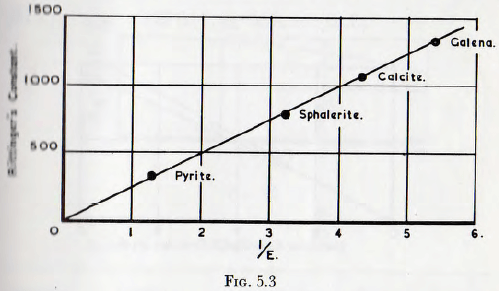
Clearly, since, as follows from the treatment of Chapter 2 the power to drive the mill is sensibly constant, the value of Rittinger’s constant for the mill is proportional in the increase of specific surfaces, S. Furthermore, the drop-weight figures for energy per unit increase in specific surface is directly proportional to E, so when the Rittinger’s constant for the mill is plotted against the results of the drop weight test a curve of S plotted against 1/E for the mill is obtained.
This is done in Fig. 5.3 and a sensibly straight line is obtained; thus it follows that the functional relationship
(S . D) = ∅1 (D²gq/E)
is, in fact, a direct proportionality or
(S . D) = K (D²gq/E) ………………………………………..(5.9)
This relationship is for a batch mill grinding a single material.
This expression can, however, be written as
(S . D) = K(D4gq. 1/D²E) ……………………………….(5.10)
where D4gq is the potential energy in the rods and D²E is the energy associated with the powder, and a further check made on this relationship since, in a given mill, the increase in surface, S, per unit time will be proportional to the density of the grinding bodies, q.
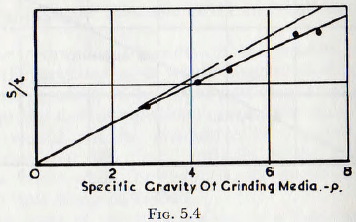
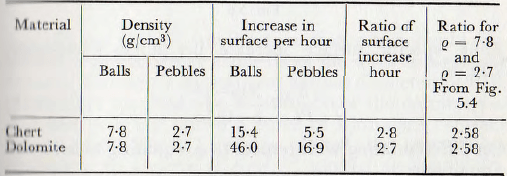
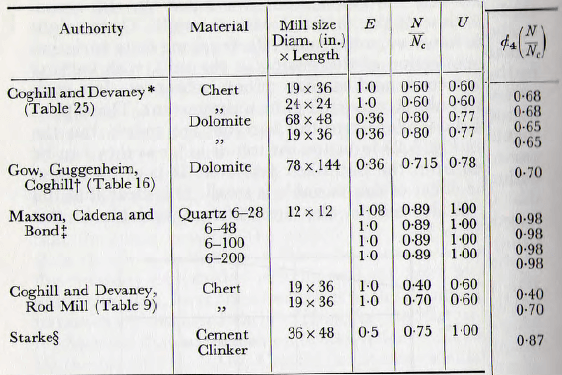
Coghill and Devaney, have given the results (Table 4) for the grinding of chert in a rod mill, in which the density of the rods is varied and these results are plotted in Fig. 5.4. It is at once seen that the two quantities are almost exactly proportional, as required by equation (5.10). If the deviation from linearity is assumed to arise by reason of the existence of the group ∅6(q/σ), then this relationship may be computed. The relationship ∅6(q/σ) so determined is plotted in Fig. 5.5, and it is seen that the influence of this group is not large and it appears probable that the difference arises from the reduced efficiency of crushing at high energy densities, which has been discussed in the previous chapter. These relationships are still further continued, however, by the results of comparative tests, carried out by Coghill and Devaney, in which chert and dolomite are ground by use of balls and pebbles (Table 21). These results are summarized in Table 5.1, and it is seen that the agreement is good.
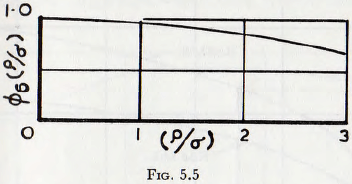
The function given in Fig. 5.5 is probably not highly accurate, since it has been derived from a combination of results for tests on drop-weight crushing, on a ball mill and on a rod mill, but it is of value in that it indicates the trends which may be expected to exist.
This treatment leads to the interesting idea that, for a given material to be ground there possibly exists an optimum density of material for the grinding material. Thus, from Chapter 3, the power P to rotate a ball mill is given by
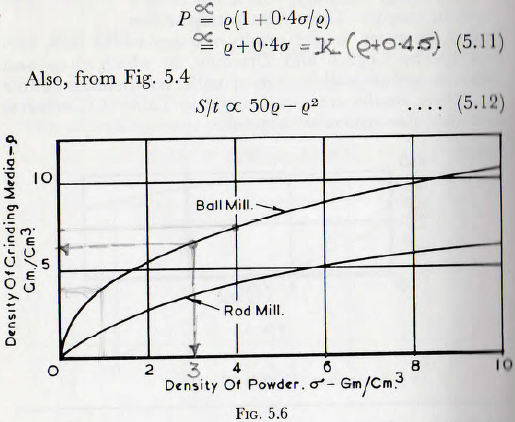
Thus, specific surface increase per horse-power-hour, S/Pt, is

On differentiating with respect to q, equating to zero and simplifying,
q² + 0.8σq – 20σ = 0
or q = -0.4σ ± √(0.016σ² + 20σ) ……………………….(5.14)
From this equation the optimum values of density of balls, for grinding materials of various densities, are calculated and these figures are plotted in Fig. 5.6.
In the same figure is also shown the corresponding curve for a rod mill; and it is seen that the same general form of relationship holds.
These curves are not of great practical importance since the types of materials suitable for grinding bodies are very limited, and so the range of densities available is restricted.
The curves do show, however, that the use of lumps of ore as grinding bodies is a practice which, at least on grounds of milling efficiency, cannot be recommended.
The next pair of groups which may well be studied are
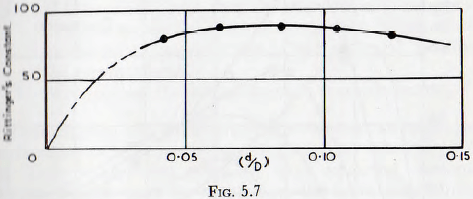
∅2(d/D) and ∅3(b/D) and these are most conveniently considered together. From Table 32 of the work of Gross the value of Rittinger’s constant for various diameters of ball, in a mill of specified size, is given. Since the diameters of mill and balls are known a curve of Rittinger’s constant against (dD), Fig. 5.7, may be plotted; this curve being equivalent to a curve of ∅2(d/D) plotted against (d/D). The variation shown, however, arises in part from the variation of (b/d) which occurs with the change of ball size; this variation arising from the use of the same feed material for each ball size.
Coghill and Devaney, however, give sufficient data, in Tables 27 and 28 of their work, for these effects to be separated, and the basic data from these tables are plotted
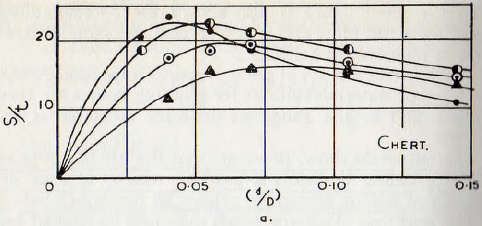
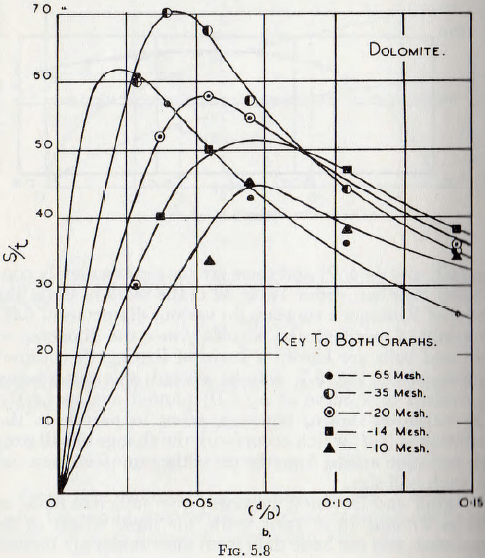
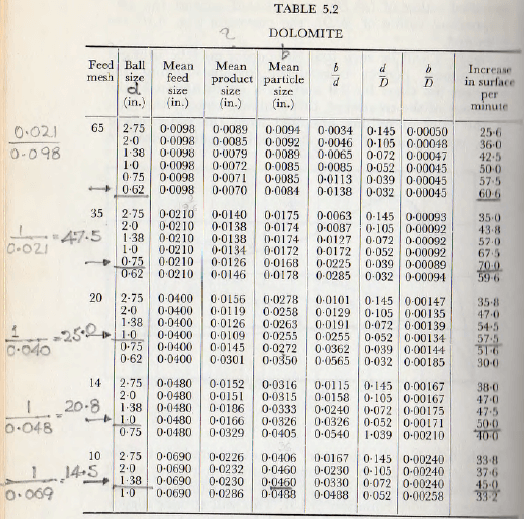
in Fig. 5.8; a base of d/D being used since, again, the ball diameter and the mill diameter are known. Since the time of grinding is comparatively short, it is assumed that the effective particle diameter is the average of the mean particle size of the feed and of the product; the mean particle size of the feed and product being assumed to be the sieve size which passes (or retains) 50 % of the sample. On the basis the data of Table 5.2 may be calculated.
If now the curves of Fig. 5.8 are studied, it will be noticed that the curves are similar in form and that they may be brought into coincidence by:
(1) Multiplying the abscissae of each curve by a suitable constant, such that the maxima are brought on to the same vertical line; this constant being related to the mean particle size of the material to which the curve relates.
(2) Multiplying the ordinates by a suitable factor.
Examination will show that the curves are brought into horizontal coincidence by multiplying the value of (d/D) by (D/b)½ and this product, after squaring, becomes (d²/Db) which may be treated as the new independent variable. This may be regarded as a correction to the (d/D) term to allow for the effect of the ratio (b/D) upon the effect of this term.
When the data are plotted for the dolomite and chert in this way, as in Fig. 5.9, good horizontal coincidence is obtained. (The root scale of this diagram is used merely to enlarge the scale for low values.) It will also be noticed that the maxima for these materials occur at, as closely as can be expected, d2/Db = 2.00 (=1.42²) for the dolomite and 2.56 ( = 1.60²) for the chert.
Since the mill is 19 in. diameter, these values give the equations:

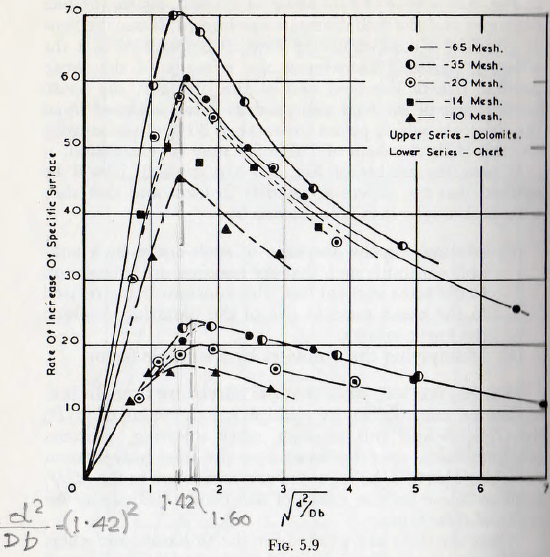
for the optimum size of balls, in terms of particle size.
This should be compared with the expressions
![]()
given by Coghill and Devaney, and it is seen that the agreement is satisfactory. These formulae are also similar to those developed by Starke.
If now the ordinates of the curves of Fig. 5.9, for any specified value of (d²/Db), are plotted against the corresponding values of (b/D), the curves of Fig. 5.10 are obtained.
Again it will be seen that the curves may be brought into almost perfect coincidence by multiplying the ordinate for chert by 2.8 and, as a confirmation of the accuracy of the treatment, this is almost exactly the ratio of the rates of milling obtained from the independent tests, making use of balls and pebbles, summarized in
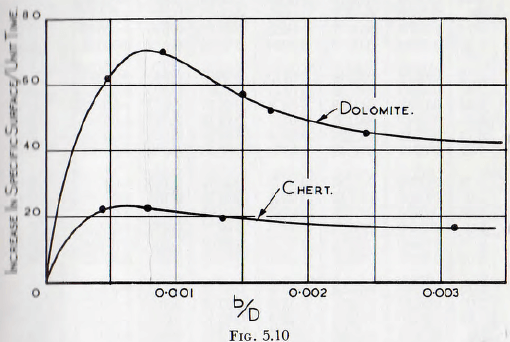
Table 5.1. It will, however, be remembered that E for chert is about 2.8 to 3.0 times that for dolomite, and it will also be noticed that 31/3 x 38 = 55 which is in fair agreement with equation (5.15). This will at once suggest that the curves of Fig. 5.10 will be brought into even better agreement if the quantity d²/Db is multiplied by (E)1/3. However, since in the present work chert is taken as of unit hardness, this result is best expressed as (d²/Db)(Ec/E)1/3, where Ec is the value of E for chert. This quantity is then used as the complete independent variable.
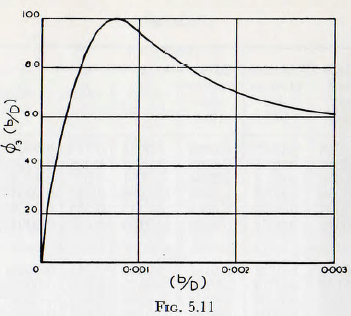
Thus, the functional relationships (d/D) and (b/D) may be summarized into the two curves of Fig. 5.11 and Fig. 5.12; where Fig. 5.11 consists of the curves of Fig. 5.10 brought into coincidence by multiplying the ordinates, of the curve for chert by 2.8 and then plotting the resulting curve on a scale such that the vertex gives 100%, and
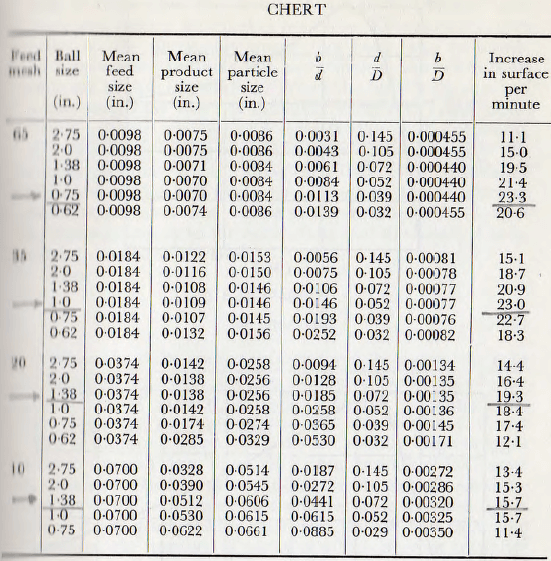
Fig. 5.12 is the resulting curve when the data of Fig. 5.9 are brought into coincidence by the use of the curve of fig. 5.11, the resulting curve being plotted on a percentage scale.
Consider now the form of the curve Fig. 5.12. For a given size mill and particle, but with an extremely small ball, the rate of grinding will be low; since the ball will not contain sufficient energy to produce much new surface. With increasing ball size, however, the rate of grinding
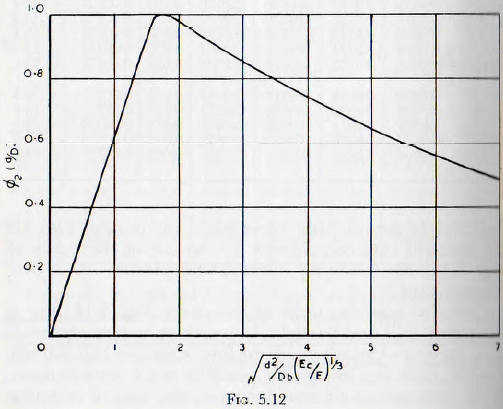
will increase since the increased energy will bring about increased surface production per blow. This gain is in part offset by the decreasing number of balls, and so blows, with increasing ball size but, nevertheless, the result is an increase in rate of grinding. When the balls have reached a size such that there is sufficient energy to crush practically any particle which presents itself then, theoretically, the rate of grinding would remain constant since the energy produced by an impact of a ball is proportional to the cube of the ball diameter, d³, whilst the number of impacts, per unit time, varies as the number of balls, that is, varies inversely as the cube of the ball diameter, that is, directly as 1/d³.
Thus S/t ∝ d³(1/d³) = constant …………………..(5.17)
When the balls are excessively large, however, the rate of grinding decreases since, as explained in Chapter 4, the production of surface per unit of energy decreases with very high energy densities and also the efficiency of the blow is impaired when the balls are unduly large in relation to the mill size. Thus, the falling branch of the curve is obtained. (In fact this reduction is over-emphasized by the use of the root scale; on a natural scale the decrease is much more gradual.) Furthermore, as the ball diameter
increases, the number of particles which may be trapped, at a point of contact, is increased and since an impact which contains enough energy to crush a single particle does not necessarily contain enough to crush two, and so on; this cause in itself can result in a reduced rate of grinding.
Thus several causes operate to reduce the rate of grinding with excessive ball size and this is exactly what has been found by experiment. It is interesting to note that the results of Gross, Fig. 5.7, are in close agreement with those deduced from the work of Coghill and Devaney, since a suitable change of the scale ratios will bring the curve of Fig. 5.7 into extremely close agreement with that of Fig. 5.12.
Turning now to Fig. 5.11; if the ratio of (d/D) is constant then in fact (b/D) is directly proportional to (b/d); the ratio of particle diameter to ball diameter. It follows from equation (5.3) and the explanation given earlier, however, that the number of particles which would be crushed between two balls is given by the expression
N ∝ √b ………………………… (5.18)
when b is small compared with d.
Thus, for the initial part of the curve, the rate of grinding would be expected to vary as the square root of the particle diameter and, in fact, this part of the curve of Fig. 5.11 Coincides closely with such a relationship. As the particle size increases, however, the angle α, Fig. 5.1, increases until, at a certain critical particle size the particle is expelled from between the balls; because the frictional forces are insufficient to hold it in place. Clearly, when this condition is reached the particles are expelled, instead of crushed, and the rate of grinding should, ideally, fall to zero. Since in practice, however, the particles have a range of sizes and the ball surfaces are not perfectly smooth, the curve shows a steady decrease in grinding rate, instead of a sudden drop to zero.
This view can, to some extent, be confirmed as follows. For the maximum, at which projection commences, (b/d) =0.00075. Assuming this condition also coincides with the maximum of the curve of Fig. 5.12, (d²/Db) = 2, or (d/D)² = 2 x 0.00075. Thus d/D = 0.04 and so (b/d) = 0.00075/0.04≅0.02.
Thus, cos α = d/1.02d= 0.98 or α =11° 30′ approx. Also a study of the forces acting on the particle shows that the coefficient of friction, µ is given by µ = tan α or µ ≅ 0.2; this value being quite as close to the value which would be expected as can reasonably be hoped.
The influence of the ratio of rod diameter to mill diameter on the rate of grinding for a rod mill may now well be considered, and in Fig. 5.13 are given curves of the rate ol surface production related to (d/D) ratio, based upon Table 11 of the work of Coghill and Devaney. Although the data on the point are limited, it appears that the rate of grinding increases steadily with the diameter of the rod and for large rods becomes sensibly constant. This result is not surprising, however, since the rods act as crushing mils, and all the particles have to pass between the crushing, surfaces. Thus, the probability of trapping a particle is not such an important variable as with balls as the grinding
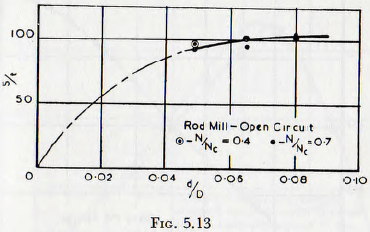
media. Clearly, thus, the rate of grinding will increase initially, after which the increased production per impact is offset by the reduced number of impacts per unit time; this leading to a constant rate of grinding, as suggested for the ball mill.
In all cases the production of specific surface would be expected to be directly proportional to the time of grinding and so it follows that
∅5(gt²/D) = (gt²/D)½ ……………(5.19)
Finally, there is the question of how the rate of grinding varies with the group (g/DN²); that is, from Chapter 3, with (N/Nc).
In Fig. 5.14 is given the values of Rittinger’s constant, at various speeds, as determined by Gross for batch milling a dry powder. From this curve it is seen that the value of Rittinger’s constant, which is proportional to the rate of increase of surface of the powder, varies almost directly with the mill speed. Theoretically, the charge would centrifuge at N/Nc = 1.0 and, since there can then be no grinding, the curve should theoretically drop to zero along a line coincident with the line N/Nc = 1.0. In
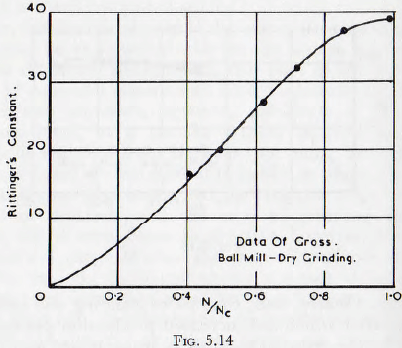
practice, since there is slip between the mill shell and charge, the charge does not centrifuge at N/Nc = 1 .0, but the operation takes place progressively over a range of speed. Thus, the curve would be expected to gradually fall to zero for speeds of rotation greater than the critical.
In Fig. 5.15 are given the results of tests, by Coghill and Devaney, on a rod mill wet-grinding chert on open circuit. In this case the rate of grinding falls rapidly for speeds in excess of about 65 % of the critical; this result being in contrast with that for dry milling, just quoted, in which no such fall occurs. This decrease in the rate of grinding at high speeds of rotation, when wet-grinding, would be expected. Thus, for a very wet pulp or for a dry powder, there would be no appreciable cohesion of the powder charge and so centrifuging of the grinding media would be uninfluenced by the presence of the pulp and would occur at, practically, the critical speed.
A moderately dry pulp would, however, exhibit considerable cohesive strength and so the balls would tend to
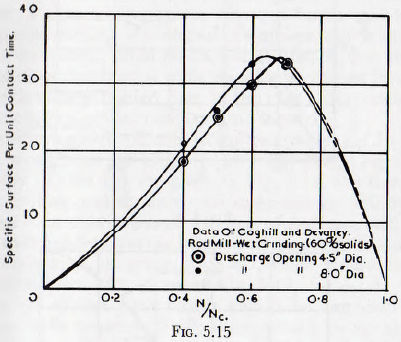
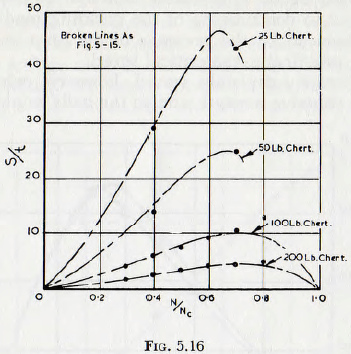
adhere to the mill shell. For very cohesive pulps, the adhesion might be sufficient to allow a considerable portion of the charge to be carried around with the shell, even when the actual speed of rotation is considerably below the critical. This explanation is sufficient to account completely for the observed results. In fact this phenomenon is frequently observed in ball mills used to mix the pigment into the liquid vehicle in the manufacture of paint. Similar results for tests on ball mills are shown in Fig. 5.16, and it is seen that curves of the type shown in Fig. 5.15 fit the experimental points well.
These results can be summarized in a curve of the form of Fig. 5.17; this curve giving ∅4(N/Nc) in terms of (N/Nc) and the pulp composition. Unfortunately there are
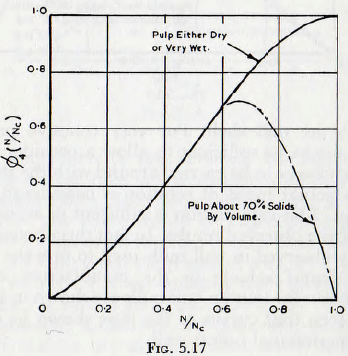
insufficient data for the effect of pulp composition to be fully evaluated but linear interpolation between the curves of Fig. 5.17 is probably sufficient for most purposes; especially as but few mills run at much above about 75% of the critical speed.
It will be noticed that in Fig. 5.15 the increase of specific surface per unit contact time is plotted for the continuous circuit operation and that when plotted on this basis the curves correspond with those for batch mills. Thus it follows that if the surface produced per unit contact time is used, a direct comparison between batch milling and continuous milling is obtained. Doubtless this is the basis for the statement, often made without proof, that the performance of continuous mills may be predicted from tests on batch mills provided that, in the case of the continuous operation, the actual contact time is used.
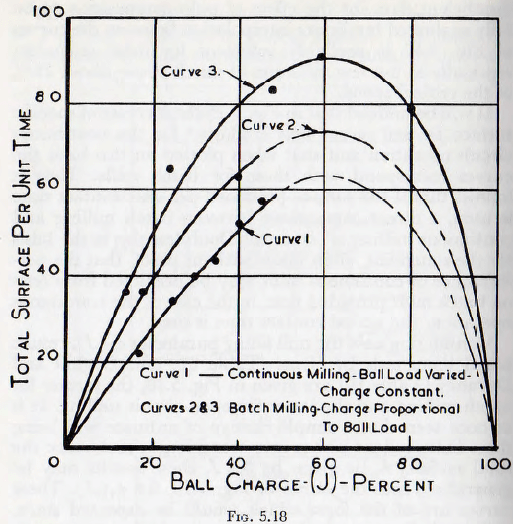
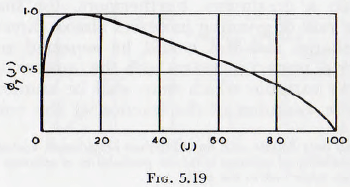
Considering now the mill filling parameter ∅7(J), results based upon tests by Gross (Table 32) and Coghill and Devaney (Table 19) are given in Fig. 5.18, the former for batch milling and the latter for open-circuit milling. It is at once seen that a simple change of ordinate will bring these independent curves into coincidence; and, since the total surface, S is given by S x J, these results may be generalized into the curve of Fig. 5.19, for ∅7(J). These curves are of the form which would be expected since, with no balls present (J – 0) there would be no appreciable grinding. Similarly, when the mill is packed full with balls (J= 100%) there can be no ball motion and so no grinding. In between these values the rate of grinding must attain a maximum. Furthermore, for small ball fillings the rate of grinding increases almost directly with the ball charge and this would be expected since the probability of impact increases with the number of balls.
The next variable which may well be studied is the effect of the variation of the fraction of the void space
between the balls which is occupied by solid particles, that is the function ∅9(V). In Fig. 5.20 are plotted the results of a number of tests by Coghill and Devaney (Tables 9, 13 and 14) for ball and rod mills grinding various materials at various speeds; the results being correlated by the elimination of the effects of critical speed by the use of a multiplicative factor, and again the agreement is satisfactory.
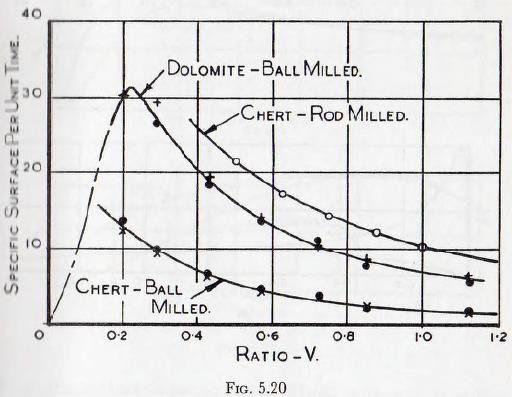
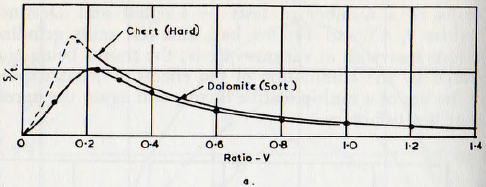
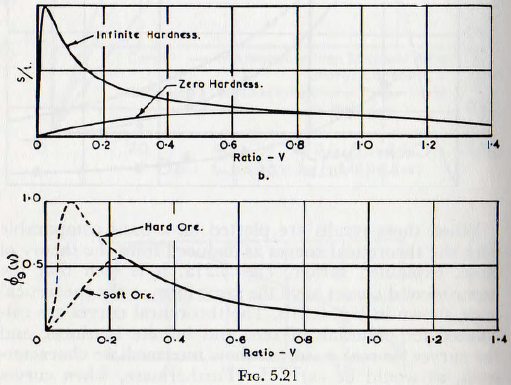
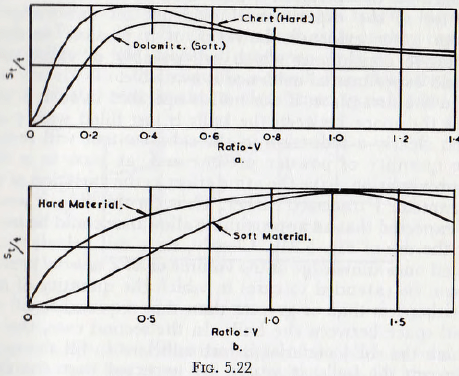
When these results are plotted on a basis comparable with the theoretical curves as deduced from the theory of Rose, explained earlier, Fig. 5.21a, it is seen that the experimental curves have the same form as the theoretical ones, shown in Fig. 5.21b. The theoretical curves are calculated for materials of zero and infinite hardness, and the curves for real materials show intermediate characteristics, as would be expected. Furthermore, when curves of total surface change per unit time, Fig. 5.22a, are plotted
and compared with those calculated theoretically, Fig. 5.22b, the agreement in form is again seen to be reasonably good.
Thus these results support the general validity of the theoretical treatment proposed by Rose; this treatment being, as far as is known, the only one so far proposed by which the effect of the mill parameters has been deduced
from theoretical considerations. Until a theory is sufficienttly developed, however, to allow the calculation of this function from the basic physical data, the curve of fig. 5.21c probably gives the value of ∅9(V) with an accuracy sufficient for design purposes.
The question of the effect of the consistency of the pulp ∅8(U) would appear to be, at least as a first approximation, one which is fairly easily treated. However, the published data relating to this variable are in fact so conflicting as to render impossible the drawing of firm conclusions.
When grinding a pulp, a mill may, ideally, be operated in accordance with either of two limiting cases; one in which the pulp just fills the space between the balls and the other in which the solid material in the pulp just fills that space. In addition there are an unlimited number of other possibilities, in which neither of these conditions are observed, and it is probably the great number of possible conditions of operation which lead to the inconclusive nature of the experimental evidence on this variable. From other evidence, however, it is possible to draw tentative conclusions which are possibly of value until sound experimental evidence is available.
In the first place, if the mill is operated in such a way that the space between the balls is just filled with pulp, then clearly a reduction in the solid content will reduce the quantity of powder present and, at least to a first approximation, have the same effect as the variation of the parameter V discussed earlier. Thus, for this case, it would be expected that an approximate allowance could be made by the use of Fig. 5.21c. Clearly, since this calculation is based on a knowledge of the volume of solid material present it can be extended to cases in which the quantity of pulp is either less than or greater than that required to fill the void space between the balls. In the second case, that in which the solid material is just sufficient to fill the space between the balls, it would be expected that the consistency of the pulp would have but little effect and, as a first approximation, may be neglected.
In both cases the fluidity of the pulp will have some effect, in that, with a more fluid pulp the finer particles will be washed from between the balls and the efficiency of the crushing process improved. This action will also lead to an amount of selective grinding, but this subject will be treated in a later chapter. Thus, an approximation to the value of ∅8(U) may be made.
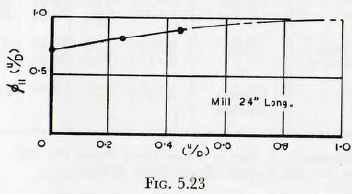
The diameter, u, of the exit aperture from a mill would be expected to have but little effect upon the rate of milling since, other things being equal, variations in this dimension will merely vary the flow rate through the mill. In addition the effects of variation of this quantity are included when the calculations are based on the actual contact time of the material with the mill. There might remain, however, some small effects arising from variation in the perfection of the mixing in the mill, with varying exit diameters, and similar minor influences; but such factors would be expected to be unimportant. The experimental data relating to this variable are sparse, but the curve of Fig. 5.23 indicates the trends as far as they can be deduced from the published evidence. It is at once seen that the effect of this variable is small. It is clear that the length of the mill is also a significant variable in this
respect; since this affects the angle of slope of the surface of the charge, but there are insufficient data for the relationships to be evaluated.
The question of the influence of the ratio of new feed to circulating load does not appear to have received systematic treatment, but general conclusions based on the previous treatment may be drawn.
From the previous treatment it is clear that, provided the ratio of ball size to average particle size is not too small, the rate of grinding is not greatly influenced by the size distributions of the granular material, and the foregoing work may be used for the estimation of the increase of surface in the mill. Thus, the combined feed may be treated as a normal feed and the product size calculated
from it by the use of the various functional relationships already discussed.
On the basis of the present analysis equation (5,2) for the computation of the change of specific surface, may be simplified.
It has been suggested that ∅1(D²gq/E) = (D²gq/E) and ∅5 (gt²D) = (gt²D)½, so it follows that

where ∅2 (d/D) is read from Fig. 5.12,
∅3 (b /D) is read from Fig. 5.11,
∅4 (Ν/Νc) is read from Fig. 5.17,
∅6 (σ/q) is read from Fig. 5.5,
∅7 (J) is read from Fig. 5.19,
∅9 (V) is read from Fig. 5.21c,
and ∅11 (u/D) is read from Fig. 5.23,
the graphs ∅8(U) and ∅10(N) being omitted since it has been shown that their effects are largely included by the correct computation of the values of other variables.
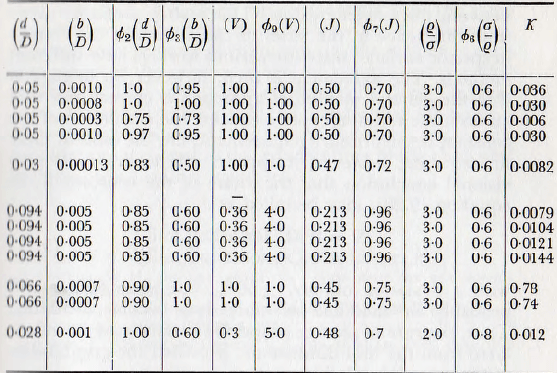
The value of the constant K must be determined by reference to the results of experiment and there is an amount of data available for this purpose. In Table 5.3 are given a number of values; based on C.G.S. units, but with E taken as unity for chert. All these figures are seen to be of the same order, there being about a 3 to 1 ratio between the extreme values. This scatter probably arises from difference in the bases of calculation of the change in specific surface; since the various workers have different methods. The agreement is such, however, as to suggest that the general method of approach is correct and that an accurate series of experiments for the evaluation of the constant is the primary requirement. On the basis of these limited data, however, it appears safe to draw the provisional conclusion that the value of the constant K, in equation (5.20), may be taken as
![]()
with a deviation of, say, ±50%, but these figures will probably be modified as more data become available. Thus, the rate of change of specific surface may be calculated from the mill dimensions; provided the grindability of the material, relative to chert, is known.
There now remains the question of the grinding of a mixed material; this case being practically important since, for example, any ore contains at least two components. The problem has been studied by Holmes and Patching, and some interesting tentative conclusions have been reached.
The rate of grinding is written in the form:
M = kW/ξ ……………………………………… (5.22)
where M is the weight of product per revolution, ξ is the bulk density of the material, W the weight of material in the mill and k is the specific rate of reduction, and it is shown that the ratios (k1’/k2′) and (k1/k2) are approximately equal and sensibly independent of the proportions of the two components in the mill; k1′ and k2′ being the specific rates of reduction for the two materials milled separately and k1 and k2 for them milled together.
Thus, it appears reasonable to conclude that when two materials are ground in combination, the rate of production of surface in each of the components is in the same ratio as it would be if the materials were milled separately. Furthermore, the rate of change of specific surface in each component is the same as when the component is milled separately. This view is also confirmed by Gow, Guggenheim, Campbell and Coghill, who show that for tests on chert-dolomite mixtures, the rate of size reduction is, very roughly, proportional to the grindabilities of the chert and dolomite when milled separately.
