During the last few years, one of the great problems in the milling of all ores has been that of crushing. This subject involves not merely the cost of the operation, but also the selection of the proper degree and character of crushing to yield the best metallurgical results on the given ore. Considering the diversity of machinery, one is led to wonder at the variety of crushing methods employed, even when realizing that metallurgy demands varying products.
In an attempt to investigate the relative crushing resistances of a number of ores now being milled in this country and Alaska, the management of the Portland mills requested samples of average mill-run of ore
from various companies. The request met with a ready response, indicating the desire of all operators to gain information on the subject.
The difficulties involved in this investigation were numerous, lack of time for outside problems during this strenuous period being a serious one. Also, we were unable, in the time, to obtain a correct 150-mesh screen; in the screen analyses tabulated and plotted herewith, the 150- mesh screen was used merely to protect the 200-mesh screen, not to ascertain points on the curves.
The experimental crusher was a small iron tube-mill, 8 by 12½ in., in which was placed a definite number (74) and weight (3450 gm.) of ¾-in. steel balls, 1 lb. water and 1 lb. ore. To obtain uniform conditions, each ore was first crushed and screened, and from the sized products a “standard feed” was artificially prepared, the same standard being adopted for all tests in that particular series. The prepared feed was placed in the little mill, and this was allowed to revolve at 84 r.p.m. for a definite time; the sample was then dried and screened. The whole operation was then repeated for other periods of time.
The mass of data accumulated by these tests is only partially given below, as time at present will not permit a complete analysis. I realize that the method here adopted has its drawbacks, and vet, with all conditions identical, the screen tests of the products should at least give an indication of the relative crushing resistances of the ores. One objectionable feature is the small size of the crusher, although the labor in-
volved in drying, cutting down, and screening the product of a larger machine would be burdensome. The small size also necessitated a comparatively fine feed.
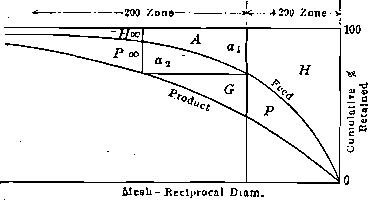
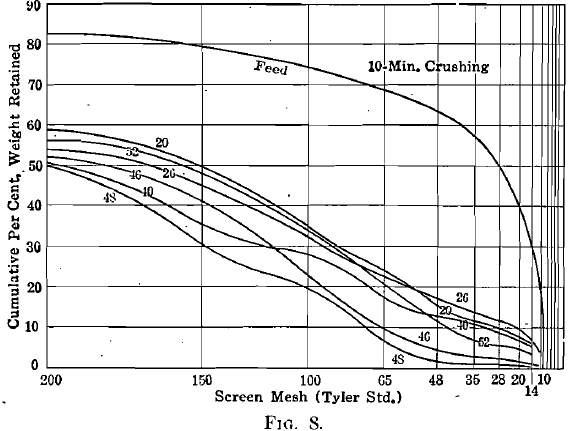
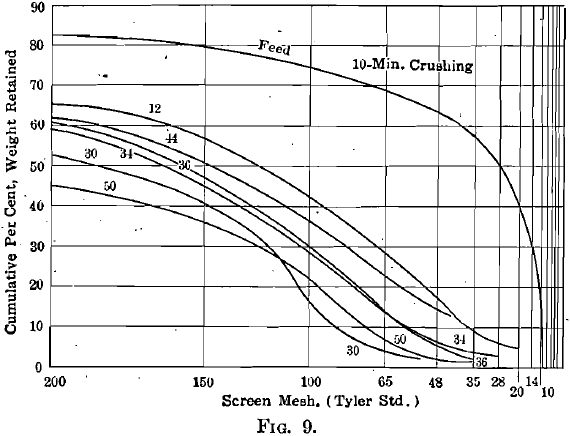
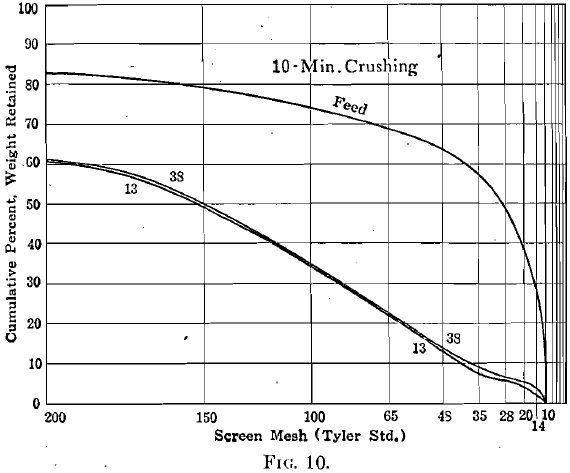
The method adopted for computing the results is that of Rittinger, based on the law that work done in crushing is proportional to the surface exposed by the operation, or to the reciprocal of the diameter. For plotting the screen tests, the mesh (reciprocal of diameter) and the cumulative per cent, of oversize are used as coordinates. The area between the feed and product curves will be proportional to the “apparent work” done. The apparent work is in turn inversely proportional to the resistance of the ore to crushing ; hence, the area between the curves is inversely proportional to crushing resistance. Unfortunately, we are unable to deal accurately with the material below 200 mesh, which is where most of the work done is represented. Microscopic measurements seem to offer the only accurate method. Curves plotted in the area below 200 mesh seem to follow no definite law, as that of a hyperbola. Many operators may feel but little interest in what happens after a certain fineness (say 48 mesh) is reached, but this does not alter the necessity of measuring the total work done on the whole of the ore.
As a method of measuring the work done in the region below 200 mesh, I offer the following suggestion, not asserting that it is accurate as to absolute results, but only that it yields additional evidence as to the relative crushing resistances of ores.
Mesh – Reciprocal Diam
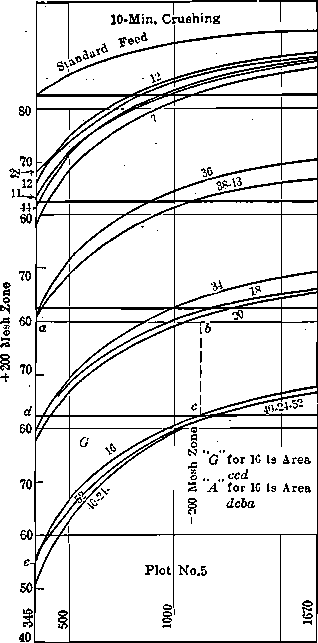
Fig. -5
Product work (Rittinger’s law) = H + P + G + a1 + a2 + H + P — (H + a1 + H) = P + G + a2 + P . (See diagram, p. 1255.) For a given ore, assume that the material in the feed (say 20 per cent.) below 200 mesh has the same value in mesh-tons as the finest 20 per cent, in the product, that is,
a1+ H = P + H, or a1 = P
Substituting this value for P, and calling (a1 + a2) = A,
Product work = P + G + A
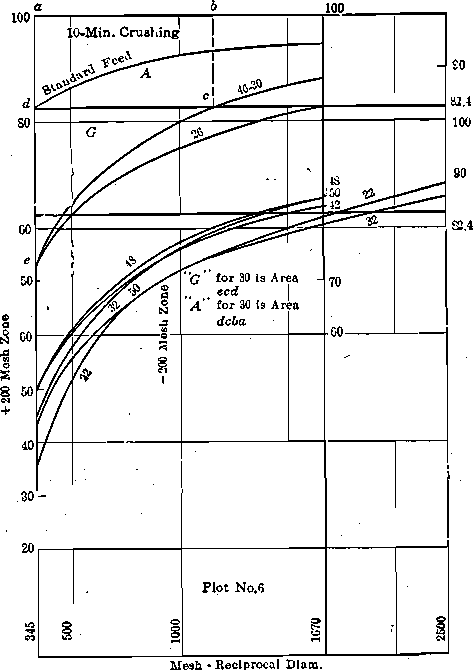
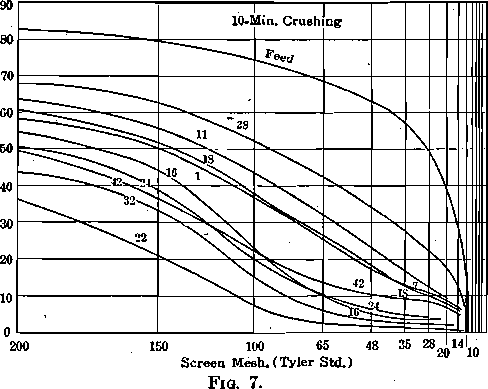
Table 1.—Screen Analysis of Product from 5-min. Crushing—Cumulative Per Cent. Retained on Screen.
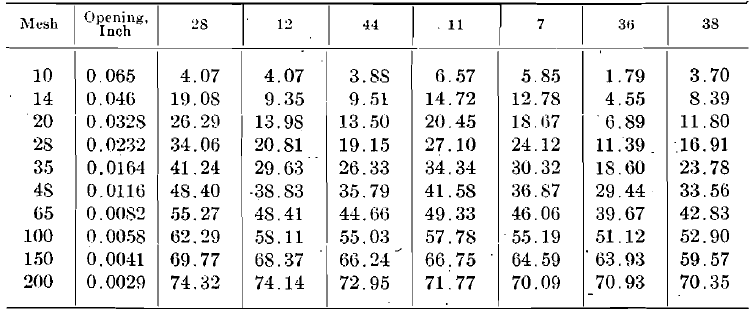
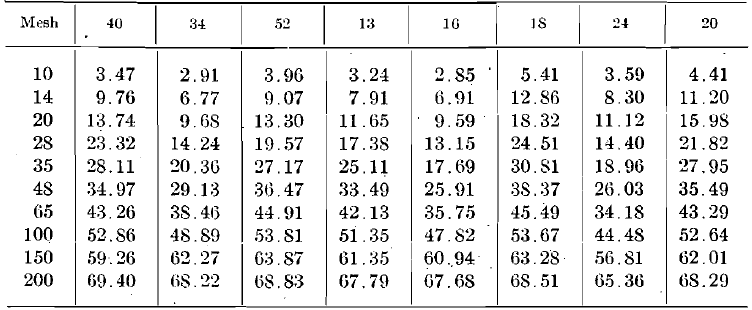
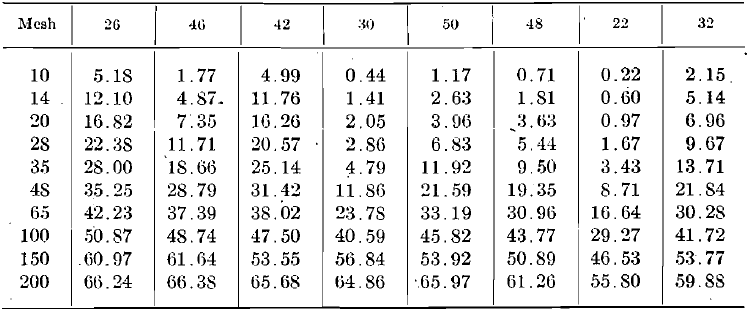
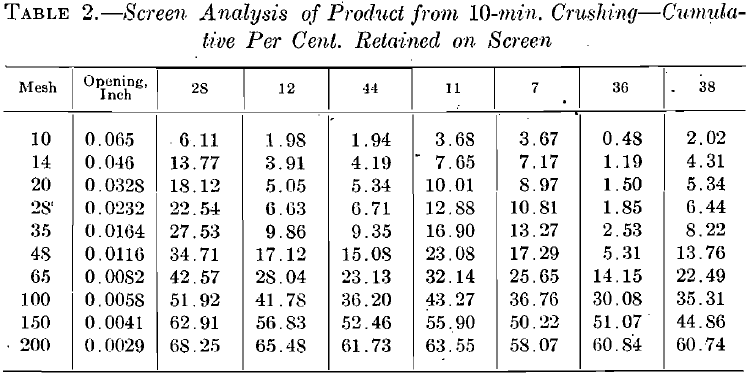
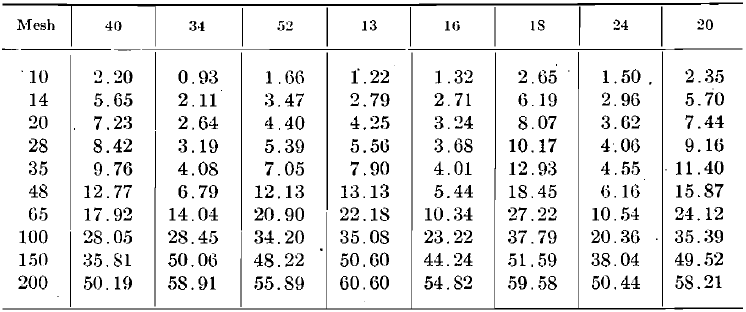
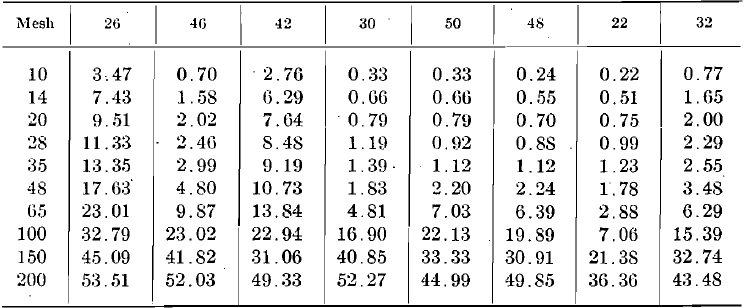
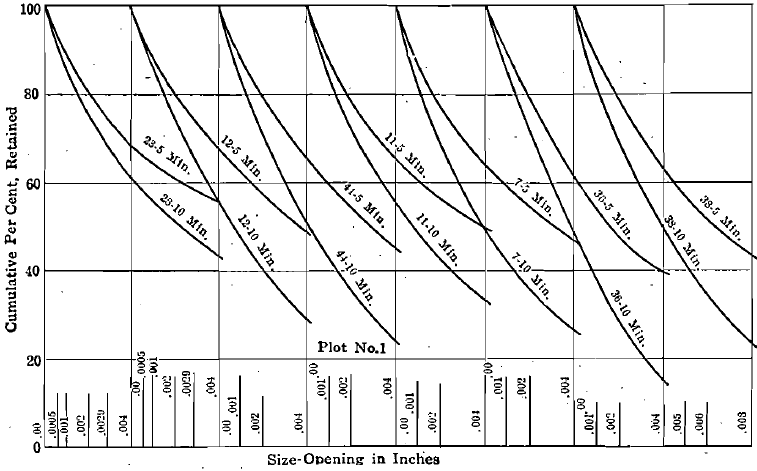
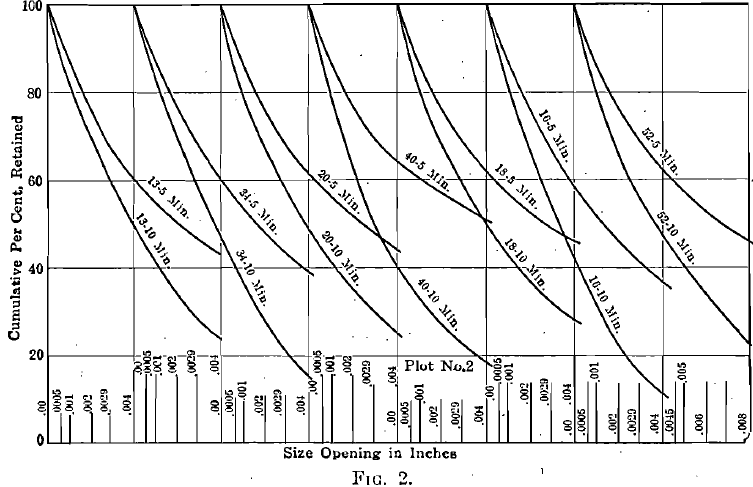
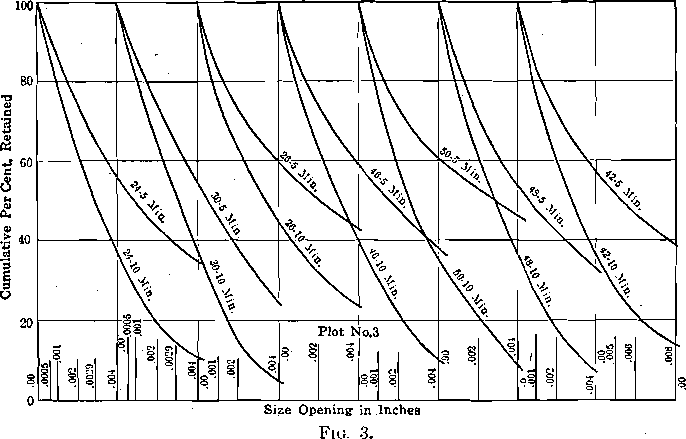
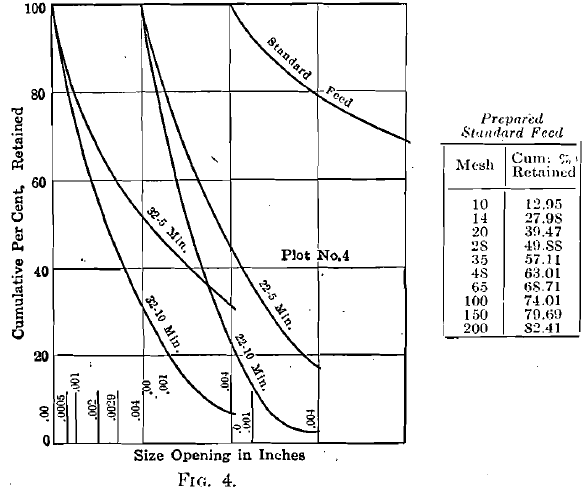
I have plotted the diameters and cumulative per cents as coordinates. The last definite point in diameter is 0.0029 in. (200 mesh); the curves must also pass through the point corresponding to 100 per cent, retained and zero diameter. The last three known points—0.0082 or 65 mesh; 0.0058 or 100 mesh; and 0.0029 or 200 mesh are shown
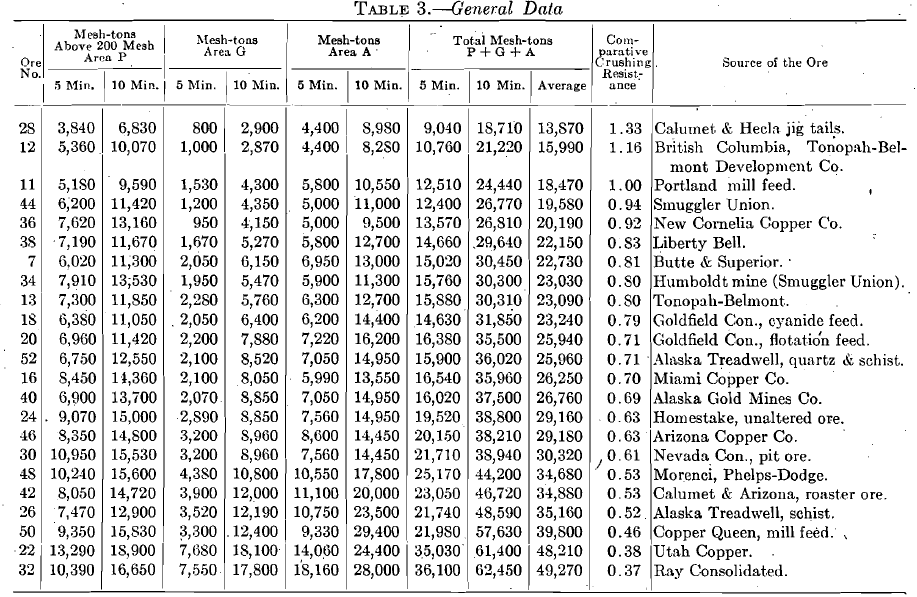
in plots No. 1, 2, 3, 4. The extension of the curves through the unknown area between 0.0029 in. and zero is made with reference to the known curve section. Subsequent investigation may require some of these curves to be slightly altered. The ratio between mesh-tons of the 5- min. and the 10-min. products does show a proportion fairly close to 1:2. From the curves thus drawn, I have taken points representing 0.0029 in. (345 reciprocal), 0.002 in. (500 reciprocal), 0.001 in. (1000 reciprocal), 0.0006 in. (1667 reciprocal), with their corresponding cumulative per cents, and have replotted these as No. 5 and 6 (only the curves for the 10-min. crushing being shown). From these curves, the so-called “product area” G+A, of material below 200 mesh, is
obtained; this, added to the product area P of material above 200 mesh, gives the total mesh-tons to be used for comparison with the mesh-tons of other ores. These totals are recorded in Table 3.
Screen analyses of the products after 5-min. and 10-min. crushing, starting with the standard feed of which the analysis can be observed in the diagrams, are given in Tables 1 and 2. As a matter of further interest, these analyses are plotted according to the Tyler direct cumulative diagram method in Fig. 7, 8, 9, 10.
Crushing Resistance of Various Ores BY LUTHER R’. LENNOS, E. M., VICTOR

