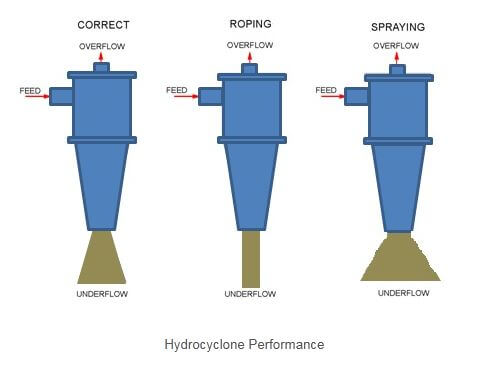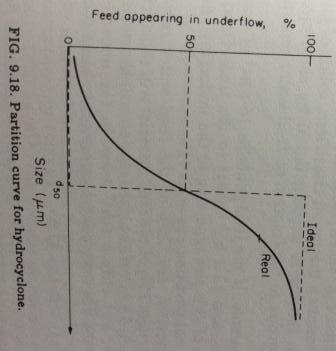
The Hydrocyclone Efficiency Curves are affected by many operating factors such as feed density, apex and vortex sizes and feed pump pressure. These factors will cause your cyclone classification to operate correctly, in roping or spraying mode. Everyone knows or has seen an “Ideal Cyclone Efficiency Curve” VS an actual real life hydrocyclone Efficiency Curves? I attach one here below (thanks to Wills). I found and interesting imagery and wanted to share it as it helps picturing the difference in what happens.
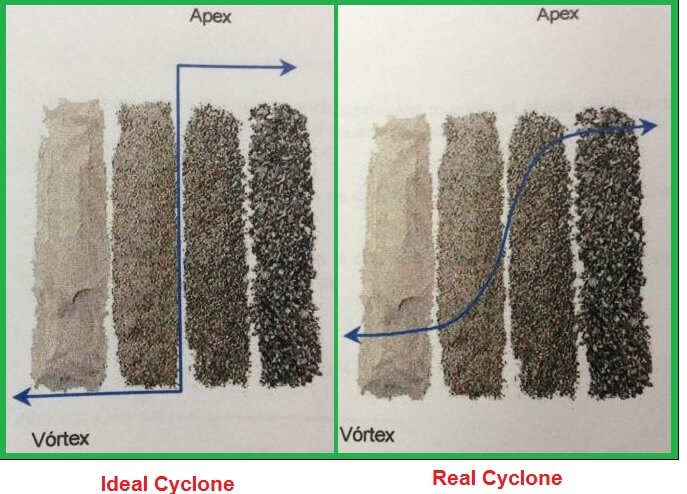
Below is an ideal cyclone on the left VS a real operating cyclone on the right. It graphical communicates how much of the underflow goes to the overflow and overflow to the underflow. Remember to give your operator this trick to obtain a quick P80 of their grind.
Also find a great paper on THE SIZING AND SELECTION OF HYDROCYCLONES and PERFORMANCE PREDICTIONSOF HYDROCYCLONE


