 Mineralogy is the driving force behind flotation performance. A flotation batch and rate test measures this as mass pull recovery and concentrate grade. The real data from a rate test can be processed to determine the flotation kinetics of metal, mineral and gangue.
 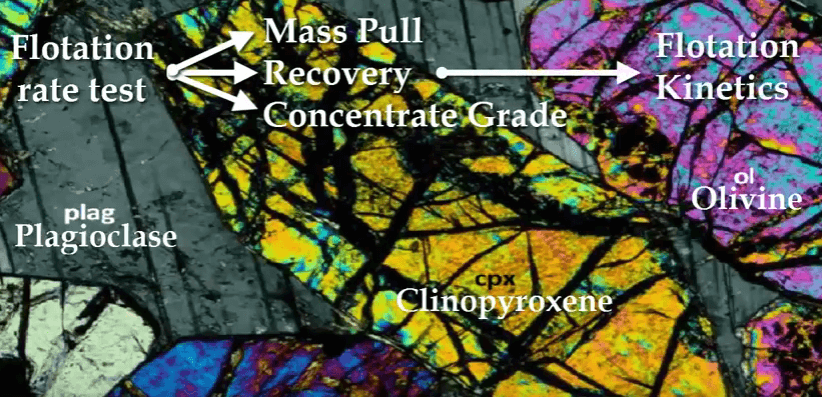 What we cover here is what are kinetics and what do they mean. Special attention is paid to the definition of floatable gangue. How flotation kinetics are used to understand and optimized flotation performance is covered in the next series. Two other articles describe how a rate test is conducted and what concentrate collection times should be used. A laboratory batch test or measurements done a bank of pilots or production scale plant cells generates a recovery grade and concentrate mass profiled with time.
 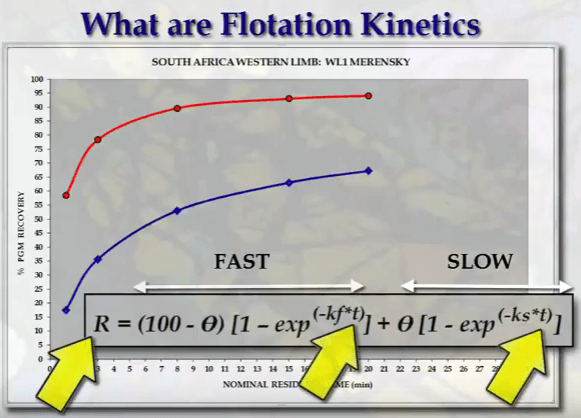 These profiles describe the flotation response and performance of the ore under whatever conditions are in effect at the time. In 1961 Kelsall developed a first order two component equation to fit these profiles. Flotation performance is described in terms of Fast and Slow components; each has a fraction and a rate.
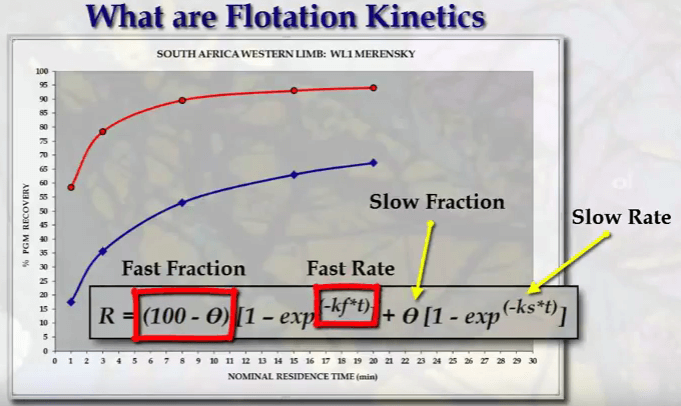
R. is the cumulative recovery at time T. Feta is a slow floating fraction and KS is a slow floating rate. Fast floating fraction is here with fast floating rate. Abbreviations used are I for fraction, K for rate and F and S for Fast and Slow. 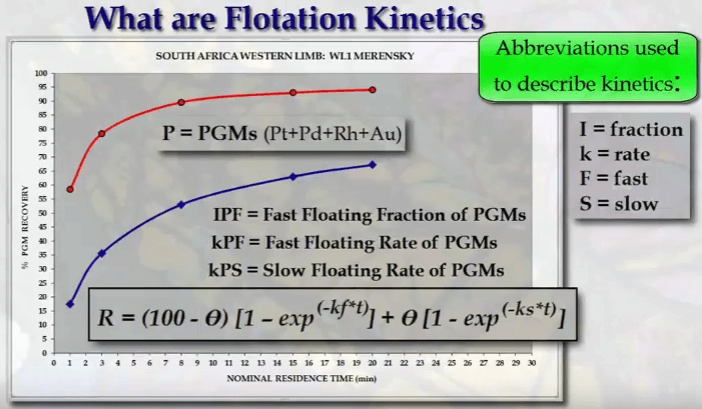 The example here is for platinum ore where P is the abbreviation use for platinum group metals. Since fast and slow fractions add up to 1 or 100%, it’s necessary only to quote the fast floating fraction. So the cumulative recovery time curve seen here is described by the 3 parameters shown; fast fraction, fast rate and slow rate.
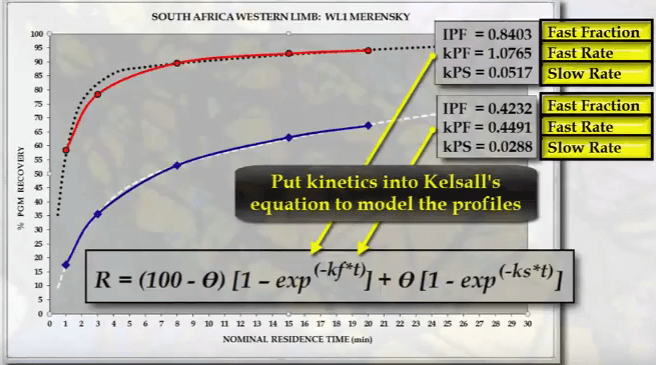
 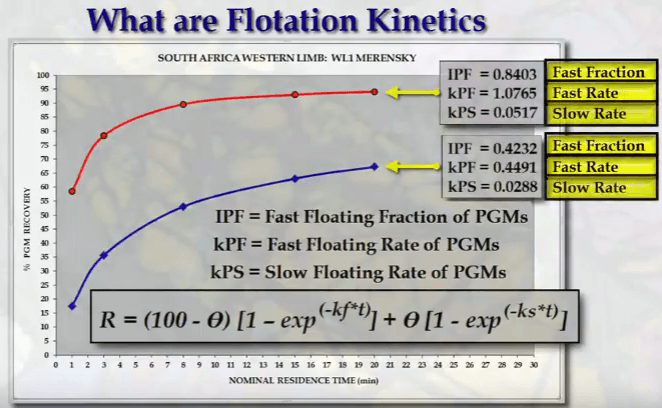 Put these values back into the Kelsall equation and the recovery time curves are modelled seen here as broken lines.
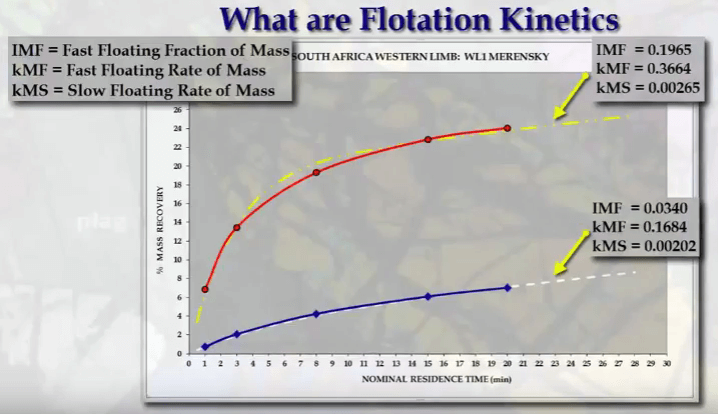
  This is also done for concentrate mass; a low and high mass pull example shows the difference in kinetic values on the right.
  The second set of modelled profiles after floatable gangue which has a similar set of kinetics to concentrate mass.
 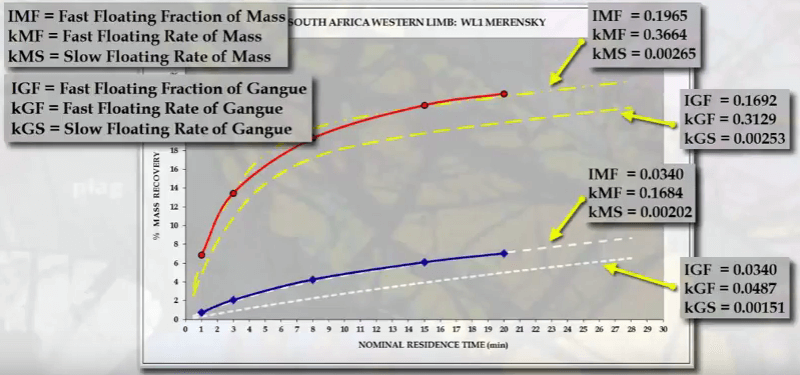 In Kelsall’s equation the fast component corresponds to the beginning of the float with the fast floating fraction being equivalent to recovery.
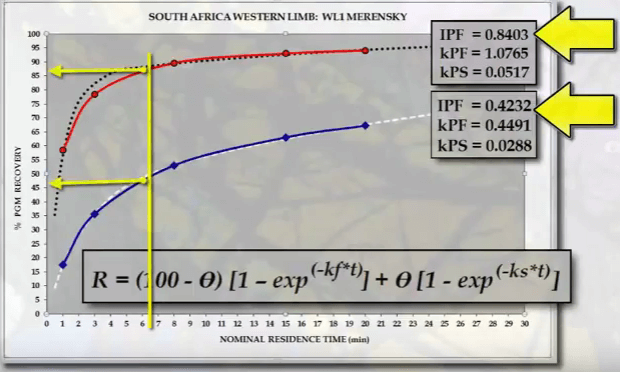
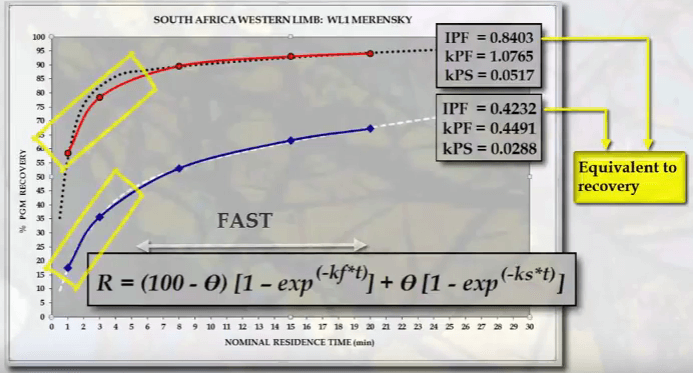 A line drawn at six point five minutes intersects the profiles at approximately the value of the fast floating fraction.
  The same occurs for the two PGM ores at four minutes.
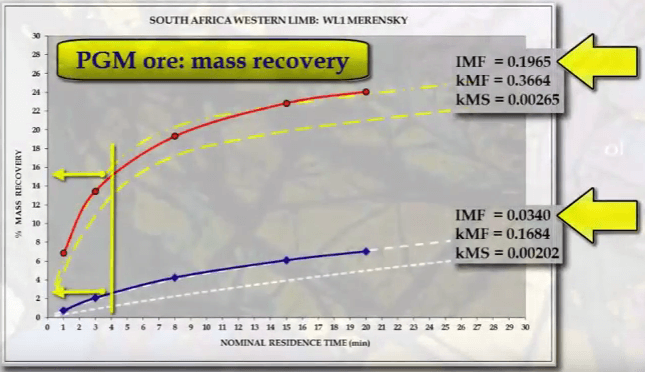
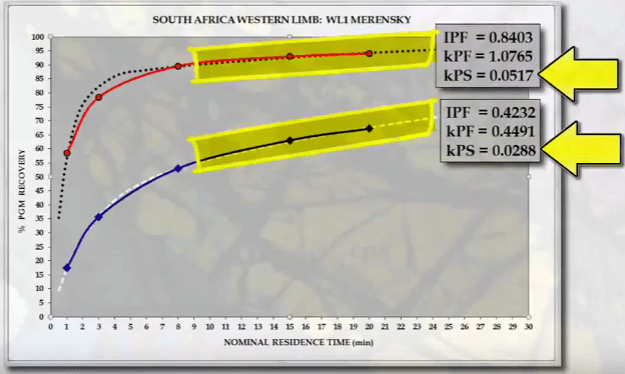
Fast rates are estimated from the initial slope of the profile and the values vary accordingly. The slow floating component corresponds to the end of the float where the profile plateaus out. 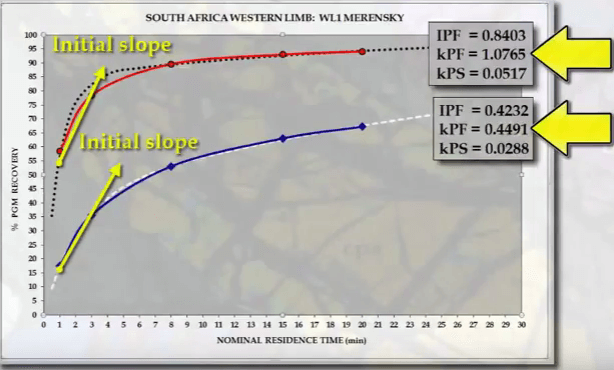 Slow floating rate is the slope of the profile here.
Combining the two sets of Kelsall equations for metal and mineral and gangue reproduces the recovery grade profile.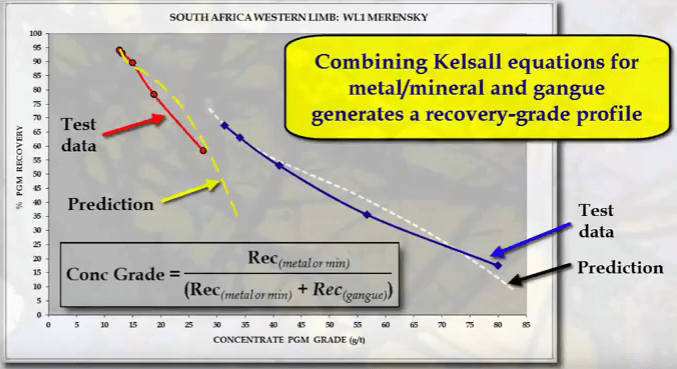 Floatable gangue is defined as non-valuable material recovered to concentrate and is the difference between total concentrate mass and the total mass of assayed elements and all metals. Typically floatable gang consists of common host rocks such as talc, pyroxene and any of the feldspars such as anorthite.
 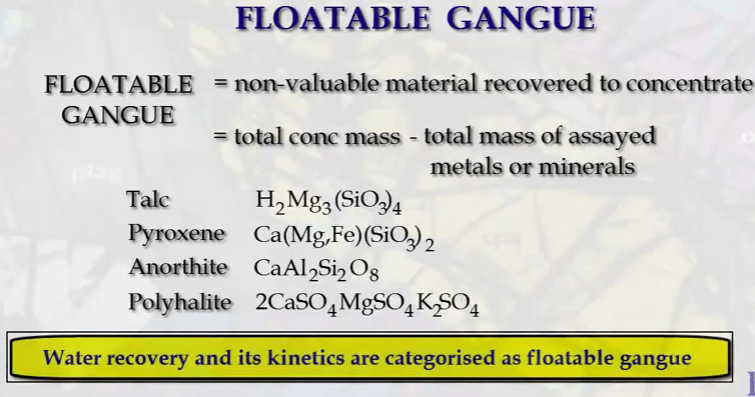 Sulphur is not usually contained in a typical gangue mineral but if it is which is quite rare, it is usually as a sulphate such as polyhalite. If water recovery is measured it is categorized as floatable gangue for the purposes of the kinetics estimation.
  Floatable gangue is therefore defined as those elements which have not been assayed.
In this example a nickel copper ore containing mainly pentlandite and chalcopyrite and smaller amounts of cobaltite, pyrite and pyrrhotite has been assayed for nickel, copper, cobalt, iron and sulphur, silica and MgO. The elements are divided into those present in the economic minerals and silica and MgO which are part of floatable gangue. 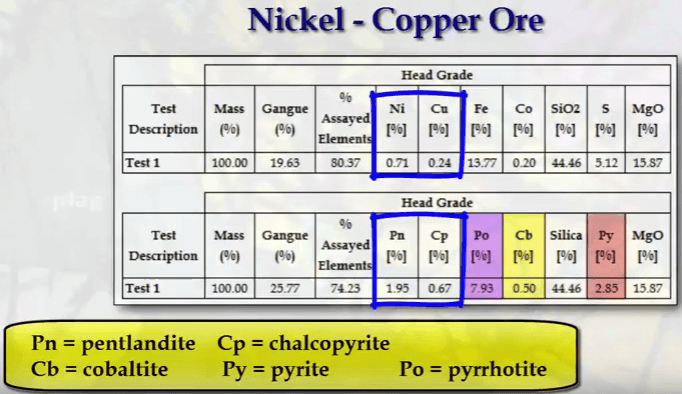 In the table, nickel and copper head grades are 0.71% and 0.24%. Converting assays into minerals, pentlandite and chalcopyrite head grades are 1.95% and 0.67% with 0.5% cobaltite, 7.93% pyrrhotite and 2.85% pyrite.
 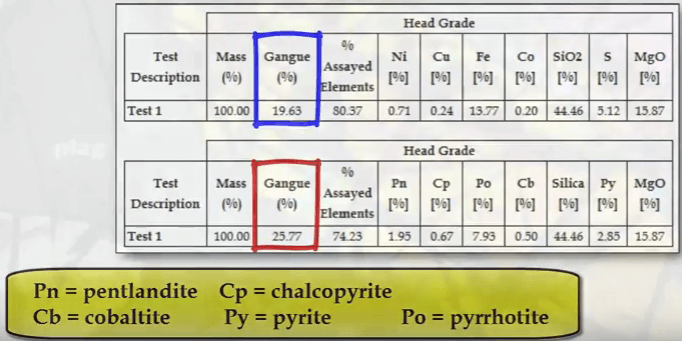 Floatable gangue consists of all other elements that have not been assayed and this amounts to 19.63% of the float feed. Alternatively, relative to mineral content together with SiO2 and MgO, gangue in float feed is 25.77%. The contents of gangue in float feed changes depending on analyte or minerals have been assayed or what is excluded as an assay and therefore designated as gangue.
 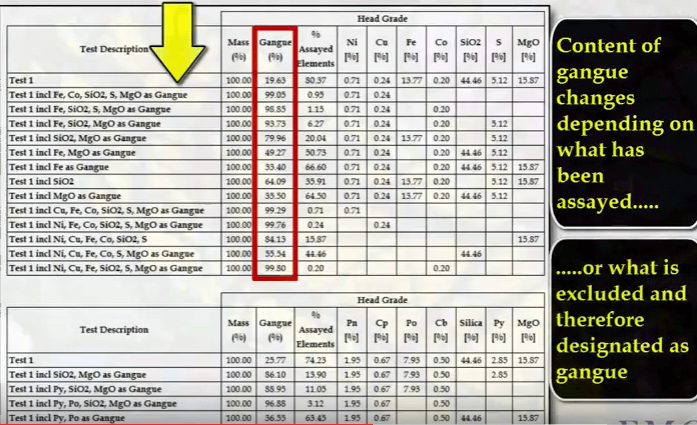 So if silica and MgO are excluded from the assayed data, then calculated per cent gangue will be increased.
  If everything is excluded apart from nickel and copper, gangue amounts to 99.05%.
  Similarly if everything apart from chalcopyrite, pentlandite and cobaltite is excluded, then gangue inflow feed is 96.88%.
  Each definition of floatable gang will change the kinetics of the gangue.
 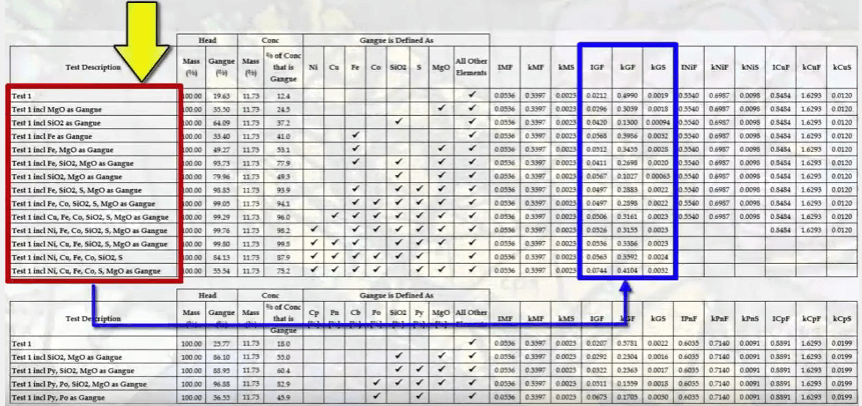 Concentrate mass pull is 11.73% and irrespective of what elements or minerals are excluded or included in the concentrate assays the kinetics of total concentrate mass stays the same.
 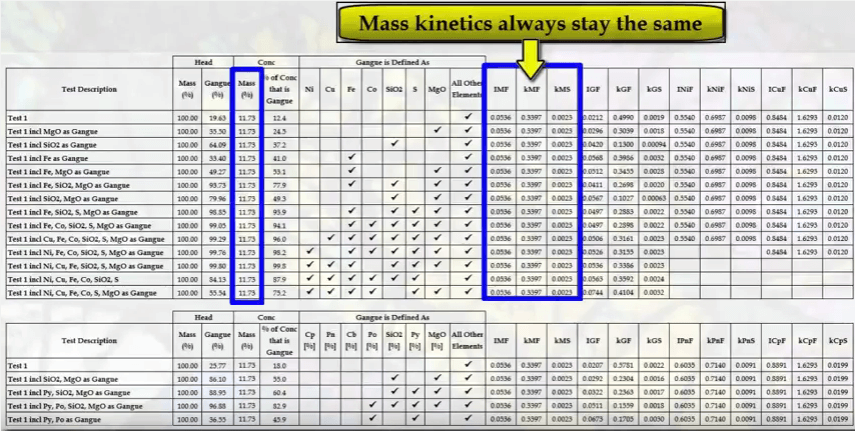 So to do nickel, copper, pentlandite and chalcopyrite. Gangue kinetics change depending on how floatable gangue is defined.
 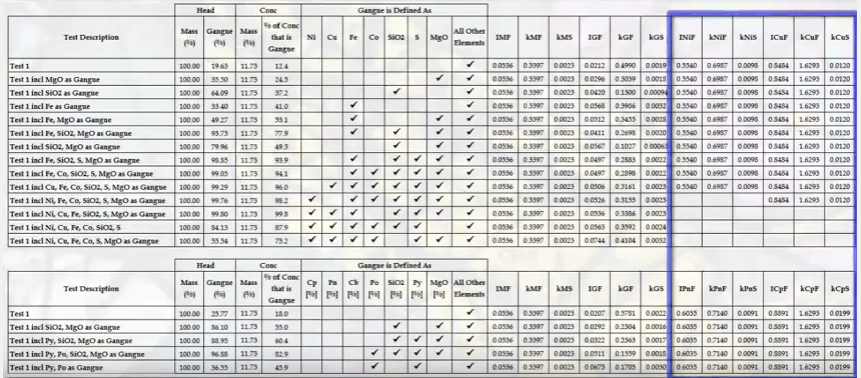 The relationship between gangue kinetics and how gangue has been defined is not a straight line. Here fast floating fraction of gangue IGF is plotted against gangue content in float feed.
The relationship is dependent on what proportion the analytes or mineral is of the total assays. Collectively Iron, silica and MgO make up 74.1% of float feed including these as assays i.e excluding them from being designated as floatable gangue; gives us this point with IGF of point zero two one two and nineteen point six three per cent gangue content. Excluding these as assays or designating them as floatable gangue brings us here; to IGF of 0.41% and 93.71% gangue content. 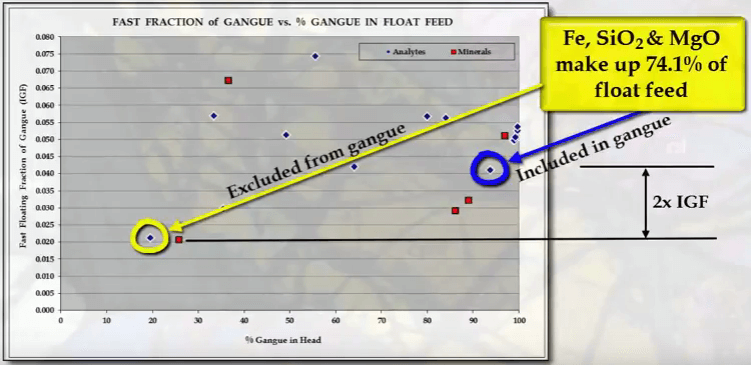 If everything apart from nickel and copper is designated as gangue, then IGF is point 0.497 and 99.05% gangue in feed. The same is seen for a plot of gangue floatability against per cent gangue inflow feed.
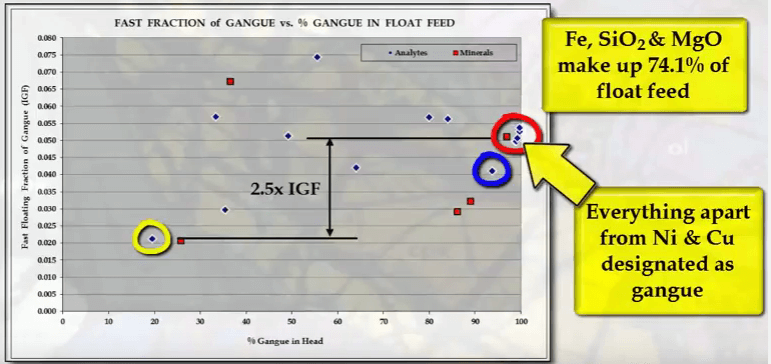
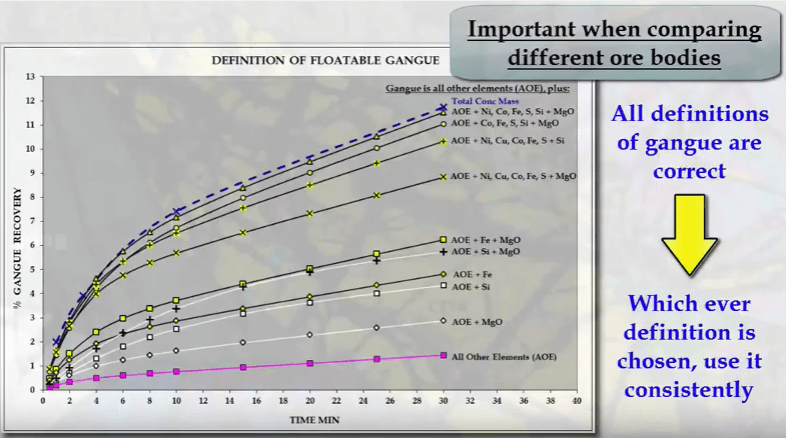
With gangue being everything not assayed, floatability is point zero three nine. With only nickel and copper assayed gangue floatability is almost three times greater at point one one one. 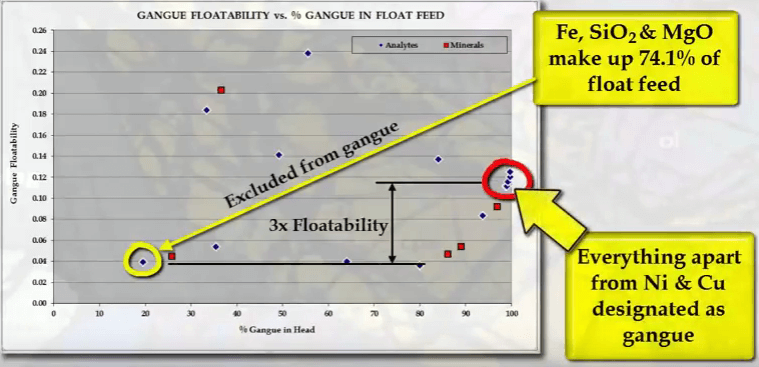 The recovery time profiles of these various going definitions is shown here. Total mass pull profile sits at the top. If everything apart from copper is designated as floatable gangue, then the profile is very close to total mass pull.
 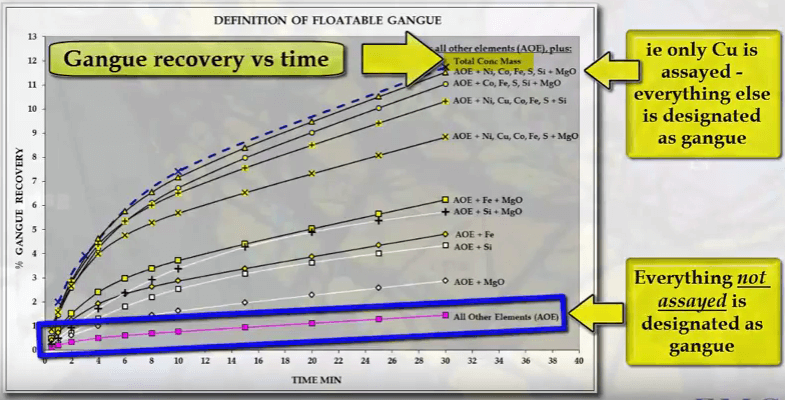 At the other end of the scale, if floatable gangue excludes all assayed analytes then the gangue recovery profile sits down here. All these definitions of floatable gang are correct; it does not matter which definition or view is taken as long as it is consistently used. Thus if you assay for only nickel and copper, then stick to this for ore tests because you will be defining floatable gangue in a certain way and all tests can then be compared on an equal basis. This is particularly important if you are comparing floatable gangue kinetics for different ore bodies in various locations. If in doubt, compare mass rather than floatable gangue kinetics.