OBJECTIVE: Evaluation of Westates Metasorb 321G (6×12) virgin activated carbon as compared to medium activity carbon from alternate vendors.
PROJECT SCOPE:
The following variables will be evaluated:
- Apparent density.
- Initial moisture content.
- Fine carbon losses following pre-soak.
- Particle size distribution of pre/post attrited carbon.
- Attritioning rates and losses with/without silica media.
- 24 hour adsorption rate and activity.
- Optimum economics in conjunction with product superiority.
INTRODUCTION:
Westates, the current carbon vendor to the Chimney Creek plant, has been a supplier since the inception of mill start-up. Historically, ending fiscal ’92, an increase by 72% in attritioning rates was in evidence as compared to fiscal ’90 (Tables 1 through 4). Proportionately, attrition losses created a 93% dollar increase from $53,070 in ’90 to $102,400 in ’92. Due to the increase in magnitude of dump leach solutions, stripping, reactivation and acid wash frequencies together with carbon inventory over the past three years, a significant fraction of the elevated attritioning losses may be attributable to the same.
Insofar as present practice is concerned, the primary objective of the proposed evaluation is to compare carbon from other vendors against Westates, and determine their viability with respect to attritioning and economics. The program is directed towards medium activity carbon, as the characteristics of the Chimney Creek plant design obviate utilization of high activity carbon. The potential for increased attrition losses with higher activity carbon is an additional factor towards the decision to test medium activity carbon.
Vendor carbons to be investigated include SorbTechs DG-11, GD Resources LT-45, Carbon Links LK-50 and Calgons GRC-14.
SYNOPSIS:
The most recent plant carbon evaluation was conducted approximately 1.5 years ago. Subsequently, carbon attrition losses have increased steadily creating a significant quantity of fines in the circuit. Refer to earlier memo (Dec 11) for details and a cost breakdown.
The current project will focus principally on the attritioning aspects of Westates 321G carbon as compared to medium activity carbons from four other vendors. Additionally, activity and loading rates will be investigated briefly.
The program is anticipated to commence during the first week of January with an estimated completion time of 6 weeks. Project methodology details follow.
PROCEDURE & METHODOLOGY FOR ACTIVATED CARBON TESTING PROGRAM
Phase 1:
1. Sampling & Apparent Density
A. Obtain approximately 3 pounds (1361 gm) of Westates 321G fresh activated carbon from an unopened bag. Use tube sampler for procuring representative sample.
B. Carefully split entire amount of Westates and other vendor carbon samples to 650 gm, using the micro-splitter.
C. Split 650 gm samples to 300 gm, and store remaining portion of split in labeled pulp envelope.
D. Split the 300 gm sample once and make certain each split fraction contains 150 gm of sample. Bag and label accordingly. The entire program will require duplication of all tests.
E. Place a metal funnel on the mouth of a 500 ml graduated glass cylinder.
F. Introduce exactly 150 gm of carbon sample into the funnel, by means of a scoop, making certain that the carbon is distributed evenly along the sides of the cylinder. Gently tap cylinder to obtain a level bed.
G. Record volume of carbon in cylinder to the nearest 5 ml subdivision (x).
H. Duplicate test with the other 150 gm split and save samples for next phase of program.
CALCULATIONS:
Carbon Apparent Density (gpl) = 150000/Volume of carbon (x)
Phase 2:
2. Initial Moisture content
A. Use ~150 gm of sample, in duplicate, from the preceding test.
B. Tare a 6″x 4″ metal pan and record weight (x). Introduce the sample into the container and record gross weight (y).
C. Place pan in a drying oven at 45 Celsius (113F) and dry for 24 hours. Test for moisture with a watch glass.
D. Cool sample to room temperature and record gross weight (z). Save samples for next phase of program.
CALCULATIONS:
Pre-attrited fine carbon loss (%) = [(x – y)/x] * 100
Phase 3:
3. Fine carbon losses following pre-attrition soak
A. Use ~150 gm of sample, in duplicate, from the preceding test.
B. After recording actual weight (x), transfer sample into a 600-ml beaker containing 500 gm DI water. Cover container with a watchglass and allow soaking for 24 hours.
C. Screen sample over a 20-mesh screen, rinsing thoroughly with DI water.
D. Transfer wet sample into a 6″ x 4″ metal pan and dry at 45 Celsius (113F) for 24 hours. Test for moisture with a watch glass.
E. Record dry weight of sample (y) and save sample for succeeding test.
CALCULATIONS:
Pre-attrited fine carbon loss (%) = [(x – y)/x] * 100
Phase 4:
4. Pre-attrition size distribution analysis
A. Procure the following clean and dry sieves:
Tyler series:- 6, 8, 10, 14 and 20 mesh.
B. Use ~150 gm of sample, in duplicate, from the preceding test. Split each sample once to ~75 gm. Bag and label one-half of the split for Phase 5 of the program.
C. After recording actual weight (x), introduce sample onto the bank of sieves and dry screen (roto-tap) for 10 minutes.
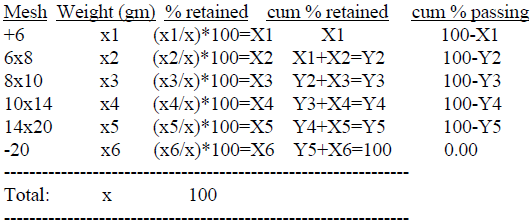
D. Record carbon weights on individual screens including the -20 mesh material (x1, x2, x3, x4, x5 & x6). Discard carbons.
CALCULATIONS:

Phase 5:
Attritioning analysis – DI water media
A. Use saved carbon splits, in duplicate, from step B of Phase 4.
B. Split each sample once to 37 gm. Bag and label one-half of the split for phase 7 of the program.
C. After recording actual weight (x) of pre-soaked dry carbon, transfer into a clean and dry 2-liter beaker. A Rainin electronic agitator fitted with an impeller completes the assembly. Add 400 gm DI water and begin agitation, at a speed which fluidizes the carbon slurry without undue turbulence, for predetermined times.
D. After 1 hour, wash carbon solution thoroughly over a 20-mesh screen and collect -20 mesh material. Perform solid-liquid separation using the Gelman micro-filter on the -20 mesh fines. Dry fines at 45 Celsius (113F) for 24 hours and record dry weight (x1).
E. Return wet +20 mesh material to the assembly and make-up volume with 400 gm DI water. Roll for 2 hours.
F. Perform identical procedure as outlined in step D (Fines = x2).
G. Return wet +20 mesh material to the assembly and make-up volume with 400 gm DI water. Roll for 3 hours.
H. Perform identical procedure as outlined in step D (Fines = x3).
I. Return wet +20 mesh material to the assembly and make-up volume with 400 gm DI water. Roll for 18 hours.
J. Perform identical procedure as outlined in step D (Fines = x4). In addition, dry the +20 mesh material at 45 Celsius (113F) for 24 hours and record dry weight (y).
K. Save +20 mesh material for phase 6 of the program; discard all fines (-20 mesh) after obtaining dry weights.
CALCULATIONS:
Cumulative wt loss % = [(x1 +x2+ x3 +x4)/x]*100
Calculated weight loss (y-x) = x1 +x2 +x3 +x4
To obtain the constant attrition rate, it will be necessary to perform a regression analysis with time vs weight loss. The ‘x’ coefficient or slope denotes the constant attrition rate in gm/hour.
To obtain the constant attrition rate in lbs/ton carbon/day, the following computations apply:
Assume constant attrition rate = z gm/hour
Then in lbs/ton carbon/day = (z * 24 * 2000)/x
Phase 6:
Particle size distribution of post attrited carbon in DI water media
A. Use +20 mesh material from Phase 5, step K of the program.
B. Procure the following clean and dry sieves:
Tyler series:- 6, 8, 10, 14 and 20 mesh.
C. After recording actual weight (x), introduce sample onto the bank of sieves and dry screen (roto-tap) for 10 minutes.
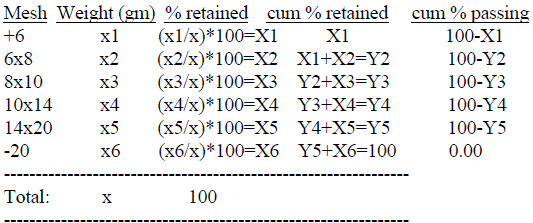
D. Record carbon weights on individual screens including the -20 mesh material (x1, x2, x3, x4, x5 & x6). Discard carbons.
CALCULATIONS:

Phase 7:
Attritioning analysis – Silica/water media
A. Use saved carbon splits, in duplicate, from step B of Phase 5.
B. After recording actual weight (x) of pre-soaked dry carbon, transfer into a clean and dry 2-liter beaker. A Rainin electronic agitator fitted with an impeller completes the assembly. Add 400 gm DI water and begin agitation, at a speed which fluidizes the carbon slurry without undue turbulence, for predetermined times.
C. After 1 hour, wash carbon solution thoroughly over a 20-mesh screen and collect -20 mesh material. Perform solid-liquid separation using the Gelman micro-filter on the -20 mesh fines. Dry fines at 45 Celsius (113F) for 24 hours and record dry weight (x1).
D. Return wet +20 mesh material to the assembly, add 160 gm silica sand and make-up volume with 400 gm DI water. Roll for 2 hours.
E. Perform identical procedure as outlined in step D (Fines = x2).
F. Return wet +20 mesh material to the assembly, add 160 gm silica sand and make-up volume with 400 gm DI water. Roll for 3 hours.
G. Perform identical procedure as outlined in step D (Fines = x3).
H. Return wet +20 mesh material to the assembly, add 160 gm silica sand and make-up volume with 400 gm DI water. Roll for 18 hours.
I. Perform identical procedure as outlined in step D (Fines = x4). In addition, dry the +20 mesh material at 45 Celsius (113F) for 24 hours and record dry weight (y).
J. Save +20 mesh material for phase 8 of the program; discard all fines (-20 mesh) after obtaining dry weights.
CALCULATIONS:
Cumulative wt loss % = [(x1 +x2+ x3 +x4)/x]*100
Calculated weight loss (y-x) = x1 +x2 +x3 +x4
To obtain the constant attrition rate, it will be necessary to perform a regression analysis with time vs weight loss. The ‘x’ coefficient or slope denotes the constant attrition rate in gm/hour.
To obtain the constant attrition rate in lbs/ton carbon/day, the following computations apply:
Assume constant attrition rate = z gm/hour
Then in lbs/ton carbon/day = (z * 24 * 2000)/x
Phase 8:
Particle size distribution of post attrited carbon in Silica/D.I. water media
A. Use +20 mesh material from Phase 7, step K of the program.
B. Procure the following clean and dry sieves:
Tyler series:- 6, 8, 10, 14 and 20 mesh.
C. After recording actual weight (x), introduce sample onto the bank of sieves and dry screen (roto-tap) for 10 minutes.
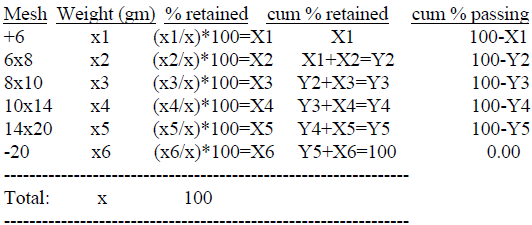
D. Record carbon weights on individual screens including the -20 mesh material (x1, x2, x3, x4, x5 & x6). Save 8×10 material for phase 9 of the program, and discard rest of the carbons.
CALCULATIONS:

Phase 9:
Adsorption rate and activity
A. Weigh exactly 2 gm of carbon (8×10) from step D phase 8. If necessary, split carbon in 8×10 fraction down to ~2 gm.
B. Prepare 1000 ml of a 20 ppm gold and silver solution in a cyanide matrix, in duplicate.
Preparation of 20 ppm Au/Ag standard:
a. Half fill a 1000-ml volumetric flask with DI water. Add 0.1 gm of solid NaOH and mix. Add
0.15 gm of solid NaCN and mix thoroughly.
b. Use 1000-ppm gold and silver standard in 0.3% cyanide matrix. Accurately pipette 20 ml of each standard into the 1000 ml volumetric flask, swirl and make up to volume.
C. Pipette 5 ml of the 20 ppm Au/Ag standard into a centrifuge tube, label accordingly and submit for an A.A. Au/Ag analysis.
D. Transfer 995 ml Au/Ag standard into a clean and dry 1 gallon plastic bottle with a vented stopper.
E. At time 0 min add 2 gm of carbon, from step A, into the plastic bottle, cap, set on roller unit and start rolls (40 rpm).
F. At time 15 min stop rolls and pipette 5 ml of the solution into a labeled centrifuge tube, and submit for an A.A. Au/Ag analysis. Caution: Avoid aspirating fine carbon into the pipette. Set bottle on rolls and commence rolling.
G. Repeat step F for 0.5, 0.75, 1, 1.5, 2.0, 3.0, 6.0, 18.0 and 24 hours.
H. After 24 hours, perform solid-liquid separation using the Gelman micro-filter. Discard solution. Wash carbon on the filter copiously with DI water. Dry carbon at 45 Celsius (113F) for 24 hours and record dry weight (x). Submit sample for a Au/Ag fire-assay.
CALCULATIONS:
To determine carbon activity levels, a regression analysis will be required for time (up-to 1 hour) vs solution gold concentration [(1/Au)*1000]. Slopes generated will be ratioed against Westates rate.
To estimate calculated loading, a linear regression analysis from 0 to 24 hours with decreasing solution gold values, would provide the rate of reaction. Unit conversion of the rate to oz Au/ton carbon/minute would be required.
A carbon/solution gold mass balance must be provided as a check against analytical accuracy.
MODIFICATION OF PHASE 7 METHODOLOGY:
– Procure approximately 12 lbs of dry silica sand from the assay lab.
– Carefully hand screen through a 25 mesh sieve. Discard +25 mesh material.
– Step 7B: After adding carbon into attritioning pot, add 1000 gm DI water followed by 400 gm of – 25 mesh silica sand. Begin agitation for 6 hours.
– Step 7C: After 6 hours, thoroughly wash carbon/silica slurry through a 20-mesh screen. Discard – 20 mesh material. Dry +20 mesh carbon for 24 hours at 47C, and log dry weight.
– Step 7D: Return dry +20 mesh carbon into attritioning pot followed by 1000 gm DI water and 400 gm -25 mesh silica sand and begin agitation for 18 hours.
-Step 7E: After 18 hours, thoroughly wash carbon/silica slurry through a 20-mesh screen. Discard – 20 mesh material. Dry +20 mesh carbon for 24 hours at 47C, and log dry weight.
-Step 7F: Save +20 mesh material for phase 8 of the program.
1.0 CONCLUSIONS & RECOMMENDATIONS:
1.1 Based on the carbon quality ‘rating’ chart (Table 1, Appendix A), which accounts for overall metallurgical properties as determined in the laboratory, the preferential order of activated carbon type is as follows:
- Norit, RO 3515, 1.26 $/lb (incl tax & freight)
- Sorb-Tech, DG 11, 0.78 $/lb (incl tax & freight)
- Carbon Link, LK 50, 0.74 $/lb (incl tax & freight)
- Calgon, GRC 20, 0.89 $/lb (incl tax & freight)
- Westates, 321G, 0.82 $/lb (incl tax & freight)
- GD Resources, LT 50, 0.83 $/lb (incl tax & freight)
1.2 Carbons recommended for the Chimney Creek plant include Sorb-Tech (DG 11 – 6×12) and Carbon Link (LK 50 – 6×12), since they exhibit the desired attributes and are cost effective.
1.3 Norit RO3515 is also recommended for application at the CC plant. However, due to the relative infancy of this product in the U.S. gold mining market together with the price and its extruded form, gold plants utilizing the carbon will be contacted for details concerning its operational viability.
Additionally, tests will be conducted to ascertain its flow characteristics. The program would simulate the CIC circuit and determine the maximum solution throughput possible, in comparison to other vendor carbons.
1.4 Based solely on attrition rates, yearly cost savings of $34,000 may be realized by utilizing Carbon Link’s product. Predicted yearly savings utilizing carbon from Sorb-Tech and Norit are $19,000 and $16,600 respectively. Table 2 highlights potential cost reductions for the carbons investigated.
1.5 The calculated yearly savings for each carbon type does not take into account the operational variability associated with an increase in carbon activity. Potential advantages may include an increase in CIC stage efficiency, reduced stripping of carbon fines, lower carbon maintenance (acid wash and reactivation), increased gold loading and a decrease in carbon inventory.
INTRODUCTION:
2.1 Westates, the current carbon vendor to the Chimney Creek plant, has been a supplier since mill start-up. Historically, ending fiscal ’92, a 72% increase in attrition rates was in evidence as compared to fiscal ‘90 (Tables 3 through 6; Figure 1-Appendix B). Proportionately, attrition losses created a 93% dollar increase from $53,070 in ’90 to $102,400 in ’92. Due to the increase in magnitude of dump leach solutions, stripping, reactivation and acid wash frequencies together with carbon inventory and screen changes over the past three years, a significant fraction of the elevated attrition losses may be attributable to the same.
The primary objective of the evaluation was to compare carbon from other vendors against Westates, and determine their viability with respect to attrition and economics. The program was directed towards medium activity carbon, as the characteristics of the Chimney Creek plant design obviate utilization of high activity carbon. The potential for increased attrition losses with higher activity carbon is an additional factor towards the decision to test medium activity carbon. Nevertheless, a high activity carbon from Norit was included in the investigation for reference purposes.
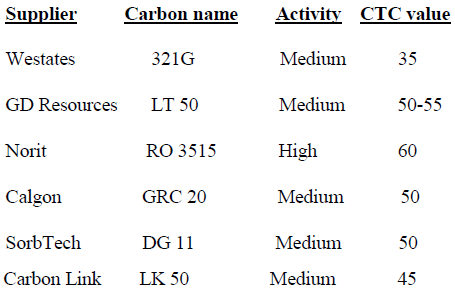
2.2 The following carbon samples from six vendors, including Westates, were evaluated:

2.3 The program investigated the following characteristics of each carbon:
- Apparent density.
- Initial moisture content.
- Fine carbon losses following pre-soak.
- Particle size distribution of pre/post attrited carbon.
- Attrition rates and losses in DI, with/with-out silica media.
- 6 and 24 hour adsorption rate and carbon activity.
- Au/Ag/Hg extraction in a high clay/Hg slurry media.
- Optimum economics in conjunction with product superiority.
3.0 DISCUSSION OF RESULTS:
3.1 It must be noted that test results are based on relatively small samples provided by the carbon vendor. Consequently, the results do not quantify bulk amounts of carbon. Operationally, minor deviations from experimental predictions may be expected.
Additionally, all tests were run at least in duplicate and data reported are averages.
3.2 Carbon link and Calgon displayed the highest and lowest apparent densities respectively. Moisture content on as received carbon was greatest with Westates and lowest with Norit. Westates and Norit showed maximum and minimum fine carbon losses following a pre-attrition soak, respectively. Table 7 (Appendix A) and Figures 2 through 4 (Appendix B) summarize the data.
3.3 Particle size distribution of carbon following a pre-attrition soak showed that GD Resources had a maximum of 1.03% ‘fines’ passing 14 mesh Tyler (16 mesh U.S.). Norit was lowest at 0.13% passing 14 mesh.
A 24-hour post-attrition in DI water indicated that GD Resources had a maximum of 1.26% ‘fines’ passing 14 mesh. Calgon was lowest at 0.13% passing 14 mesh.
A 24-hour post-attrition in D.I./Silica sand media demonstrated that GD Resources had a maximum of 1.87% ‘fines’ passing 14 mesh. Sorb-Tech was lowest at 0.16% passing 14 mesh.
Tables 8 & 9 and Figures 5 through 10 depict the information.
3.4 Post-attrition in DI water for 24 hours suggested that Calgon and Westates had the highest attrition rates at 74 pounds per ton carbon per day. Norit was lowest at 40-pounds/ton carbon/day.
Post-attrition in D.I./Silica sand media showed that Calgon had the highest attrition rate at 129- pounds/ton carbon/day. Norit was lowest at 74-pounds/ton carbon/day.
Table 10 and Figure 11 show the carbon weight loss, attrition values and ratios relative to Westates, in DI water and D.I./silica sand media.
Experimental attrition rates were significantly higher than those experienced under plant conditions due to the rigorous nature of the test procedure and equipment utilized. However, the results of each individual carbon is compared relative to Westates, under identical test conditions, and therefore provides an attrition potential comparison for each carbon type.
3.5 Norit and Westates indicated the highest and lowest activities respectively. Compared to Westates, activities of all evaluated carbons were greater by an average factor of 4. Figures 12 and 13 depict vendor carbon activity relative to Westates.
3.6 Within a 6 hour interval, Westates showed the lowest gold loading rate profile. The load rate tests additionally indicated that all compared carbons loaded the same quantity of gold in 6 hours as Westates accomplished in 24 hours. Final gold loading on carbon and tail solution gold values, after 24 hours, were essentially similar for all compared carbons. Note that Westates exhibited the lowest final loading and highest tail solution gold value. Table 11 and Figures 14 and 15, portray solution assays, activity and loading rate ratios and gold loading rate profiles.
3.7 Westates portrayed the lowest silver loading rate on carbon for both a 6 hour and 24 hour period. Norit had the highest silver loading rate at both time intervals. Figure 16 depicts the silver loading rate for both time periods.
3.8 A comparative test was run to investigate the effects of gold and silver loading on carbon, in the presence of a high clay gold ore spiked with liberal quantities of mercury. Metal recovery on carbon, after 24 hours, was essentially similar for all evaluated carbons. The tests conducted with Norit and Sorb-Tech carbons did indicate lower gold values in tail solids; however, over-emphasis on data credibility should be avoided due to analytical/assay accuracy constraints at low metal values. Table 12 and Figures 17 and 18 summarize the information.
4.0 EXPERIMENTAL PROCEDURES
Appendix C presents the test methodology in detail.
5. ACKNOWLEDGEMENTS
Credit and appreciation is due to Mike Willey -Metallurgical Technician I- for his application and consistency in performing the experiments.
