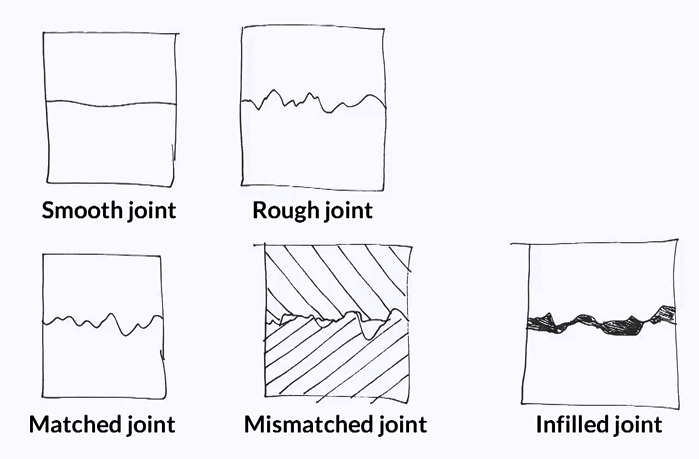
In this topic, we will present two important aspects of discontinuities, namely the roughness and shear strength. These two properties are critical when it comes to the stability of a rock mass in which these discontinuities are present and like for the intact rock, the mechanics of a rock joint is that of a contact between two rock walls. As we can see on this figure, these walls can contain more or less asperities and hence, be more or less rough. They can be perfectly matched or mismatched. They can be unfilled, partially or fully filled. Filling can occur as a result of a chemical process such as precipitation by withering of the walls, or simply by deposition of the soil.
Roughness is an important parameter of the rock joint. Let’s see how with these specimens. We here have a specimen which is rather smooth and we can see that it’s quite easy to displace the two parts of the specimen. On the other hand, we have a specimen which is rougher, and we see that it’s more difficult to displace the two parts of the specimen. This is because we have an interlocking effect of the asperities of the surface. The roughness is commonly quantified using the joint roughness coefficient, also called JRC. JRC is a visual measurement of the roughness of a joint profile. It ranges from 0 to 2 for a flat, smooth surface, and goes up to 18 or 20 for very rough joints. Some methods were proposed to infer JRC quantitatively rather than qualitatively, but we don’t have the time to detail them in this topic.
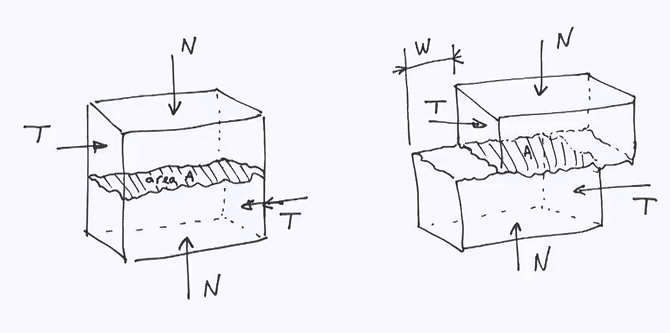
You might wonder why there is an indication of 10 centimeters on the figure her presenting JRC. This is because roughness is scale dependent. When looking at the joint on this figure overall it contains gentle undulations. If you look at it more closely, you can now perceive details that you could not see before, and it seems rougher. This is evidenced on the close-up. If you now could touch the joint you would feel a texture, maybe like sandpaper. So the perception of roughness is different at each scale. Discontinuities on rock joints typically have a low tensile strength. When it comes to the contribution, to the strengths of a rock mass, it is mainly via the shear strength. For example, on this sketch, if the slope is stable and no block has fallen, it is because the joints have enough strength to resist shearing, or sliding. The shear strength of a rock joint, or discontinuity, is typically measured using a direct shear test where a load is applied initially, normally to the joint, before this later is sheared. During the test, the tangential force, t, recorded, to displace one part of the joint is recorded together with the actual displacement w. N and t are later converted to stresses by dividing them but the contact area of the joint, a. these figures shows a typical tangential stress – tangential displacement curve where a peak can be observed followed by a plateau, called residual value. The peak value is typically the value used to define the shear strengths of the rock joint.
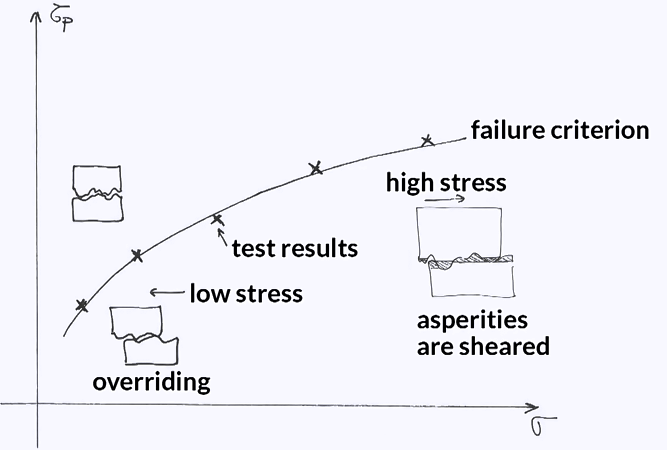
As for intact rock, the value of shear strengths is not unique and depends on the level of confinement, or the magnitude of the normal load applied to the joints. So it I required to define the failure criterion and as for intact rock, the higher level of confinement, or normal load, the higher the shear strength. An example of failure criterion is given in this figure. And on low confinement, the walls tend to override, while at a high confinement, the asperities tend to be sheared off. You can see that the evolution of shear strengths is typically nonlinear with the vertical confinement. We said in an earlier topic that water flows in rock joints and that water can be detrimental to the stability of a rock mass. Why is that? As water flows in a rock joints and water pressure develops, this pressure will counteract the normal force acting on a joint, hence reducing the effective force acting on the contact. By reducing confinement, it reduces the shear strengths. Discontinuities on rock joints contribute to the mechanics of a rock mass via the shear strength, and it is most important to know that roughness and water does affect the shear strengths of discontinuities.
https://youtu.be/HtjyHO0_It4
Direct shear tests on irregular surfaces
The main purpose of this series of tests made within the Pit Slope Project was to determine the shear strength variation with normal pressure of irregular fracture surfaces similar to natural tension joints. While such tests have been made previously by certain investigators, the majority of such tests were performed at relatively low normal pressures. The tests carried out in this investigation were designed to cover the whole normal pressure range up to the uniaxial compressive strength of the joint wall material.
Properties of the model material
Commercially available, compressed concrete bricks were selected as the model material because they had a rock-like behaviour at failure, with the strength and friction properties of the same order as the rock, and were available in a uniform quality at a relatively low price.
The average properties of the model material, determined in a special series of tests, were found to be as follows:
Uniaxial compression strength, Co = 24.84 MPa
Uniaxial tensile strength, To = 2.76 MPa
Modulus of Elasticity, E = 11448 MPa
Poisson’s ratio, v = 0.16
Porosity, n = 23%
Average angle of friction of saw-cut surfaces, ∅f = 38°.
For the present direct shear tests, the bricks of original size 23 x 10 x 5 cm, were split between two opposite wedges along their length, so that two irregular surfaces of 23 x 5 cm were obtained. Three of such closely fitting bricks were then put side by side in the shear box and sheared in a loading frame. The size of the shear box was 25 x 15 cm for the lower (mobile) half. The fixed half was longer in order to keep the shear area constant during the test. Actual size of shear surfaces was 15 x 20 cm and 15 x 15 cm respectively. During each shear test, the normal load, the shear load and the corresponding displacements, were electronically recorded.
Results of tests
Altogether 21 successful tests of this type were carried out, and their principal results are shown graphically in Figures 3 and 4. In Figure 3, the shear strengths measured in the tests are shown in a Mohr plot, together with some results of similar tests performed earlier by Archambault using the same material and technique. In the same figure, both the failure envelope of the solid brick and the friction envelope for saw-cut brick surfaces, are shown for comparison.
In addition, in Figure 3, the results of tests are compared with some strength prediction methods to be described in the following.
Figure 4 shows the associated dilation rates at failure measured in the same tests, together with the calculated values of the parameters v and as.
Discussion of results
In Figure 3 it will be seen that the strengths measured in the tests were located within a curved zone, starting at the origin and climbing up midway between the two limiting envelopes, for solid substance and friction, respectively, to meet the former at about σ/Co = 0.8. It will also be seen that the results obtained in the two independent series of tests agree very well together.
In order to see what may be the best way for predicting the shear strength of such tensile- fracture- induced irregular surfaces, two attemps have been made:
- In the first, the strength was calculated by using the proposed shear equation Eq. (6). For irregular rock surfaces, the values of the two parameters, as and v in the shear equation have been calculated using Eqs. (10) and (11), with tan io = tan 33° – 0.65. The calculated values of the two parameters are shown in Figure 4, and it will be seen that those of v agree well with the average dilation rates observed in the tests.
Using these parameter values in the shear formula, together with the values Co=24.8MPa, n = 9, for the solid material, and ∅f = 38° for the frictional component, and by assuming a complete interlock (n = 1), the dashed failure line shown in Figure 3 was calculated.. The calculated line is seen to follow well the observed strengths with a slight tendency of being on the upper side. - In the second attempt, the strength was calculated by using Patton’s shear equation Eq. (4), in which ∅f = 38° as before, while i was assumed to vary with the normal pressure according to Eq. (14). The lower dash-dotted failure line shown in Figure 3 was obtained in such a manner, with io = 33° in Eq. (14). It will be seen that a very good lower bound is obtained in such a manner in the whole investigated region of normal pressures.
Finally, it is found from the results of the tests, and also by looking at the average slope of the latter calculated failure line, that at low normal pressure ratios, i.e., for o< σ/Co < 0.1, a fairly good approximation of the measured strength is a straight line deviating by 15° from the friction (∅f) line. In other words, io = 15° seems to be a very good first approximation for irregular surfaces at very low normal pressures.

