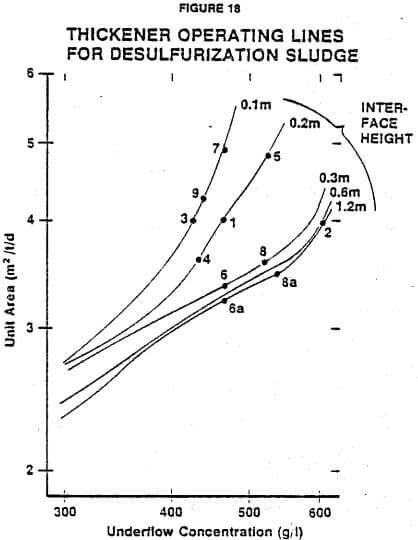
Where there is little significant effect of compression factors, the bed depth can be selected based upon operating characteristics of the thickener installation. In this case, information must be available (or assumed) concerning the normal fluctuations in feed rate and concentration. Also, sludge storage requirements should be considered.
For illustrative purposes, the following example of thickener operation is given: A thickener is being fed at an average rate of 1000 kg of solids per hour, and the thickener has 72 m² of surface area. It is expected that the feed rate could increase by as much as 20% for up to 10 hours and decrease by as much as 30% for up to 20 hours. The unit area for this thickener is 3.0 m²/mtpd, the average underflow concentration is 400 g/l and the limiting concentration is found by calculation or graphical methods to be approximately 200 g/l.
In this case, a minimum desirable sludge depth is set at 0.5 meters on the sidewall of the thickener, because no significant change in underflow concentration occurs with normal fluctuations in bed depth. Then, considering the low feed rate situation, the expected bed drop would be:
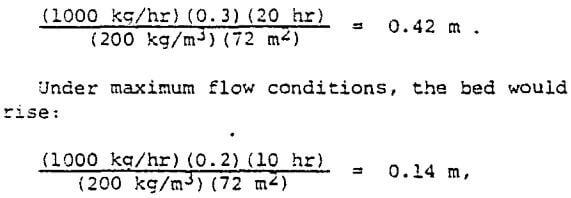
and the maximum interface level would be 0.5 + 0. 42 – 0.14 = 1.06 m. This bed depth should be added to the feedwell depth to give the approximate minimum sidewall depth required for the thickener.
Thickener Compression Tests
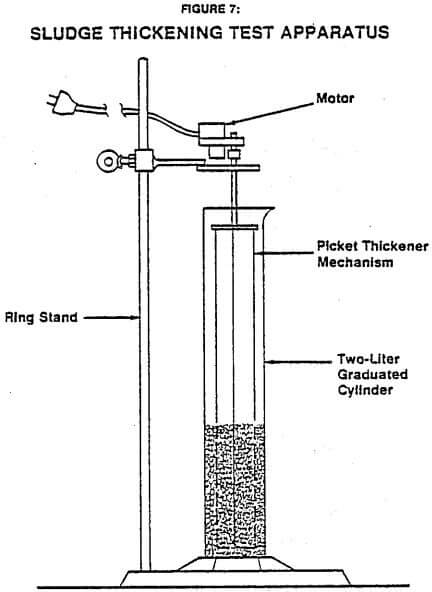
Data to test the math models were generated from batch and continuous test cylinders. Batch tests were carried out in 2-liter graduates 42 cm high and in a plexiglass column 2 m high by 38 cm diameter. Both columns were equipped with slow-turning rake mechanisms. A diagram of the 2-liter test unit is shown in Figure 7.
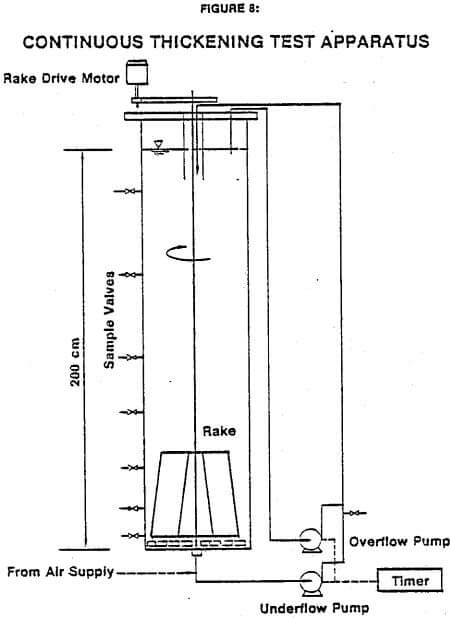
The large column was also equipped with underflow and overflow tubing-type pumps so that it could be used for continuous tests. The underflow and overflow were remixed in the line and used to feed the thickener. Pumping rates were controlled with variable speed motors, but a 5- minute timer was also required in order to run the units intermittently to produce low flow rates. The timer extended the range of thickener loading rates to 1/30th of the full pumping rate. A diagram of the large column is shown in Figure 8.
Samples of various slurries were agitated in the cylinders prior to starting the batch tests. In the 2-liter graduates, a plunger was used to uniformly mix the slurries. The large column was mixed by injecting air into the bottom.
Batch test data included measurements of the interface level as a function of time and of concentrations of solids at the beginning of the tests.
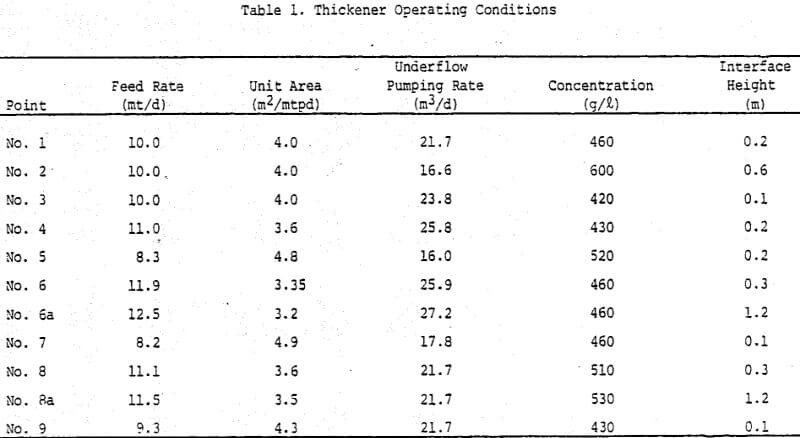
The continuous tests were run by establishing a pumping rate and allowing the thickener to reach steady-state. Once the underflow concentration and interface height stabilized (which took from one to four days for the slurries tested), the thickener was regarded to be at steady-state. Rates, concentrations and interface heights were then documented and concentration profiles in the thickener were measured at eight sampling points. A new underflow pumping rate was then established. Tests were made at various inventories of solids in the thickener in order to evaluate the effects of different compression forces.
Test Results without Compression
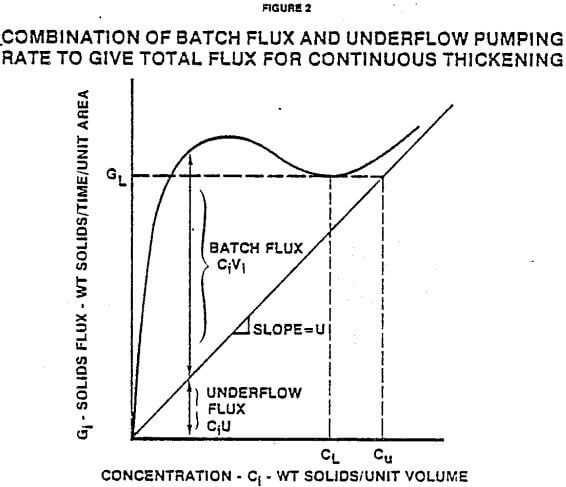
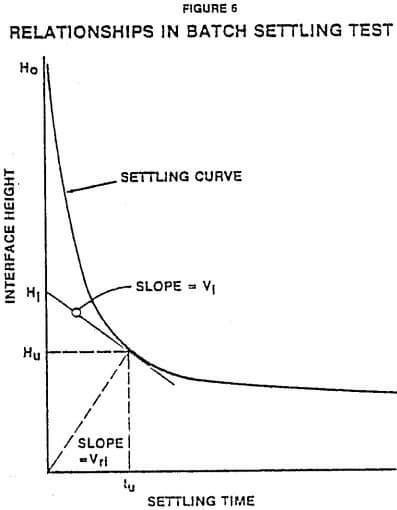
The math models described earlier indicate that if the relationship between settling velocity and concentration could be established through batch settling tests, then the performance of a continuous thickener operating under similar conditions could be predicted. The relationship developed by Kynch as described earlier and illustrated in Figure 6 suggest a means of determining settling velocity as a function of concentration by running a single batch settling test.
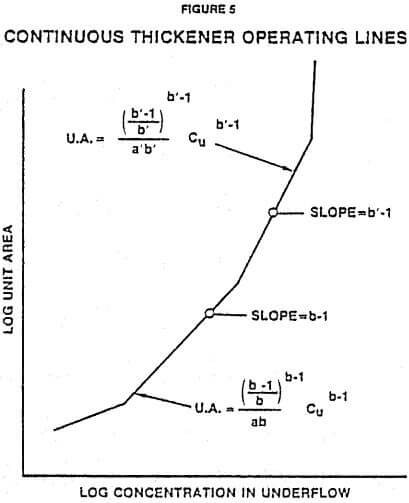
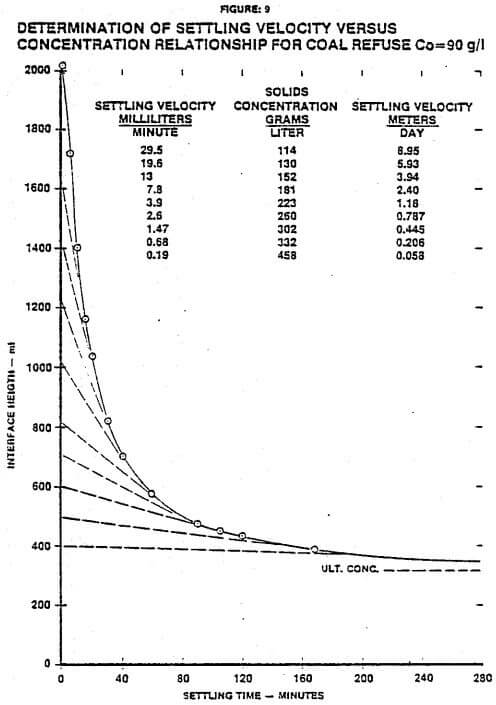
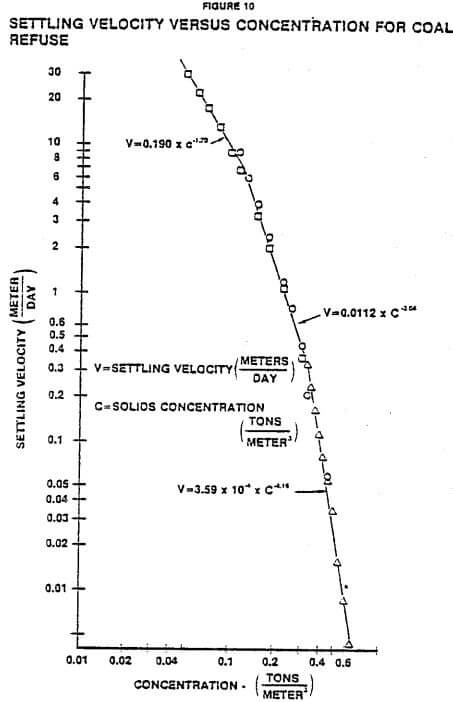
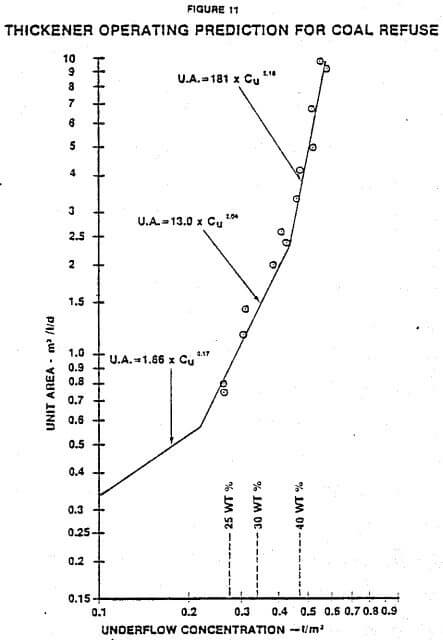
Figure 9 is a batch settling curve of interface height versus time for a coal refuse slurry taken at a low sludge inventory to minimize the effect of compressive forces. The relationship of concentration and settling velocity was obtained by drawing tangents. Figure 10 is a log-log plot of settling velocity versus concentration determined from Figure 9. Three straight lines were selected as shown to relate velocity and concentration. The equations of these lines contain the values of “a” and “b”. The predicted relationship between unit area and underflow concentration was calculated using Equation (12). These predictions are shown in Figure 11 along with the continuous thickening data from the pilot-scale thickener. The predicted operating curve agrees very well with the actual operating data.
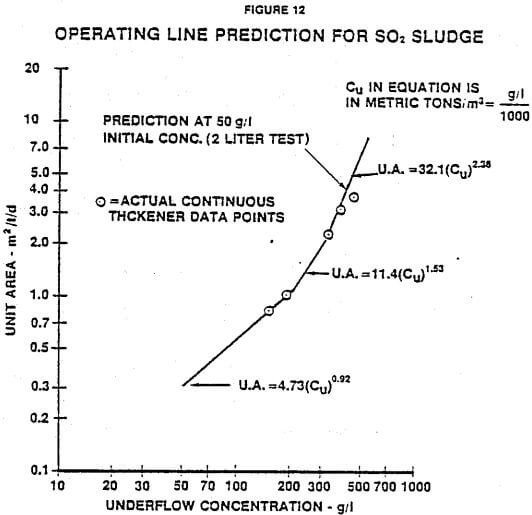
A similar series of test results and predictions is shown in Figure 12 for a desulfurization sludge. Figure 12 is the predicted operating line along with actual data from the continuous thickener. Again, good agreement is obtained between predicted and actual results.
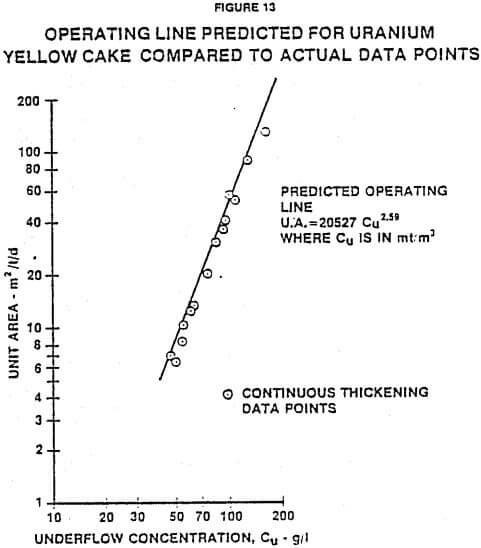
Figure 13 shows the predicted operating line compared to the continuous data for uranium yellow cake. Over the range shown, only one straight line is needed to describe the operating data accurate for this particular slurry.
Test Results with Compression
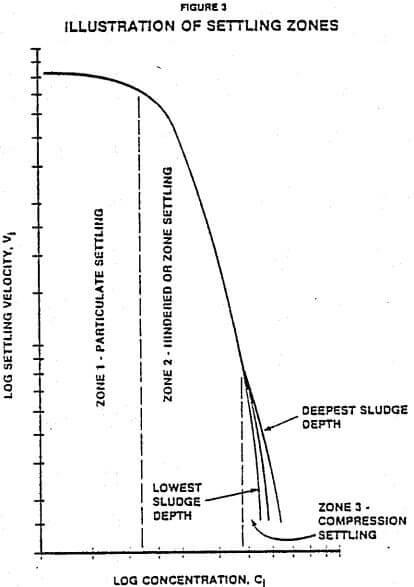
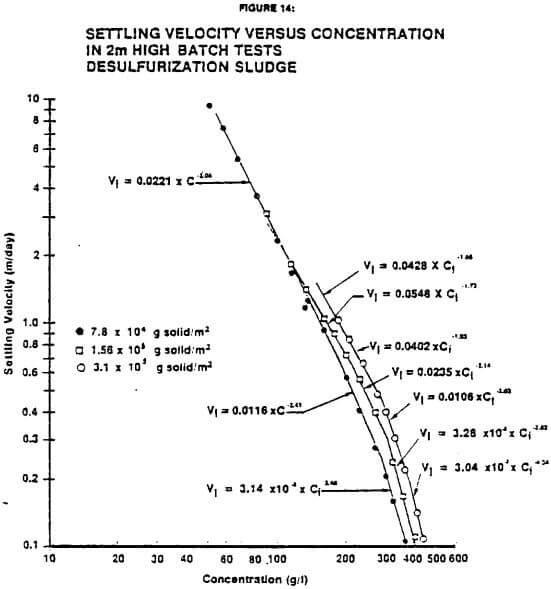
The results discussed so far have been for batch and continuous tests where the compressive force, due to sludge depth, was minimized. Even if the individual particles are not compressive themselves, groups of particles exhibit “compressive” behavior in that compression forces influence settling velocities, especially at higher concentrations. Even though the model described in this paper does not include a method for predicting the effect of compression force, it can be used to predict thickener performance if the batch tests are run at or near the depths and concentrations expected in the full-scale, thickener. Figure 14 is a plot of settling velocity versus concentration developed from batch tests at three different solids inventories. The data are for flue gas desulfurization sludge and were taken in the large column. As the inventory of solids is increased, the compressive forces are increased, and the higher settling velocities are achieved at equivalent concentrations. This increase in settling velocity is particuarly pronounced at higher concentrations.
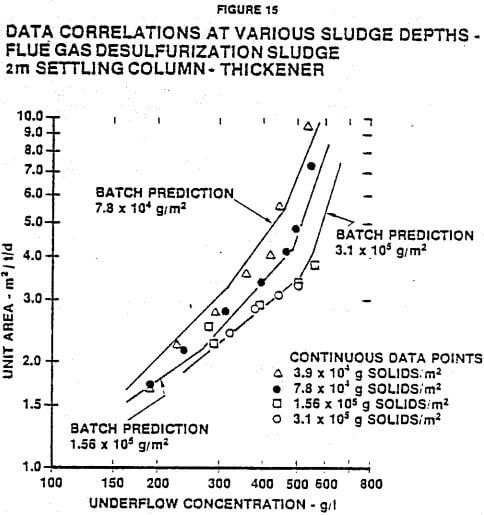
Figure 15 shows continuous data collected on the same desulfurization sludge in the 2 m high column at various inventories and predictions from the batch test results of Figure 14. Since the bed depth changes with unit area, only the inventories of solids are indicated on the graph. The types of pumps used in the continuous tests were not capable of operating at underflow concentrations above approximately 550 g/l (42 wt% solids). Therefore, the continuous data points could not be collected above this underflow concentration, although the batch predictions extend beyond.
The continuous data shown in Figure 15 indicate that solids inventories have a significant effect on the unit area required for this SO2 sludge, but solids inventories above 1.55 x 10 5 g/m² have almost no additional effect. At low concentrations (below 300 g/l), there is little effect of solids inventory because concentrations are not high enough to be influenced by comrpession force. As the underflow concentration increases, the effect of solids inventory becomes greater due to greater ability of the solids to transmit their weight to lower layers.
The batch predictions, shown in Figure 15, calculated from Equation (12), cover the same range of data as the continuous tests. At low underflow concentrations the predicted curves agree very well with the actual data obtained in the continuous tests. At high underflow concentrations, there is a difference between the batch predictions and the continuous data. This phenomenon is probably due to the fact that the concentration increases with sludge depth even at the final condition in the batch settling tests. The theory used to predict the unit area as a function of the desired underflow concentration is developed under the assumption that the concentration profile is uniform at the final equilibrium condition in the batch tests where there is no further movement of either solids or liquid.
The predicted underflow concentration obtained from the batch tests corresponds to the average concentration of the slurry bed as described earlier. The average concentration of the slurry bed is always lower than the concentration near the bottom of the cylinder, which represents the predicted underflow concentration of the continuous thickener more closely at higher unit areas.
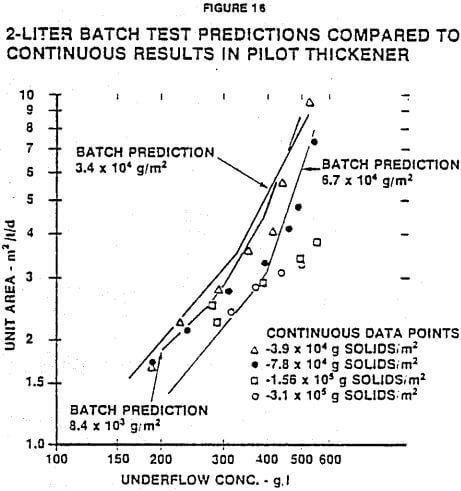
A comparison of batch tests performed in 2- liter cylinders with the continuous data taken in the large column is shown in Figure 16. At high underflow concentrations, the predicted curves lie to the left of the actual data, and there is more descrepancy between the batch prediction and the continuous data. Deeper settling volumns produce results closer to the data taken in the continuous thickener.
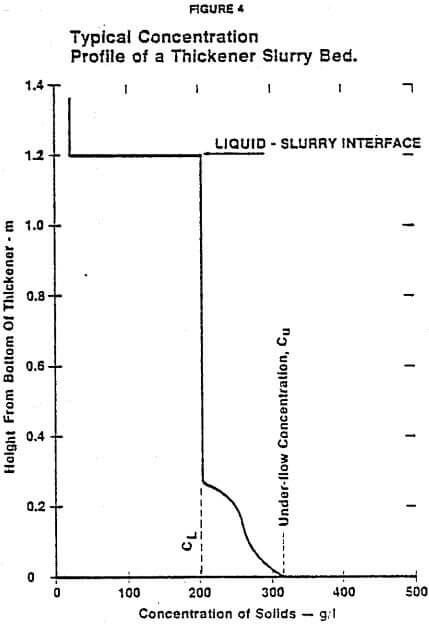
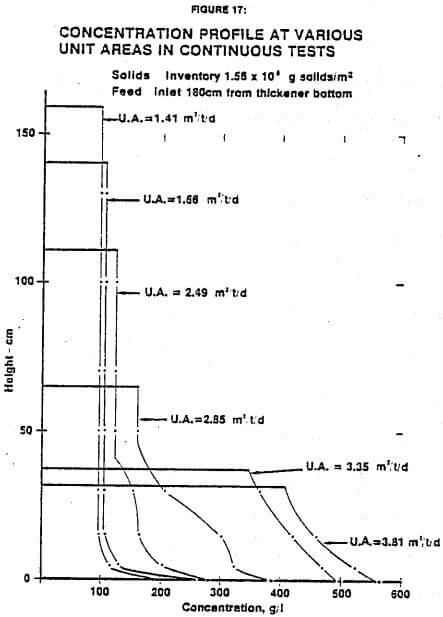
An important aspect of the thickening data is the change in concentration profile at various unit areas. Figure 17 shows concentration profiles for desulfurization sludge at six different unit areas and one solids inventory. As the unit area is increased, the sludge depth decreases as shown. At the lower unit areas, there is a relatively uniform concentration, CL. At higher unit areas, the weight of solids above the lower layers increases the compression force. It should be noted that the limiting concentration increases at higher unit areas and higher underflow concentrations, as predicted by theory, until it disappears.
Test work on the effects of sludge depth are continuing. Future work may lead to development of math models that permit correction for bed depth without data taken at actual depths. For the present, it is concluded that batch tests must be made at or slightly above the slurry inventory (weight dry solids/unit area) expected in the full-scale thickener.
