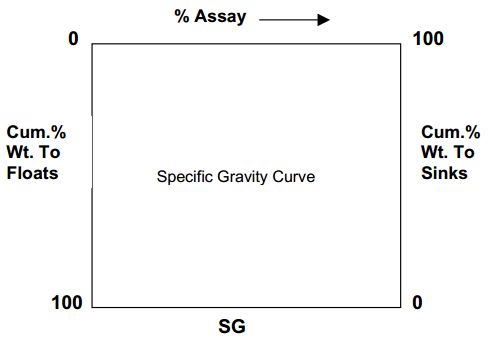
Heavy liquid data can also be interpreted by washability curves. To plot these curves, the axes shown here.

The cumulative % wt. Floats or sinks is plotted against S.G.
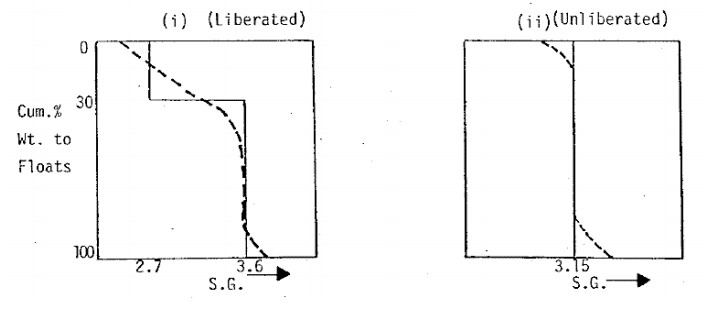
If the material consists of two minerals completely liberated from each other, the curve will be a stepped line. The width of the step indicates the S.G. difference between the minerals and the height of the steps the relative amounts of the minerals present. In practice, the minerals will not be completely liberated and a stepped curve will be obtained.

S.G. values lower and higher than the theoretical minimum and maximum will often be obtained due to the presence of closed pores and the inclusion of heavier minerals in the material. The S.G. curve should not be used alone to indicate the ease or difficulty of separation because the width of the step depends on both the liberation of and the S.G. difference between the minerals. The curve is also difficult to interpret when a mineral with two S.G. phases is present.
More a https://www.scribd.com/doc/54781336/Wash-Ability-Curves
