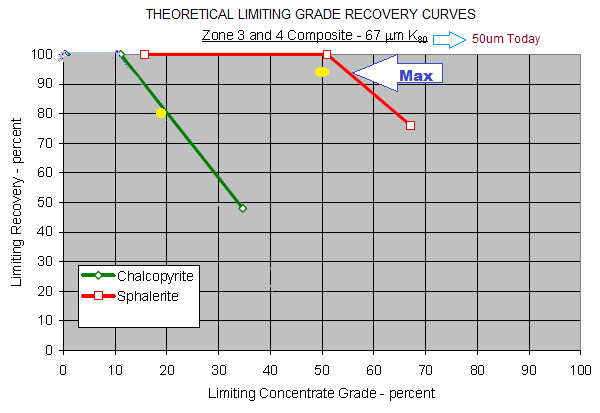
To generate a limiting grade-recovery curve, three points are shown for each mineral.
- The left most end point of the curve represents the feed grade of the composite.
- The middle point of each curve represents the concentrate grade produced when all of the particles bearing target mineral are recovered.
- The far right end point represents the concentrate grade and recovery of all liberated target mineral particles.
 The curves are determined purely by analyzing the physical mineral locking characteristics of the sample. Concentrates produced in plant or from testing will take a grade and recovery position somewhere directly under these curves. The operating point (currently the Yellow DOT) for very efficient flotation systems typically takes a position very close to, but under these curves. The only way to change the limiting grade-recovery curves is through the application of grinding power.
As shown here, the chalcopyrite for both composites show significant reductions in recovery with high concentrate grades. Additional grinding power will be required to achieve both maximum grade and recovery. Theoretically, high sphalerite recoveries can be achieved at commercially acceptable grades with no additional grinding power.
Currently, it is technically possible to improve upon the Zinc Conc grade (to 54-55%) without affecting the Recovery.
After that point, in both the Cu and Zn cases, recoveries could only be increase with the corresponding lose in conc grade.
This short summary explains where metallurgy is today using its Mineralogy data and its corresponding limiting grade-recovery curve.
The data displayed below is at a 67 micron grind VS the current 50 micron the plant operates at. Although this finer grind opens the door to better yet metallurgy, the upside will be limited.
