Table of Contents
In connection with its continuing studies of the characteristics of alloys and alloying elements, we investigated the crystal structure of fused boron. This Boron Crystallography report describes how the structure of fused boron was found to be rhombohedral by the powder method for crystal-structure determinations by X-ray diffraction.
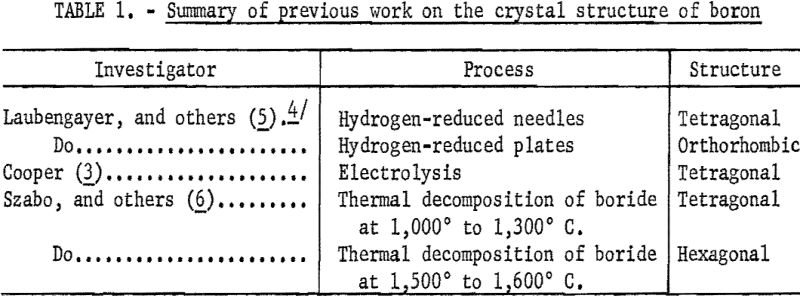
The determinations of the crystal structure of boron reported in the literature were made on crystals prepared by various methods such as electrolysis, thermal decomposition of a boride, or by hydrogen reduction of boron tribromide. Table 1 summarizes the data found in the literature on the crystal structure of boron. The information shows the following: (1) Three structures have been reported for boron, (2) boron prepared by different processes or even by varied conditions of a process produces crystals of different structure, and (3) no information is given on the crystal structure of fused boron.
Present Investigation
In this investigation powder X-ray diffraction techniques were used to determine the crystal structure of samples prepared from fused boron. This report includes a description of the method used, a discussion of the sample and its preparation, and the analysis of the X-ray diffraction data. When the pattern obtained from powder samples of fused boron was compared with the patterns found in the literature, the structure of fused boron differed from the structure of material prepared by electrolysis and thermal decomposition. Therefore, analyses of the data obtained were made to determine the crystal structure of fused boron.
The general plan was first to determine the d-values for each diffraction peak on the X-ray diffraction patterns and then to plot these logarithmically on a rule. This rule was compared with a graph of various systems. To find a position on the graph where curves corresponded to points on the rule a position was found where the data fit the hexagonal system. With the rule positioned where the points on the rule matched the curves on the graph, the hexagonal indices were recorded for each point on the scale. These indices were checked to see if they satisfied the condition for a rhombohedral-centered hexagonal lattice. After determining that the data did fit such a lattice, the hexagonal indices were transformed to rhombohedral indices by applying the method described by Buerger. Finally, the relative intensities of the diffraction peaks were calculated and a table giving the d-value, relative intensity and indices for each peak was constructed.
To verify the results, a second sample (produced and arc-melted by the Bureau of Mines), was also used to establish the structure of fused boron. The procedures were the same as those used in establishing the structure of fused boron prepared by Cooper Metallurgical Associates.
Experimental Procedure
A piece (0.4 gram) of fused boron obtained commercially was crushed in a diamond mortar to <200 mesh powder. The powder sample was heated in a vacuum of less than 1 micron of mercury, held at 1,000° C. for 24 hours, then cooled to room temperature. A part (0.1 gram) of the heat-treated material was used for spectrographic analysis. The remainder was used to obtain the X-ray diffraction pattern.
Chemical and Spectrographic Analyses
The sample of 0.1 gram was analyzed spectrographically to determine its impurities. (See the following listing.) Other impurities, in amounts less than 0.01 percent, were beryllium, molybdenum, and vanadium. Chemical analysis showed that the carbon content of the material was 0.82 percent.

X-ray Technique
Equipment
The X-ray diffraction pattern was obtained by using a Norelco Diffractometer equipped with a Geiger counter. A copper anode X-ray tube and a nickel filter were used. The equipment was standardized against powdered silicon. A narrow slit was used, and the specimen was scanned at the rate of a half degree per minute to produce a pattern having good resolution.
Data
The interplanar spacing, or d-value, was determined for every peak corresponding to a diffraction angle between 20° and 52°. The relative intensity, or the ratio of the estimated intensity of the peak to that of the strongest peak of the pattern was calculated for each peak. These d-values, relative intensities, and corresponding indices are given in table 2.
Analysis of Data
Three operations were necessary for assurance that the data can be indexed on a rhombohedral cell. First, the data were indexed on the graph of the hexagonal system. Second, the indices obtained from the hexagonal graph were shown to satisfy the condition -h + k + l divisible by 3. Third, these indices were converted to rhombohedral indices. The procedures used in each of these operations are described in this section of the report.
Indexing
The indexing, or assigning of indices to the d-values, was done by using a graph of the hexagonal system that was developed by Bunn. These graphs are drawn with the coordinates log d and log c/a instead of d and c/a as in the more commonly used charts developed by Hull and Davey. The use of logarithms widens the graphs so that they are easier to use, especially for the smaller d-values. To use these charts the d-values were plotted on a rule to the same scale that was used for the graph. The rule was positioned on the graph so that the marks on the rule, representing data values, coincided as nearly as possible with the curves on the graph. At the best position found for the rule, all except eight points marked on the rule coincided with a curve on the hexagonal crystal system graph. Seven of these eight points were within 0.5 percent of coinciding with a curve when a suitable c/a ratio was used. This was checked by putting marks on the rule giving the position of the curve that was nearest each of the seven points. These marks were then referred back to the scale that was used in plotting the data and their values were determined. These values were compared to the data values. At c/a value of 2.18, the data values were within 0.5 percent of the values for the curves. Hexagonal indices for each point were taken from the graph. These indices are given in table 2.
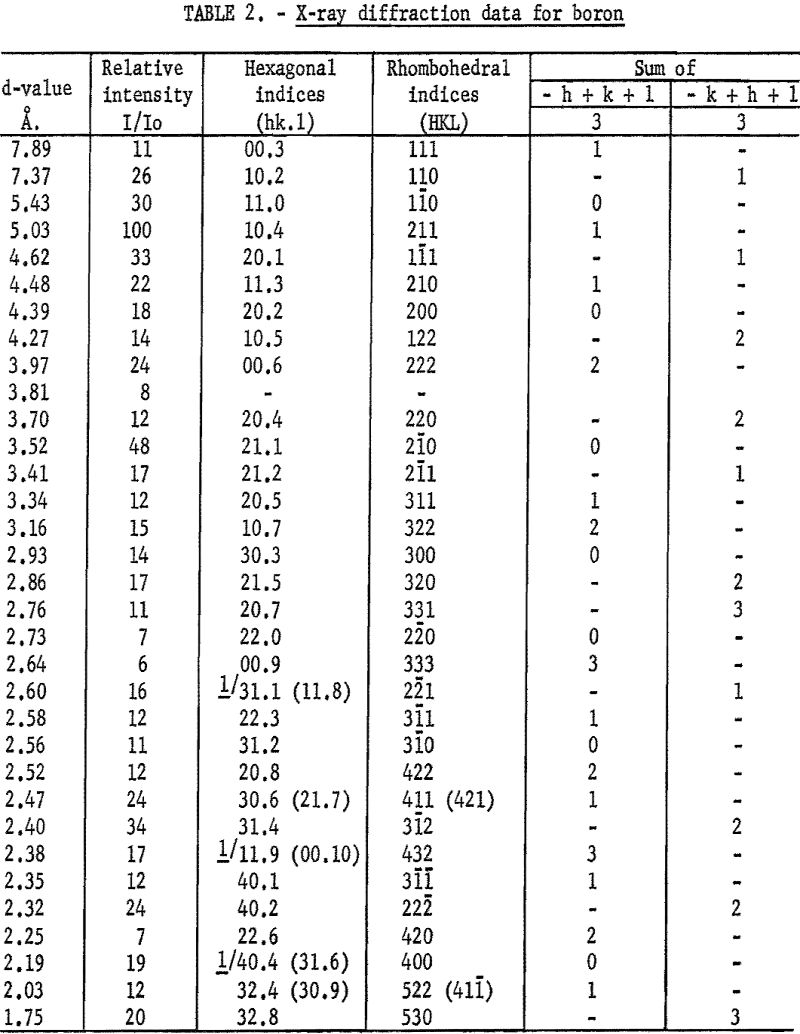
No indices were found for d equal to 3.81 A. Since all of the other values coincided with curves on the hexagonal graph, it was suspected that the 3.81 A. line might be due to the presence of an impurity. Therefore, the diffraction data for compounds of iron, nickel, and silicon were examined. These elements were chosen because spectrographic analysis showed that they were present in the sample in excess of 1 percent. None of the data available on compounds of these elements with boron had a d-value of 3.81 A. However, X-ray diffraction data for B4C gave d equal to 3.81 A. as the third most intense line in the diffraction pattern. The two lines of higher intensity were at d equal to 2.38 and 2.58 A. These values were also found on the boron pattern and appear to belong also to the boron structure. Chemical analysis indicated 0.82 percent carbon which is enough to make 3.8 percent B4C. This concentration is high enough to produce the observed diffraction peaks.
If a rhombohedral cell is indexed on a multiply-primitive hexagonal lattice, the hexagonal indices of all rhombohedral planes will satisfy the condition that – h + k + l is divisible by 3. This is a direct consequence of the transformation equations between the two indices. However, in the hexagonal system an interchange of the first two indices of a plane produces an equivalent plane related to the first one by symmetry. This means that (hk.l) planes are equivalent to (kh.l) planes, and the condition that the sum – h + k + l be divisible by 3 should be supplemented by the condition for the equivalent planes; – k + h + l is divisible by 3.
Referring to table 2, all observed d-values correspond to planes which satisfy the condition for a rhombohedral cell except (11.8), (11.9), and (31.6). However, in each of these instances there was an ambiguity in the assignments of the plane to the observed line, and the alternative assignments ( (31.1), (00.10), and (40.4) respectively), all satisfy the condition.
Conversion of Rhombohedral Indices
The hexagonal indices were converted to rhombohedral indices by solving the following set of equations for each set of indices:
H = 1/3 (2h + k + l)
K – 1/3 (- h + k + l)
L = 1/3 (- h – 2k + l)
where hkl are the hexagonal indices and HKL are the rhombohedral indices. The rhombohedral indices for each diffraction peak are given in table 2.
Verification of Results
To verify that the pattern obtained on the sample of commercial boron was representative of the structure of fused boron, a second diffraction pattern was obtained for boron produced by the Bureau of Mines, Albany, Oreg. The boron was made by reducing B2O3 with magnesium. A sample of this material was arc-melted and powder samples for spectrographic analysis and X-ray diffraction were prepared. The results of spectrographic analysis follow:

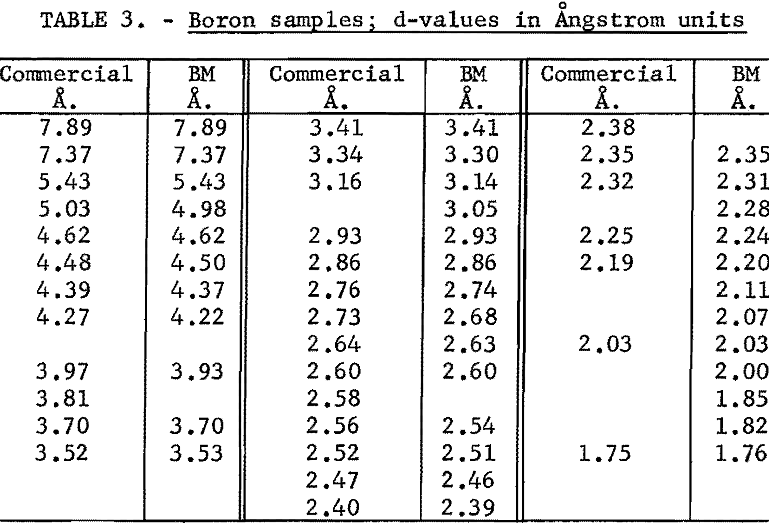
An X-ray diffraction pattern was obtained for a powder specimen and the d-values from this pattern are compared to the d-values from the pattern of commercial boron in table 3. The d-values of the Bureau of Mines sample showed general agreement with the other d-values. The d-values of 3.81, 2.58, and 2.38 A. were not obtained from the Bureau of Mines boron, whereas d-values of 3.05, 2.28, 2.11, 2.07, 2.00, 1.85, and 1.82 A. were obtained only from the pattern for the Bureau of Mines boron. Two of the d-values, 2.58 and 2.38, that were missing for the Bureau of Mines material were for peaks that had relative intensities of 17 or less on the first pattern. The fact that these lines were missing on the second pattern can be attributed to lack of complete random orientation of the particles, a common condition in powder diffraction patterns. The other value, d equal to 3.81 A., has been ascribed to boron carbide in the commercial sample.
The seven d-values that were found in the Bureau of Mines pattern, but were not found in the commercial pattern, were plotted on the rule that was used in indexing the commercial pattern. The rule was placed in the position used before. The seven points coincided with curves on the graph and the indices of the planes of these curves were read. Their indices were checked to show that they were for planes in a rhombohedral cell. The indices were next converted to rhomobhedral indices. The d-values and indices are given in table 4. The larger d-values found on the Bureau of Mines pattern are attributed to a slower scanning rate used in obtaining this pattern.
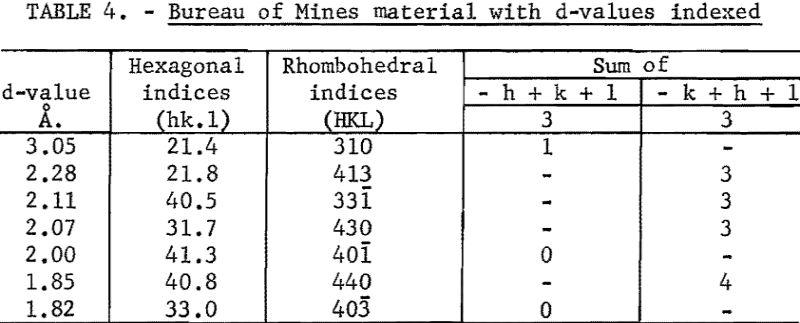
Since all of the differences found between the two patterns could be explained, the foregoing paragraphs showed that the two patterns are due to the same crystal structure. Therefore, it was concluded that the crystal structure of fused boron is rhombohedral.
