Table of Contents
- Retardations
- Mode of Studying the Thermal Phenomena
- Nomenclature
- Are V-change & W-change Reversals of Each Other
- The Position of the W-Range
- Distribution of the Retardations
- Influence of T min on the W-retardation
- Influence of T max on the V-retardation
- Influence of Rate of Heating or Cooling on the Retardations
- Theories of the Progress of the V-change
- Inertia
Retardations
If high-carbon tool-steel be heated to very dull redness and then suddenly cooled, for instance by quenching in water, it is not thereby considerably hardened ; but such sudden cooling, if it be from bright redness, hardens the metal intensely. In the former case the steel can be scratched with a knife, in the latter it will scratch glass. The hardening power is thus acquired between low and high redness. As steel is gradually heated other striking changes occur in this range of temperature. The carbon changes from one state of combination with the iron known as that of “ hardening-carbon,” to another known as the “ non-hardening ” or “ cement ” state. “ The rise of temperature is retarded or perhaps even reversed; the expansion is checked and reversed, so that the metal contracts momentarily, and then re-expands; a dry crackling sound is heard ; the thermoelectric deportment becomes anomalous ; the coercive force and the power of being rendered a temporary magnet (whether by electric current or by another magnet) and hence of being attracted by the magnet, almost disappear, the latter at least through a series of distinct and separate diminutions; and the specific heat (as inferred from the quantity of heat given out by the metal when immersed in a calorimeter) suddenly increases, remaining astonishingly high from 660° to 720° C., when it again descends somewhat, but remains about twice as great as at the ordinary temperature. The changes in attraction by the magnet and in specific heat have been directly proved to be simultaneous and in the present paper we shall inquire whether certain of these other phenomena occur together.
As the metal again cools slowly the reverse changes occur; the magnetic properties are regained and the hardening power is lost; the specific heat falls suddenly ; the carbon changes back to its original condition ; and heat is evolved on reaching a certain critical point so suddenly as to raise the temperature visibly. The phenomena in cooling occur at temperatures lower than those of the reverse ones in heating.
In the experiments which form the basis of the present division I studied three only of these different classes of phenomena, viz., (A) the sudden spontaneous absorption and evolution of heat which occur during heating and cooling; (B) the acquisition and loss of the hardening power; and (C) the changes in the condition of the carbon. My original object was to learn how and at what temperatures the hardening power is acquired and lost. Later I enlarged the scope of the inquiry, aiming incidentally to ascertain eventually whether what I may call the “ carbon theory ” of the hardening of steel was true, i.e., whether the reason why suddenly-cooled steel is hard while slowly-cooled steel is soft, is that the sudden cooling denies the time which is needed for the spontaneous passage of the carbon from the hardening to the non-hardening or cement state; while the slow cooling affords sufficient time.
As steps towards the solution of this, I set before myself the following questions: (a) Does the change of carbon-condition invariably accompany, and is it always proportional to the loss and gain of the hardening power? This, if true, would be a nearly conclusive affirmative answer to my main question.
(b) Do the sudden spontaneous absorption and evolution of heat during heating and cooling correspond always and accurately to the acquisition and loss of the hardening power, or can they be divorced from it?
So marked a change as occurs in the chemical condition of carbon should produce some thermal phenomena. If the carbon-changes do not correspond exactly to the loss and gain of the hardening power, then there should be some heat-evolution or absorption which does not correspond with this loss and gain of the hardening power. Hence if all the thermal phenomena tally exactly with the loss and gain of the hardening power, we naturally infer that the changes of carbon-condition do also ; and we thus infer an affirmative answer to our second question and through it to our first. The direct evidence as to the correspondence between the carbon-change and the loss of the hardening-power is given in Part IV.
As a preliminary step let us study in some detail the thermal phenomena, before seeking the relation between them and the acquisition and loss of the hardening-power.
Mode of Studying the Thermal Phenomena
If we heat a bar of copper by a flame of constant strength, and note carefully the interval of time occupied in passing from each degree to the next higher degree, we find that these intervals increase regularly, i.e., that the bar heats more and more slowly as its temperature approaches that of the flame. If we substitute a bar of steel for one of copper, we find that these intervals indeed increase regularly up to a certain point, when the rise of temperature is suddenly and in most cases greatly retarded or even completely arrested. After this the rise of temperature is resumed with intervals which, as in the case of copper, increase regularly as the temperature of the bar nears that of the surrounding objects; though other similar retardations may recur as the temperature rises farther. So if we cool a bar of steel slowly, the fall of temperature is greatly retarded when it reaches a certain point in dull redness. If the steel contains much carbon, and if certain favoring conditions be maintained, the temperature, after descending regularly, suddenly rises spontaneously and abruptly, remains stationary awhile, and then redescends. This spontaneous reheating is known as the “ after-glow,” “recalescence,” or “ Gore’s phenomenon ” from the name of its discoverer.
These retardations and this recalescense are the thermal phenomena which we are to examine. Clearly each retardation means that some change which evolves or absorbs heat is occurring within the metal.
A few typical examples of the rate at which the temperature changes during undisturbed heating and cooling, including these retardations, are shown graphically in Figs. 1 and 2 to 8 inclusive, in which abscissae (horizontal distances) indicate the temperature in degrees centigrade, and ordinates (vertical distances) indicate the interval of time occupied in passing from each degree to the next higher or lower degree, as the case may be.
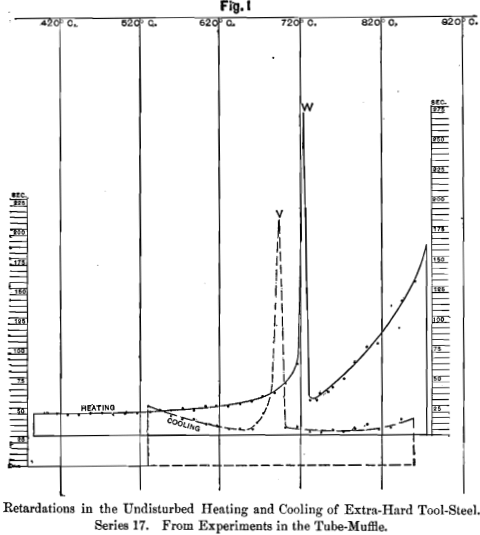
These intervals were measured by the second-hand of a clock. As the changes of temperature were usually very slow, a very fair degree of accuracy was obtained by having three observers work together, one calling out at the instant when each division of the galvanometer-scale was passed, a second calling out the time, and a third recording. In the ranges where retardations occur, the intervals were recorded for every 1.4° C. of rise or fall of temperature; elsewhere for every 14° C.
Nomenclature
Chernoff early detected critical, or at least important, points or ranges of temperature which he called a and b. Osmond adopts his name a, by which I understand that he designates at once a retardation and the change which causes it. Retardation- points which occur during heating, i.e., those at which the regularity of the rise of temperature is broken, he calls ac (a chauffant ?); those which occur during cooling he calls ar (a refroidissant ?). He further discriminates between the different retardation-points which exist during one and the same heating or cooling by calling the lowest one acl or an; the next higher, ac2 or ar2; the next higher, ac3 and ar3, etc.
An objection to this nomenclature is that, by implication, it specifically identifies each individual retardation of cooling as corresponding to some definite individual retardation of rising temperature; and it further specifically identifies the individual retardations of one steel with those of others.
In my opinion, such close identification is not justified by our present knowledge; it tends to give currency to hypotheses which as yet rest on too slender foundations, and to introduce preconceptions.
Two of these retardations, one in heating and one in cooling, indeed seem so constant in position, both in different classes of steel and for different conditions of heating and cooling, that we may wisely assign to each a specific name ; but it is more prudent to select for them names that do not imply that they are related to each other, because such an implication begs one of the very questions which our experiments aim to examine.
I have therefore adopted Brinnell’s names, V and W, for the temperatures at which these particular retardations occur, W for the temperature of retardation during heating, V for that during cooling. Chernoff’s name, a, certainly has the advantage of priority, but he gave us no name for the retardation-point during cooling. To use his name, a, might give some support to Osmond’s theories, while Brinnell’s names, V and W, make no theoretical implications; indeed, they are already nearly as well and widely known as Chernoff’s. Were further justification needed, the incomparably greater thoroughness and value of Brinnell’s work in my opinion would give it.
W and V are names of temperatures, not of changes nor of retardations at those temperatures. I call these the V-change, the W-retardation, etc.
At present I make no assumption as to whether each change is a single one, or whether it consists of two or more distinct or even separable changes.
Are V-change & W-change Reversals of Each Other
In the study of these thermal phenomena the first question which I attempt to answer is this: Is the change which at V retards the cooling a reversal of that change which at W retards the rise of temperature? The plan followed in studying this question incidentally threw much light on the mode in which these two occur. To facilitate description of the experiments let me define certain symbols.
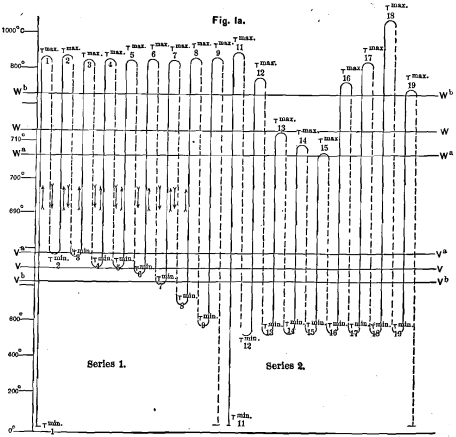
Two Series of Interrupted Heatings, alternated with Partial Coolings, High- Carbon Tool-Steel of Series 10.
NOTE.—The vertical scale is exaggerated in the range which contains the critical points, V and W; and in this range the positions of T max and T min are given only approximately, because the absolute positions of V and W are not constant. Full lines are heatings; broken lines, coolings.
Definitions
Suppose that, as sketched in Fig. 1A, I heat a bar to a certain temperature, then cool it partly, arresting the cooling while the bar is still very hot, and again heat it to some high temperature; that I again partly cool it to some other but still moderately high temperature, and again heat it a third time to some third maximum point, and so on. Let us call the temperature from which each cooling begins, i.e., the highest temperature which the preceding heating reached, the T max of that cooling; and let us call the temperature from which each heating starts, i.e., the lowest temperature reached in the preceding cooling, the T min of that heating. Thus, T min is the initial temperature of each heating, and T max that of each cooling.
If the V- or the W-retardation be not confined each to a single point, but be spread out over a range of temperature, let us, as indicated in Fig. 1a, call the point above V, at which the V-retardation begins, Va, and the point below W, at which it ends, Yb; and let us call the point below W, at which the W-retardation begins, Wa, and that above W, at which it ends, Wb. Then the V-range reaches from Va down to Vb, and the W-range from Wa up to Wb. W, then, will be simply the point of greatest retardation in heating, and V that of greatest retardation in cooling.
To measure R, the amount of retardation, we subtract from the time actually occupied in passing through the V-range or W-range the time which would have been occupied had the rate of heating or cooling been the same in that range as above and below it.
Prediction
If now, the V-change is a reversal of the W- change, then we should expect that, when by heating our metal past W we have caused the W-change to occur, it could not occur again till it has first been reversed by the occurrence of the V-change, i.e., till the metal has cooled at least into the V-range. Hence, on this same supposition, in heating through the W-range a retardation should occur if T min is below Va, but not if it is above Va; and, by like reasoning, in cooling through the V-range, a retardation should occur if T max has been higher than Wa, but not if it has been below Wa.
Further, if in a continuous series of alternate heatings and partial coolings we carry T min progressively lower and lower, we should in our heatings find more and more marked retardations in the W- range till T min has descended as low as Vb, but further lowering T min should not increase this retardation. Conversely, if in such a series we carry T max progressively higher and higher, the retardations which occur in cooling through the V-range should successively increase, till T max reaches Wb, but further elevating T max should not further increase this retardation.
Further still, the descent of T min through those parts of the V- range in which the retardation in cooling is most marked, should have the greatest effect in increasing the retardation in the following heating; and conversely the ascent of Tmax through those parts of the W-range, in which the retardation in heating is greatest, should increase most rapidly the retardation in the V-range in the following cooling.
In short, in either phase (heating or cooling) the effect of any variation of the initial temperature on the retardation should be proportional to the retardation in the opposite phase in the range covered by that variation.
Let it be very clearly grasped that the object of the experiments I am about to describe is to show whether the position of the initial temperature (T min or T max) of each heating or cooling, influences the retardation in that heating or cooling in the way which I have here outlined, and which would show that the V-change and the W-change are reversals of each other. Unless it be clearly understood that we are studying the influence of the initial temperature, T min or T max, on these retardations, what follows in (15) to (24) will be meaningless.
Verification
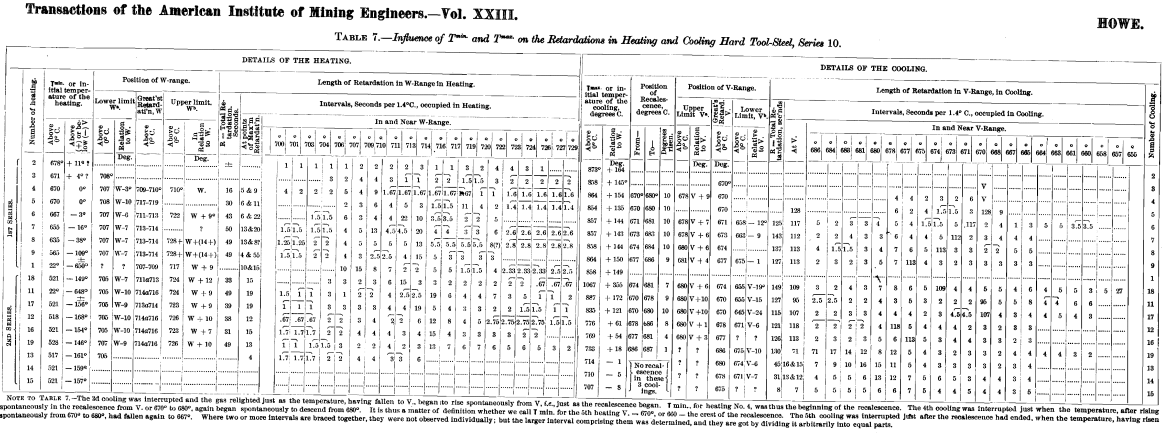
In order to test these predictions, two such series of heatings and coolings were carried out somewhat as sketched in Fig. 1a, and their results are condensed in Table 7. Bars of high carbon tool-steel of Series 10, with about 1.20 per cent, of carbon, were selected, because this metal gives very marked retardations at V and W, as Fig. 2 shows.
In the first series (heatings 1 to 9 inclusive) T max, the initial temperature of the coolings, varied relatively little, while T min, the initial temperature of the heatings, was purposely varied through and beyond the V-range; this was to show the influence of prior exposure to different parts of the V-range on the retardation in the W- range during the following heating. In the second series (heatings 11 to 19 inclusive) these conditions were reversed; T min was nearly constant, while T max was purposely varied through and beyond the W-range, so that we might learn how the retardation in the V-range in cooling is affected by prior exposure to different parts of the W- range.
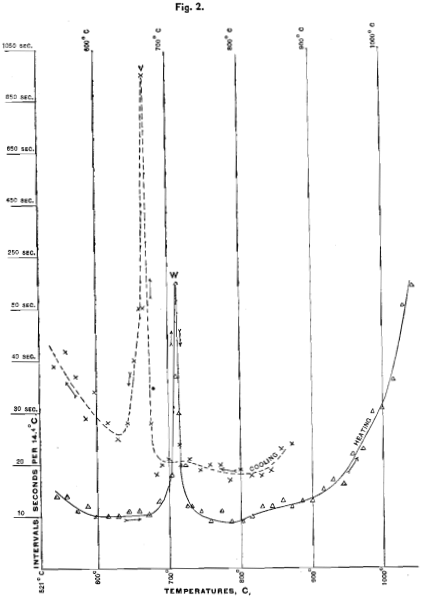
Retardations in the Undisturbed Heating and Cooling of High-Carbon Tool-Steel, Series 10. From Experiments in a Forquignon Furnace.
NOTE.—The vertical scale above the 50-second line is only 1-20th as large as below it.
Before attempting to verify our predictions, let us first learn the positions of our several points, V, W, Va, Vb, Wa and Wb, as indicated by the retardations; and let us ascertain the relative strength of the retardations in different parts of the V-range and of the W-
range. I will show later that we should expect the position and distribution of these retardations to be affected by the rate at which we heat or cool the metal. Because the V-retardation should be slight, and hence abnormal in quantity, when T max has been well below W, and the W-retardation should in like manner be abnormal in quantity when T min is well above V; and because, in each case, the abnormal quantity is likely to lead to abnormal position; therefore we should expect to learn the normal position and distribution of these retardations through studying those heatings in which T min is below Vb and those coolings in which T max is above Wb; and these we will especially study.
The Position of the W-Range
When the heating starts from below V (as happens in every case except heatings 2 to 5 inclusive), the positions of W and Wa are surprisingly constant. With a single exception, W lies uniformly between 711° and 716°, and Wa between 704° and 707°, a constancy which is surprising, in view of the serious sources of error. Wa here lies between W—6° and W—10.°
As T min in heatings 3, 4 and 5 of Table 7 is raised to and above V, though the position of Wa remains nearly constant, that of W varies strangely, yet not very widely, its highest point being 717° to 719°, and its lowest between 709° and 710°, a total variation of only some 9° or 10° C. Here a normal position for W is not to be expected.
As might be expected, the W-retardation ends more gradually and less regularly than it begins, and in most cases in the first series I cannot identify Wb confidently. In six of the heatings of the second series, however, Wb is tolerably well-marked, and more constant than we could expect, lying between 723° and 726°, or from 7° to 12° C. above W. In other cases it seems to be slightly more than 14° above W, and in still others, a faint retardation seems to extend nearly 30° above W. But I find no clear evidence that there is beyond W + 14° any retardation sufficient to be of importance for our present purpose.
The Position of the V-Range varies more than that of the W- range. Its greatest constancy is in the position of Va, which, in the ten cases in which T max is higher than W + 18° and in which Va is recognizable, lies between 678° and 681° C.; yet, in these same cases, the position of V varies some 8° C., lying between 670° and 678°.
The position of Va relatively to that of V, in the ten cases in which it is recognizable, lies between V + 1° and V + 10°.
Taking all the cases in which V is recognizable, we find a total variation of 16° C., viz., from 670° to 686°. The constancy of W and Wa argues that the variation of V is not due to observational error.
Just as Wb, the end of the W-retardation, is less marked and less constant than Wa and W, so Vb, the end of the V-retardation, is less marked and less constant than Va and V. In the ten cases in which Vb seems to be recognizable, it varies 30° C., viz., from 645 to 675°, and from V—1° to V—24°. Occasionally there were strong indications of retardation at lower points, even below 600° C.
I find no clear evidence that these considerable variations in the positions of V and Vb are due to variations in the position of T max, the initial temperature of the cooling ; their positions seem about as irregular in coolings whose initial temperature is far above W, as in those in which T max is near W. Indeed, even in the five cases in the first series of Table 7 (coolings 5, 6, 7, 8 and 9) in which T max is practically constant, V varies 7° C., and Vb apparently varies 17° C.
To sum up, the W-range normally runs from about 706° C. to about 723° C., covering from about 14° to about 20° C, Its point of maximum retardation, W, lies a little below the middle of the range, at about 713° C.
The V-range begins at about 679° C., and apparently ends between 645° and 674°, thus covering from about 5° to about 34°. But there are indications of further retardation at still lower points. Its point of greatest retardation, V, lies usually well above the middle of the range, on an average at 675° ; but its position varies considerably.
There is thus a distance of about 27° between Wa, the lower edge of the W-range, and Va, the upper edge of the V-range.
Distribution of the Retardations
Let us next learn how each retardation begins and ends, to what extent it is concentrated at the point of maximum retardation (V or W), and, in short, in what manner it is distributed through its range. Only a rough approximation can be made.
The distribution of the W-retardation varies greatly, while that of the V-retardation is, in one respect, much more constant. Only from 22 to 47 per cent, of the W-retardation occurs at W; always a considerable part of it, and often nearly one-third of it, takes place before W is reached, while nearly always at least one-quarter, and sometimes about half of it, occurs after W is passed.
The V-retardation, however, is to a greater degree concentrated at V itself, where at least 66 per cent., and often 90 per cent., of the total retardation occurs. Of the small remaining part of the retardation, more usually occurs below than above V.
The W-retardation usually begins suddenly; the rise of temperature slackens suddenly to a rather regular slow gait, which is kept up usually with little change until W itself is reached, when a complete and sudden arrest occurs; after this the immediately preceding slow gait is soon resumed, and accelerates gradually till the normal rate of heating is reached.
The V-retardation begins much like the W-retardation, bringing the cooling to a slow gait, which is preserved often with no important change till V itself is reached. Then the cooling is abruptly arrested, and the temperature spontaneously rises, usually by from 7° to 10°, remains stationary for from 23 to 43 seconds, and redescends to V, in general more slowly than it had risen. From V to Vb the cooling accelerates gradually and rather irregularly.
Where T max is not above W, and where T min is not below V, these relations are even more irregular, with a tendency to increase the percentage of the total retardation which occurs before the point of maximum retardation is reached.
I here tabulate these numbers :
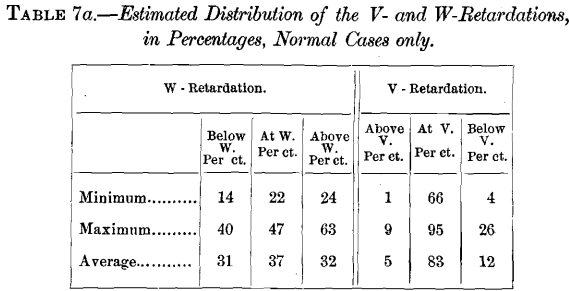
This table may understate the percentage of the total V-retardation which occurs below V, because, in addition to the retardation clearly observed below V, there are suggestions of further retardation at still lower temperatures.
On seeking to verify the prediction made in (14) as to the influence of the initial temperature on the retardations—the prediction that the amount of retardation which will occur in either phase will be proportional to that which we have permitted to occur in the preceding and opposite phase—we must first admit that the accurate correspondence which we might there have expected, now cannot be hoped for; because we have now seen that the distribution of these retardations varies much, and in a way not understood. Thus, we have seen, that at times as much as 26 per cent, of the total retardation in cooling occurs after the temperature has sunk below V, at others, only 4 per cent. Va is now but 1°, now 10° above V ; here the retardation appears to have ended completely when the temperature has descended 1° below V; there it continues till the temperature has fallen 24° below V.
Hence, when the cooling is interrupted, now before reaching Vb, now even before reaching V, we cannot readily tell where Vb or V would have been, and hence how far above them the cooling has been interrupted ; nor can we tell what the total retardation would have been, nor what proportion of it has already occurred, without a most careful record of the progress of the individual cooling. Indeed, it is not certain that such a record would furnish elements sufficient for the construction of the cooling through the still unexpired part of the V-range. For instance, had cooling No. 18 of Table 7 been interrupted at 657°, we might easily have inferred from the regularity with which it had gone on between 673° and 657°, and from the analogy of other cases, that the retardation was very nearly at an end; whereas in fact a very striking and exceptional retardation actually takes place between 657° and 655°. Let this teach caution in drawing inferences.
This admitted, let us see what rough correspondence we can detect, and let us first seek the influence of T min on the W-retardation in heating.
Influence of T min on the W-retardation
To show this, I here condense in Table 8 some numbers from Table 7 :
Here, as T min, progressively descending, appears to recede from Va and to near V (heatings 2 and 3), the W-retardation from being a mere suggestion becomes distinctly recognizable, though still slight; this agrees with our prediction, because the retardation in cooling is slight between Va and V.
As T min progressively descends slightly further (heatings 4, 5, and 6) to the beginning and end of V-retardation, W-retardation now pro-
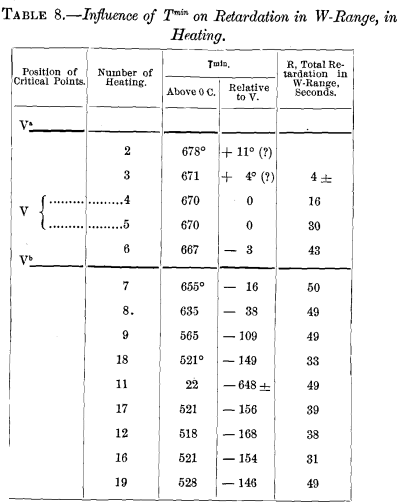
gressively increases greatly and abruptly, from about 4″ to 16″, and then to 30″ and 43″, though T min descends altogether only 7° ; this is as we should expect, because the retardation at V is very great in cooling.
As T min further descends (heating 7) towards or to Vb, we have a further considerable increase, in the W-retardation, which is as it should be, because there is in cooling a considerable retardation between V and Vb.
As T min further descends (heatings 8 and 9 of the first series, and all those of the second series) from Vb, the W-retardation does not further increase, as our prediction implies, for, in cooling, no retardation was clearly detected below Vb.
If now we compare the distribution of the retardation in cooling between the three stages of the V-range, (1) Va to V, (2) V, and (3) V to Vb with the corresponding fractions of the total retardation at W, caused by the passage of T min through those three stages, we find as close a correspondence as could be expected in view of the sources of error, and of the considerable irregularity in the distribution of the V-retardation between these three stages. Thus, from 1 to 9 per cent, of the V-retardation occurs between Va and V; and certainly not over 9 per cent, of the total W-retardation is evolved when T min (heatings 2 and 3) descends part way from Va to V. Further, on an average, 88 per cent, of the V-retardation occurs before the temperature sinks below V, and 12 per cent, during cooling from V to Vb; and correspondingly, we find that 86 per cent, of the W-retardation is caused by lowering T min to barely below V, and 14 per cent, by further lowering it to Vb.
That is to say, assuming that when, at the rate of heating here used, the W-retardation reaches its full development, it should occupy 50 seconds (and it consumes about this in heatings 7, 8, and 9), we find that the 43-second retardation in heating 6 is 86 per cent, of this, and the further increase, caused by further lowering T min, is but 14 per cent., or an increase from 43 to 50 seconds.
The force of this, however, is weakened by the fact that we have apparently much less than 50-seconds retardation in heatings 18, 17, 12, and 16; though this is doubtless due to more rapid application of heat in these four cases.
Influence of T max on the V-retardation
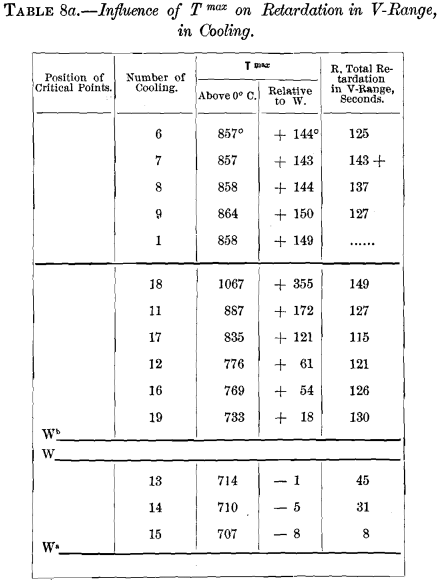
I here condense from Table 7 some numbers through which we trace this influence:
The fact that even when T max is as much as 8° below W (heating 15), there is a slight retardation in cooling, agrees with the observation that Wa is from 6° to 10° below W.
The progressive and considerable, but not sudden, increase in the V-retardation (coolings 15, 14, and 13), as T max rises towards W, harmonizes with the moderately retarded gait of heating from Wa to W. The fact that when T max has risen to within 1° of W (heating 13) the V-retardation is about one-third as great as when T max is above Wb, accords with the fact that about one-third of the total retardation of the W-range occurs below W.
The fact that, by the time that T max has risen to W + 18° (heating 19), the V-retardation has not only increased greatly, but has practically reached its maximum, remaining practically constant with further rise of T max, fulfils our prophecy, because the retardation at W is great, and because Wb is not so high as W + 18°, i.e., because we find no important retardation above W + 18° in heating.
It remains to learn how great the V-retardation is when T max lies just above W, and also at other points between W and Wb. But it is difficult to conduct the experiment in such a way as to place T max here, because when the temperature once passes W, its rise thence is so fast that it is not readily checked before the temperature has passed Wb.
(21) To sum up, while there are certain parts of the field which our experiments have not yet covered, yet, so far as they go, the effect of varying through any range of temperature the initial temperature of either phase (heating or cooling) on the retardation in that phase is roughly proportional to the retardation in that range in the opposite phase. Indeed, the correspondence is closer than we should dare to expect. This not only argues that the V- and the W-change are simply reversals of each other, no more and no less; but it also indicates that the retardation is a true if rough measure of the degree to which either change occurs in any given range.
Influence of Rate of Heating or Cooling on the Retardations
I must now point out that we might expect the position and distribution of these retardations to depend upon the rapidity with which our furnace conducts heat to or from the metal, i.e., on the rate at which we heat or cool the metal.
To fix our ideas, let us consider the change underlying the V-retardation in cooling. It apparently requires time for its completion. Assuming this for the present, the temperature to which the metal cools before this change is complete will clearly depend on how fast we cool the furnace and through it the metal. If very slowly, then the change will have time to complete itself before the temperature has descended far, and Vb will be relatively high; if somewhat faster, the temperature will have fallen farther by the time when the change has completed itself, and Vb will be relatively low. Clearly, then, if we hasten the cooling we lower Vb; and conversely the slower the cooling the higher will Vb lie. Clearly Vb will descend without limit as the cooling is accelerated, until it reaches so low a temperature that the V-change can no longer go on; in that case this change does not complete itself at all.
Clearly, also, if we have thus depressed the position of Vb by hastening the cooling, we can again raise it by cooling more slowly; but it is uncertain whether we can raise it indefinitely till it coincides with V or even with Va, or whether there is some limit below V above which we cannot raise Vb.
Theories of the Progress of the V-change
In short, we may conceive two different theories of the progress of this change: (A), that there is just a certain extent to which the V-change can complete itself at each given temperature, so that retarding the cooling would raise Vb and V to certain normal positions, above which they could not be farther raised by still slower cooling; and (B), that once the temperature has fallen to Va, which is the point at which this change can begin, the degree to which it proceeds is purely and solely a question of time; so that, were the cooling only slow enough, the whole V-change and its whole retardation would take place at Va. If the latter supposition be true, then the explanation of the recalescence might be something like this : Va is a fixed point, like the normal freezing point of water; but, just as we can cool water below its freezing point without completely freezing it, thereby rapidly increasing the strength with which the water tends to freeze, so by a relatively rapid cooling we can carry the metal considerably below V without giving the V-change time to proceed far, strengthening the while the tendency toward this change, which keeps kindling more and more till it bursts into a blaze, with such evolution of heat as actually to recoalesce, to raise the temperature of the metal by some 10°, in spite of the continued abstraction of heat by the continued cooling of the furnace.
In (47) I point out certain analogies between the phenomena here observed and those of the surfusion of saline solutions; but let me here note three considerations which point towards the second of the above theories, that the V-change and retardation would complete themselves at Va were time enough allowed.
I. —We have seen that the positions of Va and Wa are astonishingly constant, somewhat more so than those of W and Wb, and very much more so than those of V and Vb. This suggests that, while the point at which each change begins is fixed, the degree to which it proceeds at any given temperature varies with the rate of cooling. This is only suggestive.
II. —Osmond’s results indicate that V descends as the rapidity of cooling increases. In (56) I point out, however, a possible source of error in his observations. This, too, is only suggestive.
III. —Though in most coolings the V-change progresses but slightly while the temperature is first descending from Va to V (witness the faint retardation), yet clearly it is not the temperature as such that here limits the progress of this change; for during the recalescence the temperature usually rises from V to above Va, in three cases 5° or more above it; and during the whole of this rise the V-change is progressing, as is shown by the constant evolution of heat, and as our quenching tests will later prove. This consideration argues more cogently.
Inertia
This last consideration suggests that, while there is an apparently neutral zone of some 27° between Va and Wa yet in reality in cooling the V-change and in heating the W-change probably tend to set in before these limits, Va and Wa, are reached, but that this tendency is held in check by what, for lack of a better name, we may call inertia; and that perhaps by some special means we may later be able so to provoke these tendencies as to cause the V- and the W-change to set in earlier than now, i.e., that we may be able to raise Va and to lower Wa, to shorten the zone between them, and possibly even to eliminate it. Possibly by jarring, or by altering the magnetic conditions, we may thus provoke these changes.
Indeed, even in the present experiments the beginning of these retardations may have been too gradual to be detected by my measurements, and thus the actual distance between Va and Wa may be less than I have found it. As to this we must await more delicate measurements. Yet it is quite possible that the beginning is not very gradual; at least we find at the beginning of the recalescence that the retardation increases not gradually but at a great bound. Take for instance cooling No. 11, in which the rate of cooling drops abruptly from 2 seconds per 1.4° C. to 95 seconds. Lest this abruptness be charged to mal-observation, note that even at the recalescence of cooling No. 9, which probably begins more gradually than any of the others, the rate of cooling drops instantly from 7 seconds to 113 seconds per 1.4° C. (The gradual increase of the retardation in coolings 13, 14, and 15 of course does not bear on the present question.)
