Table of Contents
Instruments currently in use for routine measurement of ozone in the atmosphere are based on ultraviolet spectrometry, coulometry, or colorimetry. Studies have shown that none of these techniques is completely satisfactory for routine ozone measurement, either because the instruments require an inordinate amount of attention or because they lack the requisite specificity to ozone or because they are too expensive.
The need for a specific, sensitive, and simple method for the routine measurement of atmospheric ozone led to the development of chemiluminescence methods. The principle on which chemiluminescence methods are based is that light (chemiluminescence) is emitted when ozone reacts with certain compounds. The emitted light has a spectrum that is characteristic of the compound reacting with ozone, and its intensity is proportional to the ozone concentration.
Of the chemiluminescence ozone analyzers developed and reported, the one based on the reaction of ozone with ethylene appears relatively more promising because of its simplicity. However, no complete evaluation has been reported.
The purpose of this Bureau of Mines research was to construct and evaluate an instrument of the ethylene-ozone reaction type for use in smog-chamber studies conducted at the Bartlesville, Okla., Energy Research Center. These studies are part of a cooperative program undertaken by the Bureau of Mines and the Environmental Protection Agency in the area of pollution from fossil fuel combustion.
Experimental Procedures and Results
Chemiluminescence Detector
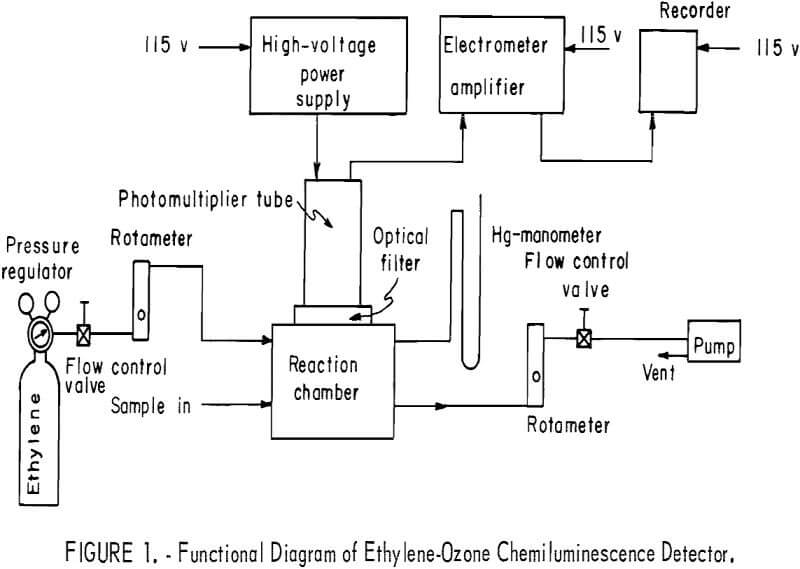
A functional diagram of the entire detector system is shown in figure 1. The sample containing ozone is drawn into a reaction chamber where it is allowed to react with ethylene; the resultant chemiluminescence is measured with a photomultiplier tube (PMT). An optical filter is used to screen out radiation that may be produced from processes other than the ozone-ethylene reaction. Flowmeters and control valves are used to monitor and control the streams of ethylene and ethylene plus sample. A pump is used to draw sample into the reaction chamber, where total pressure is kept constant.
The principal detector components the PMT, the reaction chamber, and the optical filter are shown in figure 2, a cross-sectional cutaway. The reaction chamber has a 38-cm³ capacity and is a 3- by 4-inch-OD hollow aluminum cylinder, one side of which is shaped into a hollow hemisphere of 1.5-inch diameter. The hemisphere has a highly polished internal surface for reflectivity.
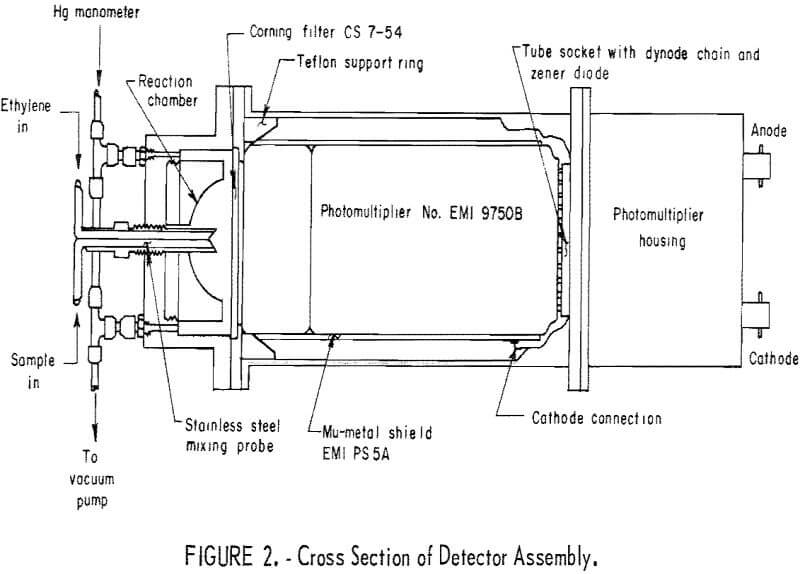
A Corning CS754 optical filter transmitting in the range of 2,300-4,200 A and above 6,900 A was available, found to be adequate, and used. However, a Corning CS497 filter transmitting in the spectral range of 3,300-6,500 A (almost identical to the spectral range of the ozone-olefin reaction chemiluminescence) was tested subsequent to this work and was found to give a higher response by a factor of about 5.
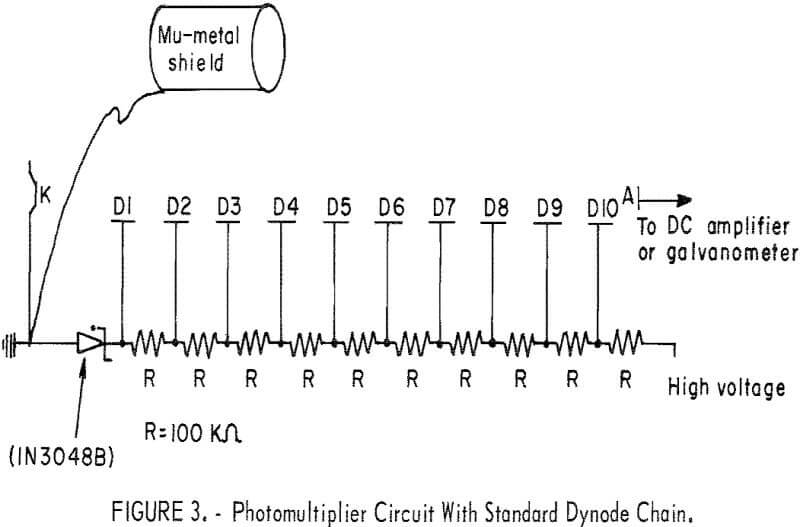
The photomultiplier tube, an EMI 9750B, was selected on the basis of sensitivity, spectral response, dark current, and price. Two comparable models, EMI 9635B and EMI 9634QR, were also considered. From manufacturers data, the 9635B is superior to the 9750B in that it shows less dark-current shot noise by one order of magnitude and higher quantum efficiency by about 10 pct. However, the 9750B was selected for application in the chemiluminescence detector because the advantages of the 9635B tube did not justify its considerably higher price. A Mu-metal shield was installed around the photomultiplier tube and kept at cathode potential to reduce the noise from stray electrostatic and electromagnetic fields near the instrument. It has been suggested that cooling of the PMT would considerably reduce dark current and noise and would make replacement tubes interchangeable. While perhaps imperative in automatic air monitoring, cooling of the PMT was not judged to be necessary for the purposes of this work.
A circuit diagram of the photomultiplier tube is shown in figure 3. In addition to these components, the detector system also uses a high voltage supply (Hewlett-Packard Harrison 6515A) and an electrometer (Victoreen VTE).
Effect of Instrument Parameters on Response
Instrument parameters believed by the authors to have significant effects on response are the PMT anode voltage, the ethylene and sample flow rates, and the pressure of the gas mixture in the reaction chamber.
Operational characteristics of the PMT indicate that the anode voltage affects gain and hence response. Therefore, an anode voltage level was sought that would give the strongest response with minimum sensitivity to voltage fluctuations. Reactant flow rates and reactor pressure were thought to be important parameters because of their effects on the kinetics of the ozone-ethylene reaction and the chemiluminescence quenching process. Thus, flow rates determine the relative levels of the two reactants in the ethylene-ozone reaction mixture as well as reaction time; that is, residence time in the reactor. Reactor pressure also affects the residence time and hence the extent of completion of the ozone-ethylene reaction. Further, residence time and reactor pressure are believed to affect the chemiluminescence quenching process. The extent of quenching depends also on the composition of the gas mixture samples; however, in air analysis, the composition of the sample is essentially fixed and need not be considered as a variable parameter.
In the light of these considerations, the objective of the instrument parameter study was to optimize the reactant flow and reactor pressure for the maximum rate of ozone-ethylene reaction and the minimum chemiluminescence quenching; it was thought that such optimization would give maximum response. Furthermore, a large excess of ethylene (relative to ozone) seemed desirable so that the ozone-ethylene reaction would become pseudo first order with regard to ozone. Under such kinetics, the fraction of ozone consumed in the reactor would be constant and independent of the initial ozone level—resulting in linear response. Also, a large excess of ethylene would favor the consumption of ozone and hence a high response.
For the instrument parameter study, an air mixture containing about 1 ppm of ozone was prepared in a 2,800-liter aluminum chamber. Loss of ozone in the chamber was measured with a Mast ozone meter and found to be about 3 pct per hour; experimental data were adjusted for such loss. When the study called for varying the level of ozone, the ozone mixture in the chamber was standardized by the 1-pct neutral KI method and by the NO-titration method. Room air passed through a charcoal column was used as zero gas. Instrument response was taken to be the difference between the signal from the ozone-carrying sample and the signal from the zero gas. When ethylene alone or sample alone was passed through the detector, there was no response.
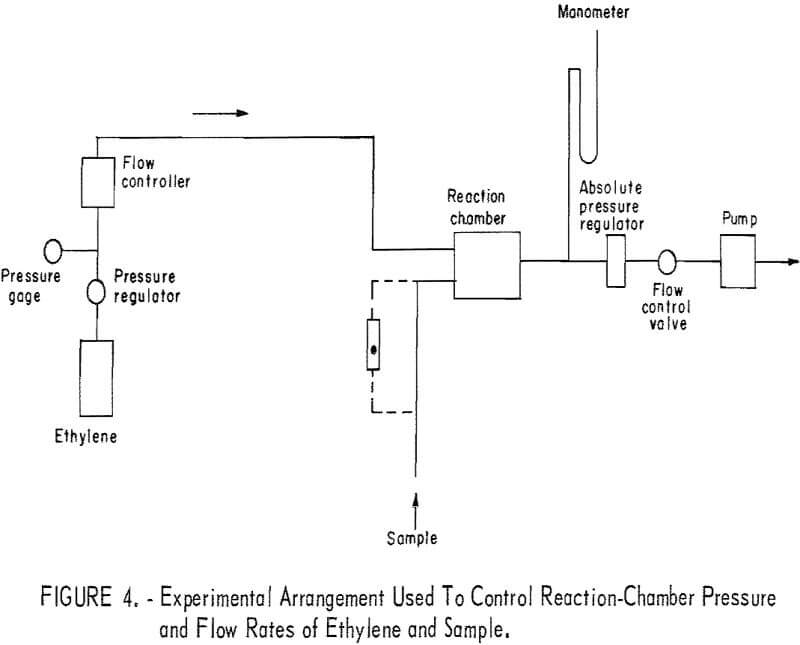
Reactor pressure and flow rates of the ethylene and the sample were controlled using the arrangement shown in figure 4. Ethylene flow was controlled using a flow controller that responded only to pressure upstream of the flow controller (and therefore independent of the downstream or reactor pressure). With this arrangement, ethylene flow rate was referred to the pressure upstream of the flow controller. Sample flow was controlled with a needle valve, and flow rate was measured with a rotameter that was replaced by Teflon tubing when the air-ozone sample was taken for measurement.
Effect of PMT Anode Voltage
The effect of anode voltage on response is shown in figure 5. The response curve is somewhat less steep than expected, suggesting some deterioration of the photomultiplier tube. The curve of figure 5 indicates that response increases monotonically with increasing voltage throughout the permissible operating voltage range for the tube. From these data, the optimum (highest response) voltage for routine operation was judged to be 1,500 volts.
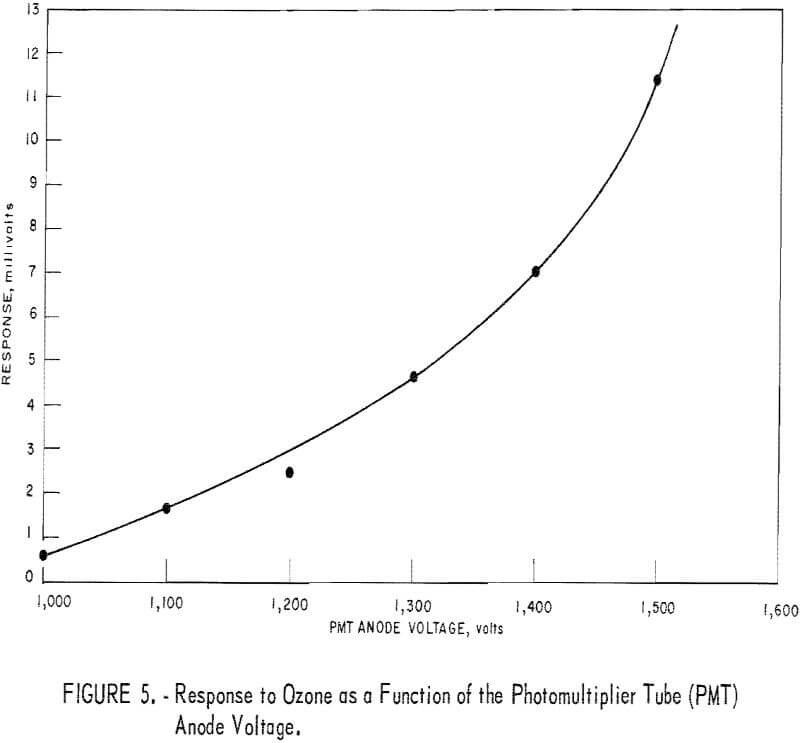
Note that this voltage point lies on the portion of the curve (fig. 5) that shows a relatively steep slope where response is sensitive to voltage variation. However, the response appears to be an exponential function of V (R = ecv) for which sensitivity to voltage fluctuation is independent of voltage level, as suggested by the equation
l/R·dR/dV = C
At any rate, no problem was noticed as a result of voltage fluctuation during several months of detector operations.
Effects of Reactor Pressure and Flow Rates of Ethylene and Sample
The effects of reactor pressure and reactant flow rate were studied by measuring the detector response to a fixed ozone level (about 1 ppm) at five levels of reactor pressure, three levels of ethylene flow, and three levels of sample flow. The results, shown in figure 6, suggest that response depends on both parameters, but in a nonuniform manner. Thus, response increased with increasing reactor pressure from about 50 to 500 mm Hg. Above this pressure level, response increased with increasing pressure only for the higher rates of reactant flow. With reactor pressure constant, increasing the sample flow rate from 500 to 1,000 cm³/min caused a substantial increase in response, although further increase of the sample flow rate had no effect. Also, increasing the ethylene flow rate had a beneficial effect only in the range 45 to 70 cm³/min. For minimum sensitivity to varying flow rate and pressure
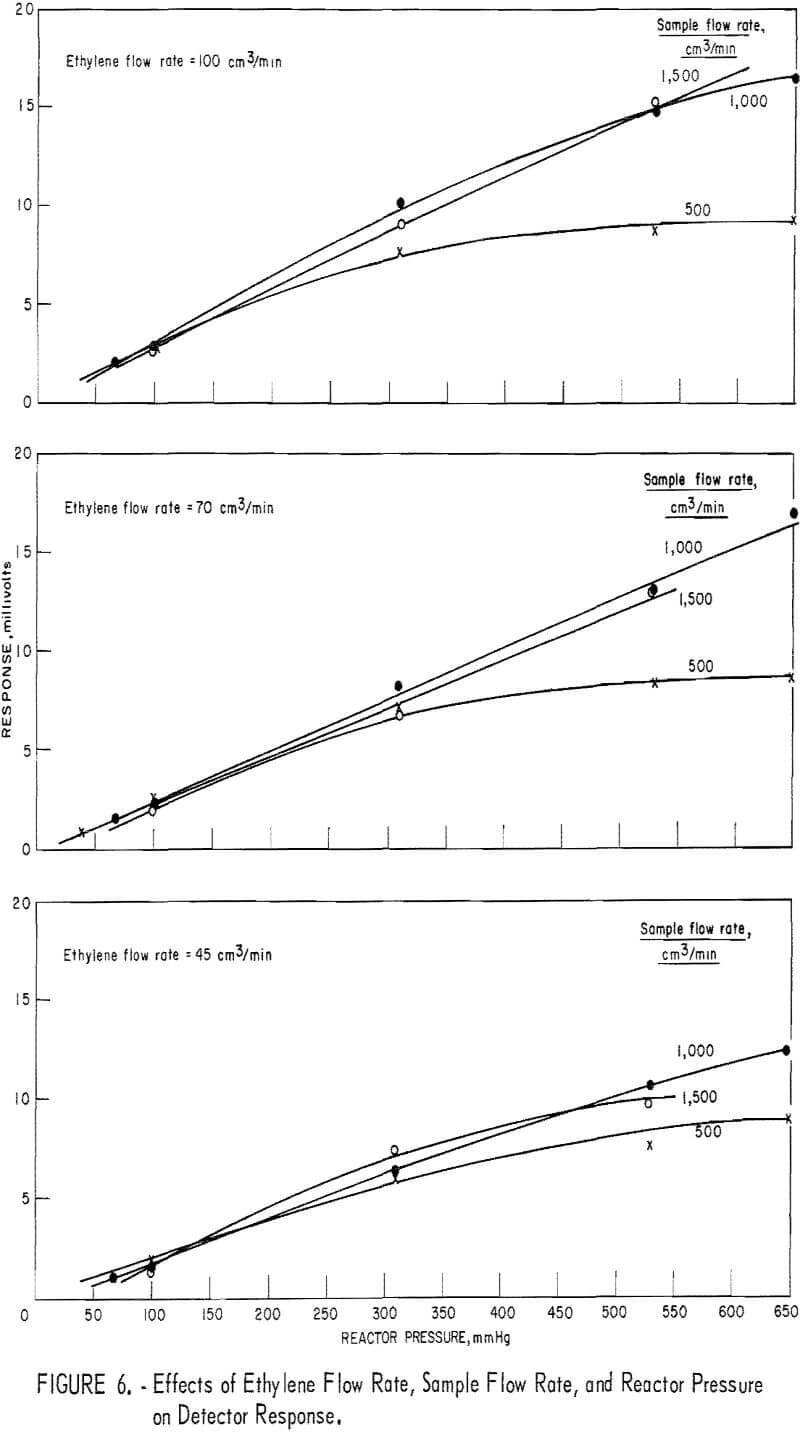
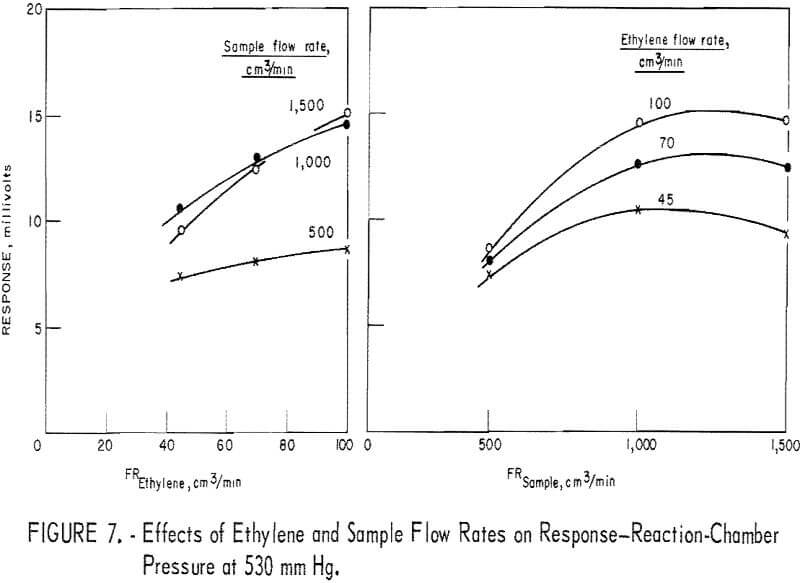
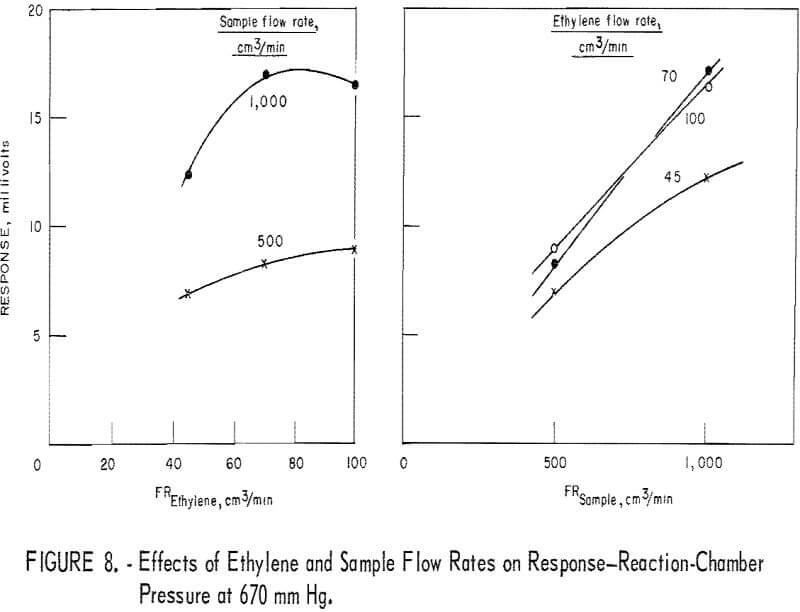
parameters (fig. 7), optimum parameter levels were judged to be as follows: A reactor pressure higher than 500 mm Hg, ethylene flow at 45 cm³/min, and sample flow at 500 cm³/min. Since, under these conditions, the response level was unacceptably low, it was found preferable to increase the ethylene to 70 cm³/min and the sample to 1,000 cm³/min. The optimum reactor pressure was increased to 670 mm Hg because response, was maximum, leak problems were minimized, and adequate driving force to draw 1,000 cm³/min of sample through the detector assembly was retained.
Figure 8 depicts the reactant flow effects on the response when the reactor pressure is 670 mm Hg. In the diagram (fig. 8) showing the sample flow effect, data for the 1,500-cm³/min level are missing because such a flow rate could not be realized at the reactor pressure of 670 mm Hg. However, judging from figures 6 and 7, one may reasonably assume that the curves of figure 8 would level off in the sample flow region of 1,000 to 1,500 cm³/min. Therefore, response sensitivity to varying sample flow rate is not as high as the curves of figure 8 suggest.
In conclusion, the following operating conditions were adopted for routine application:
PMT anode voltage……………………………….volts………. 1,500
Reactor pressure……………………………….mm Hg……….. 670
Ethylene flow rate…………………………..cm³/min…………. 70
Sample flow rate…………………………….cm³/min……… 1,000
Response Characteristics
Observed over a period of several days, the chemiluminescence detector showed a baseline drift equivalent to ±0.01 ppm ozone per hour, or less. Such
drift seemed to parallel the fluctuation of temperature around the photomultiplier tube and was attributed to temperature effect on the background current of the tube. Raising the ambient temperature by 4.7° C had no noticeable effect on the detector’s response to a sample containing 1 ppm ozone.
Noise level was equal to 0.8 pct of full-scale response in the range 0-1 ppm ozone full scale.
Response time, that is, the time to reach 95 pct of maximum response, was 30 seconds. The 30 seconds represent the composite of the time delays due to sample traveling and line conditioning.
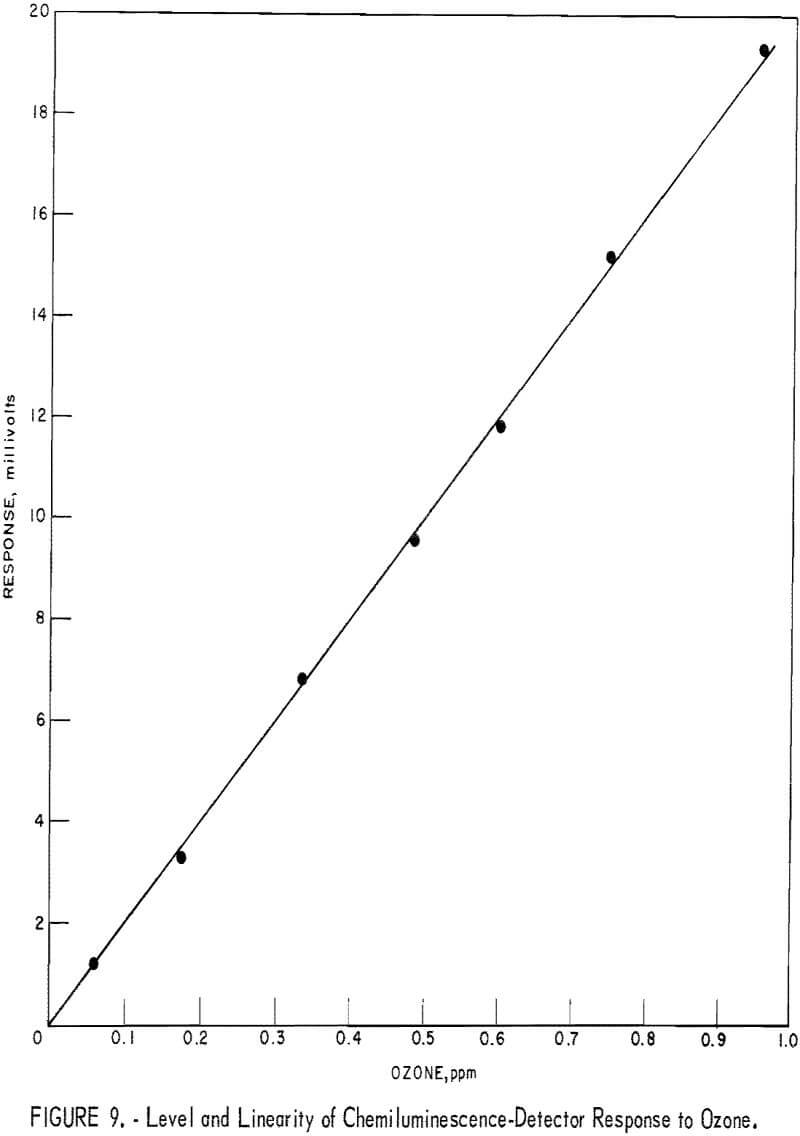
Magnitude and linearity of response to ozone are illustrated in figure 9. Detection limit, defined as one-half of the noise level, is 0.004 ppm. Results from five 4-point calibrations of the detector over a period of 6 months gave the following values for response factor (slope of straight line in figure 10 expressed in ppm/mv): 0.0508, 0.0499, 0.0502, 0.0496, and 0.0507, with average values of 0.0502 and coefficient of variation of 1.0 pct. Note that these results are based on the ozone concentration values obtained by NO titration rather than by the neutral KI method for ozone measurement. Usually the two methods gave identical ozone results in this laboratory: however, the disparity that did occur occasionally was invariably attributed to procedure failures in the more failure-prone KI method. In conclusion, from these laboratory tests it appears that with the careful control of reactant flows and reactor pressure, the response of the chemiluminescence detector to ozone is not likely to change significantly with time. Calibration every 2 weeks appeared desirable, however, to detect possible change in the power supply or photomultiplier tube. Also, it was found that the
detector should be zeroed and adjusted before each measurement to compensate for baseline drift.
Interference Effects
Tests were conducted to explore interference that might have been caused by the reaction of nonozone substances with the ethylene reagent. Interference that might have been caused by an effect on chemiluminescence quenching was not tested because the major sample components (nitrogen and oxygen) are fixed in nature and composition and, therefore, not expected to affect quenching.
The chemiluminescence detector showed no response to nitrogen dioxide (NO2), peroxyacetyl nitrate (PAN), or hydrogen peroxide (H2O2). These interference effects were measured using synthetic mixtures of air with each of these substances at 0.1 to 1.5 ppm. The NO2 was obtained by oxidizing NO with air and was measured by the Saltzman method. The PAN was synthesized from acetaldehyde, NO2, and ozone, and was measured by gas chromatography coupled with electron capture detection. The H2O2 was used at a level that caused response to a Mast ozone meter equivalent to 1.0 ppm ozone.
Nitrogen pentoxide (N2O5) for interference tests was obtained by adding 0.2 ppm NO to 0.88 ppm ozone and allowing 1 hour reaction time. Interference was judged from observations made during the 1-hour reaction. Detector response to the 0.88 ppm ozone was reduced to 0.68 ppm ozone immediately after injection of the 0.2 ppm NO, and was further reduced to 0.60 during the following 1 hour. The NO2 that was formed from the ozone-NO reaction was decreased 1 hour after the NO injection to 0.02 ppm, presumably because of almost complete conversion to N2O5. Theoretically, such conversion requires 0.20 ppm ozone for the oxidation of NO to NO2 and 0.09 ppm of additional ozone for the oxidation of NO2 to N2O5. Subtracting the 0.29 ppm ozone used in such reactions with NO from the initial ozone level of 0.88 leaves 0.59 ppm of residual ozone, almost exactly the level registered by the detector (0,60 ppm) or the end of the test. Therefore, it appears that the detector responded only to ozone and ignored both the NO2 and N2O5. The lack of response to N2O5 could be real but it could also be caused by the loss of N2O5 in the sampling line.
Comparison of Chemiluminescence-Detector, KI, and Mast Methods in Measuring Ozone in Smog-Chamber Atmospheres
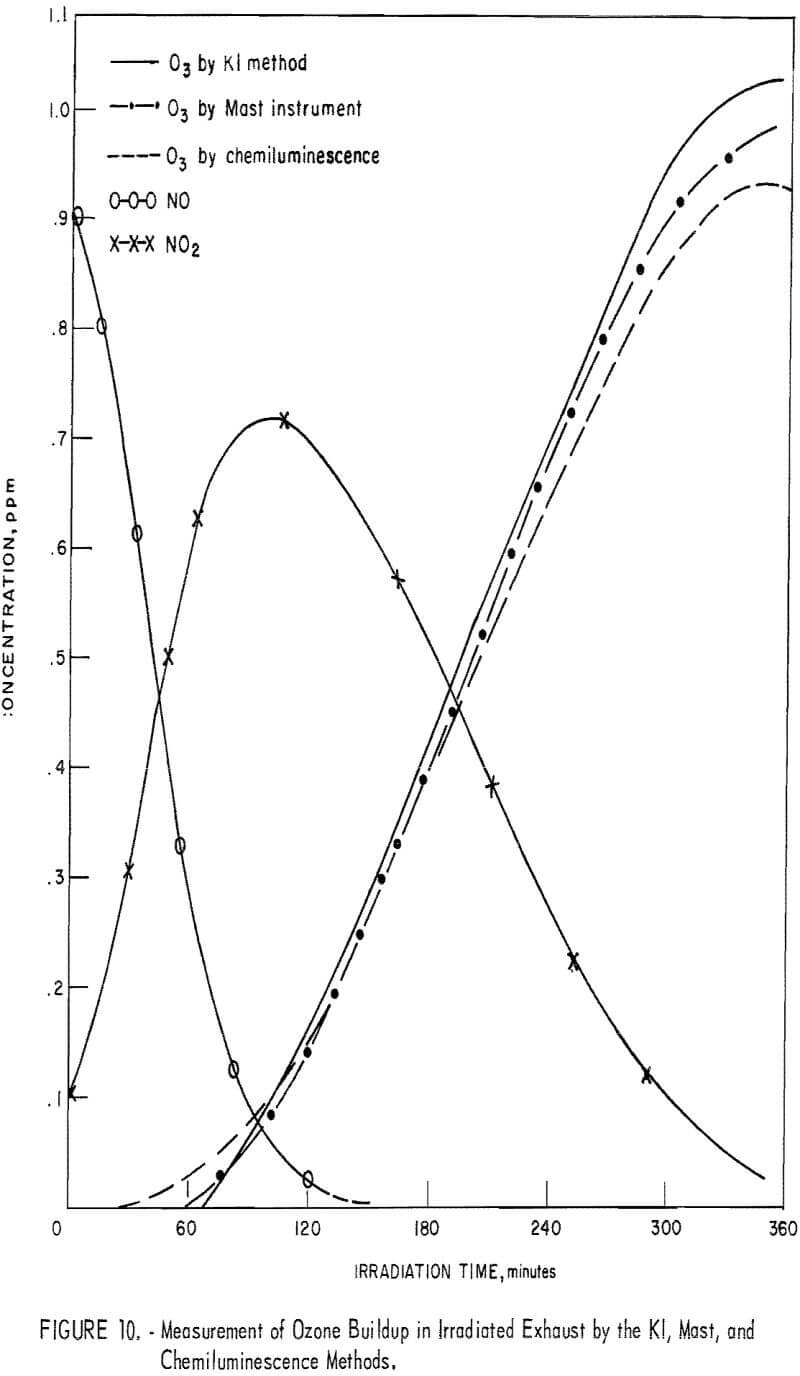
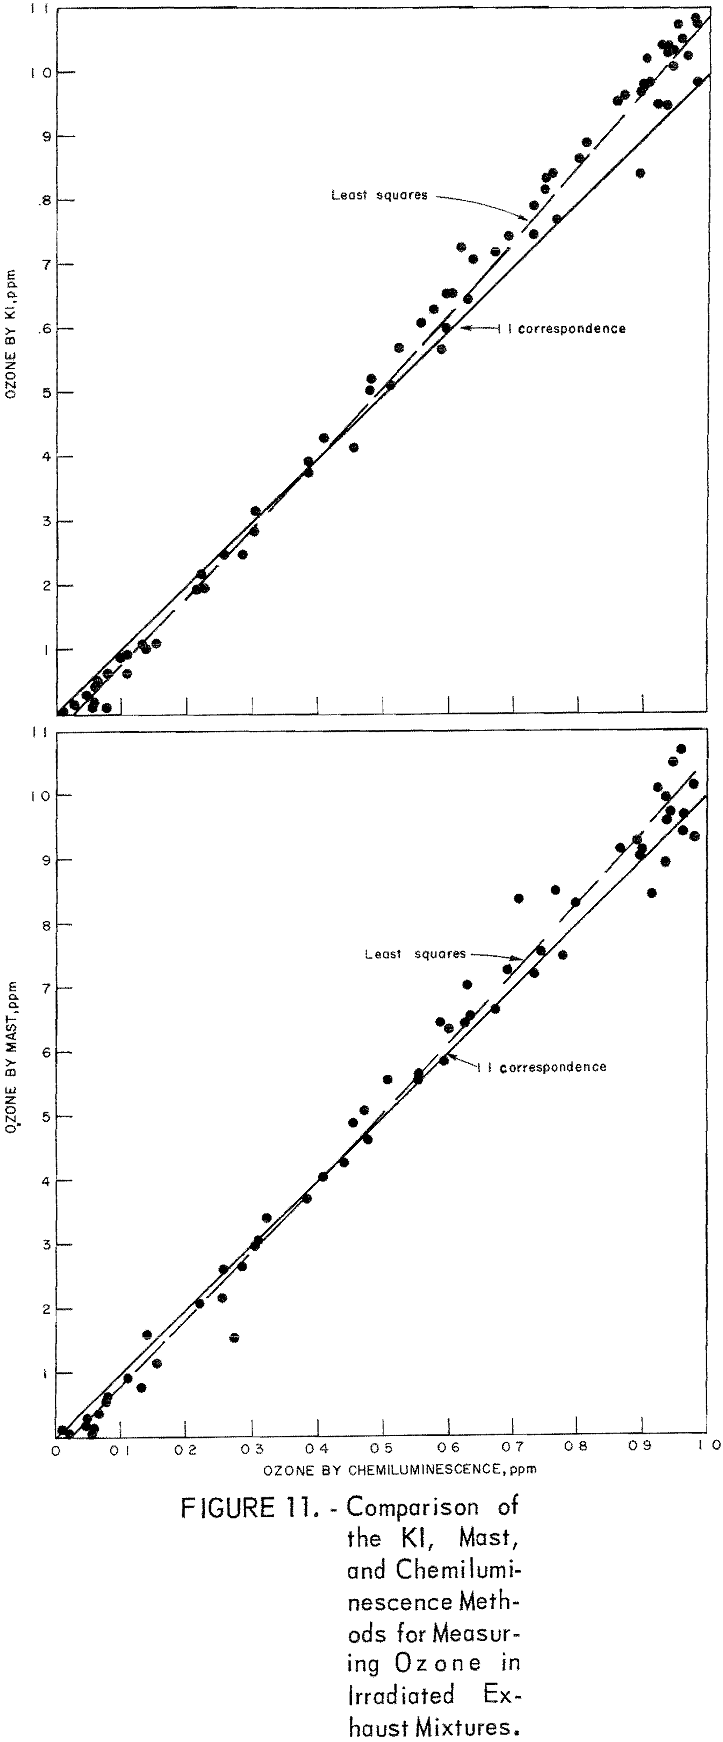
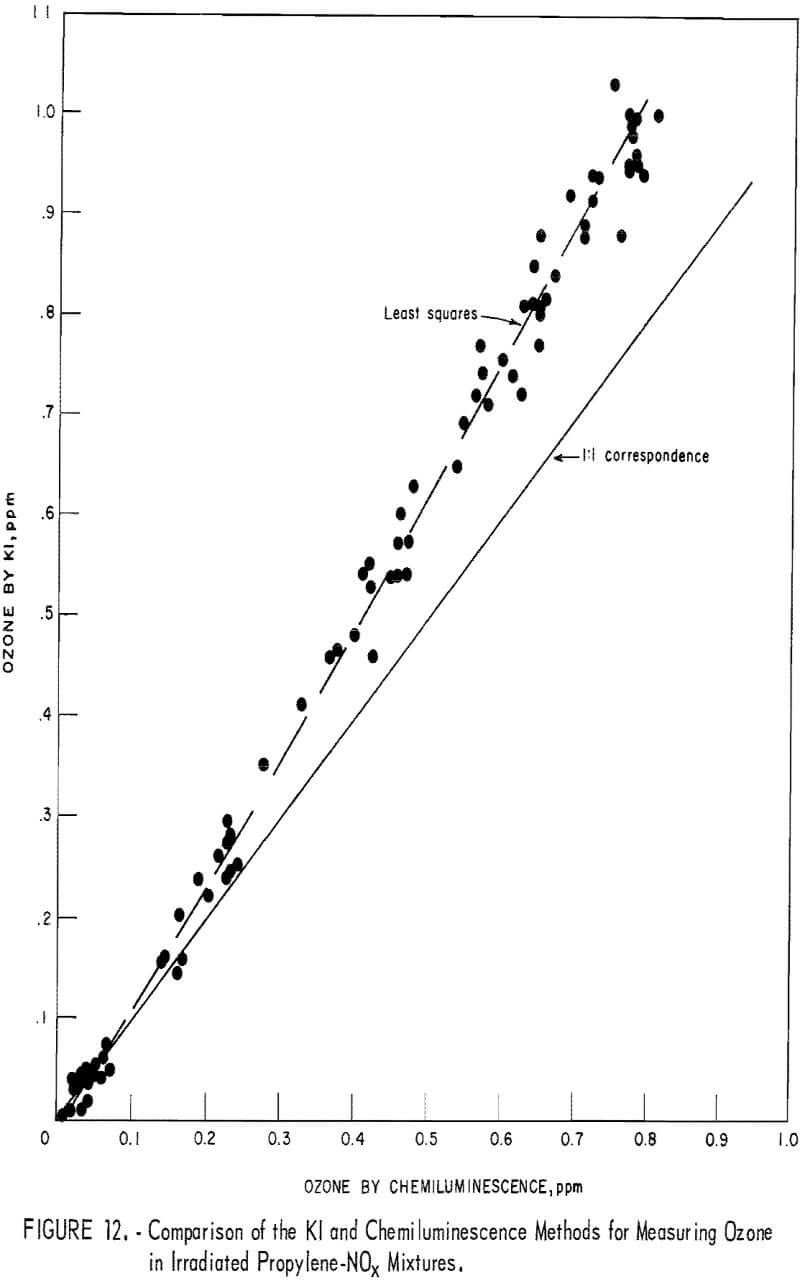
To obtain comparative data using several methods of measurement, the respective instruments were connected to a smog chamber, and ozone readings were made during the irradiation of automobile exhaust samples and of propylene-nitrogen oxide mixtures. The ozone data for the chemiluminescence instrument were then compared with those taken in parallel by the 1-pct- neutral KI and the Mast methods. Data from one exhaust irradiation test are shown graphically in figure 10. As shown, of the three methods chemiluminescence gave the highest ozone results in the early irradiation stages (first 100 minutes) and the lowest results in the later stages. This observation was verified in several exhaust irradiation tests, as shown in figure 11. A tentative explanation is that exhaust may contain traces of SO2 which persist in the early stages of the irradiation test, causing low ozone results by the Mast and KI methods, but disappear later through chemical reactions. In the later reaction stages, the KI and Mast methods gave higher ozone measurements because, unlike chemiluminescence, they respond to nonozone oxidants that form along with the ozone. In irradiated propylene-NOx mixtures, there was no difference in results in the early reaction stages (fig. 12), presumably because there was no SO2 present; in the later stages, results differed again because of the nonozone oxidants.
Discussion
The dependence of response on reagent flow rates and reactor pressure suggests that the ozone-ethylene reaction (equation 1) and the quenching process (equation 2) both have a role in determining response levels.

At low reactor pressure, quenching is apparently unimportant and response is determined by the rate of the ozone-ethylene reaction. Thus, the positive effect of pressure on the rate of the ozone-ethylene reaction, which produces the chemiluminescent species A, more than offsets the negative quenching effect, and results in an increased response with increased pressure (fig. 6). At higher reactor pressures, quenching is probably important in that it limits the accumulation of species A.
The effects of the flow rates of sample and of ethylene (figs. 7-8) on response probably have different explanations. Owing to the much lower ethylene flow rate (relative to sample flow rate), increasing the ethylene flow will cause a nearly proportional increase to the concentration of ethylene in the reacting mixture, and will exert only a small dilution effect on the ozone concentration. Therefore, the net effect will be to accelerate the ozone-ethylene reaction, resulting in a higher response (figs, 7-8). Conversely, increasing the sample flow rate will only slightly increase the ozone concentration in the reacting mixture, and will dilute the ethylene reagent, resulting therefore in a negative net effect on the ozone-ethylene reaction rate. The explanation for the observed effect of the sample flow rate (figs. 7-8) lies probably in the effect that sample flow rate has on the residence (in reactor) or reaction time. Since formation and quenching of A are consecutive processes, the concentration of A is a nonmonotonic function of reaction time, showing a maximum. Response levels then, being proportional to the concentration of A, will depend on the reaction time which, in turn, depends on the sample flow rate.
Response also depends on the extent to which ozone has reacted with ethylene in the reactor. Under the conditions adopted here for routine use, it was calculated that 9 to 17.5 pct of the ozone in the sample escaped reaction with ethylene, assuming stirred flow kinetics. Assuming batch kinetics, unreacted ozone is less than 1.5 pct.
Recently, Kummer and coworkers suggested that other olefins (or sulfides) used in lieu of ethylene may yield 50 to 200 times higher response. Kummer and coworkers arrived at this conclusion by measuring chemiluminescence emitted by ozone reacting with each of the test olefins under a fixed set of conditions. Note, however, that Rummer’s data were obtained at reactor pressures of 1/3 to 2/3 torr where the ethylene-ozone mixture, according to our study, emits much less chemiluminescence than at nearly atmospheric pressure (fig. 6). Whether high reactor pressure has the same enhancing effect on the chemiluminescence from the other olefin-ozone systems, also, is neither known nor predictable. Further, Kummer’s results raise some questions because all test olefins were tested using nearly the same reagent flow rates and reactor pressure and, hence, the same reaction time. Since maximum chemiluminescence occurs at a reaction-time moment that differs for different olefins, it follows that for more appropriate testing, reagent flow rates should have been optimized for highest response for each olefin separately. In conclusion, while it is probably correct that, relative to ethylene, certain compounds yield higher response in the ozone measurement application, more data are needed to correctly assess the relative advantages of these compounds.
Conclusion
The ethylene chemiluminescence ozone detector is judged to have performance characteristics that make it suitable for application in smog-chamber studies. Its most important advantages over available alternative methods are speed and specificity of response to ozone. The simplicity of the instrument and its operation are additional significant advantages.
