Table of Contents
In-situ Fourier transform infrared/internal reflection spectroscopy (FT-IR/IRS) has been extended to study oleate adsorption at a calcite surface. The birefringent and transmission limitations of calcite were overcome by using an appropriately designed optical setup and a near-infrared (NIR) spectrometer. An adsorption isotherm was determined at pH 9.2 and room temperature. Comparison with the fluorite/oleate adsorption isotherm determined by the same technique indicates that oleate abstraction by calcite can be as much as one order of magnitude larger than that by fluorite.
Most semisoluble salt minerals contain divalent cations, frequently calcium. Corresponding anions are predominantly simple halides like fluoride and chloride or complex oxy-anions such as carbonate, sulfate, tungstate, and phosphate. Examples of such minerals include calcite [CaCO3], fluorite [CaF2], gypsum [CaSO4·H2O], scheelite [CaWO4], and apatite [Ca5(PO4)3X, where X = Cl, F or OH].
In-Situ FT-IR/IRS Background
Shown in Figure 1 is a schematic representation of light undergoing total internal reflection in a parallelepiped-shaped
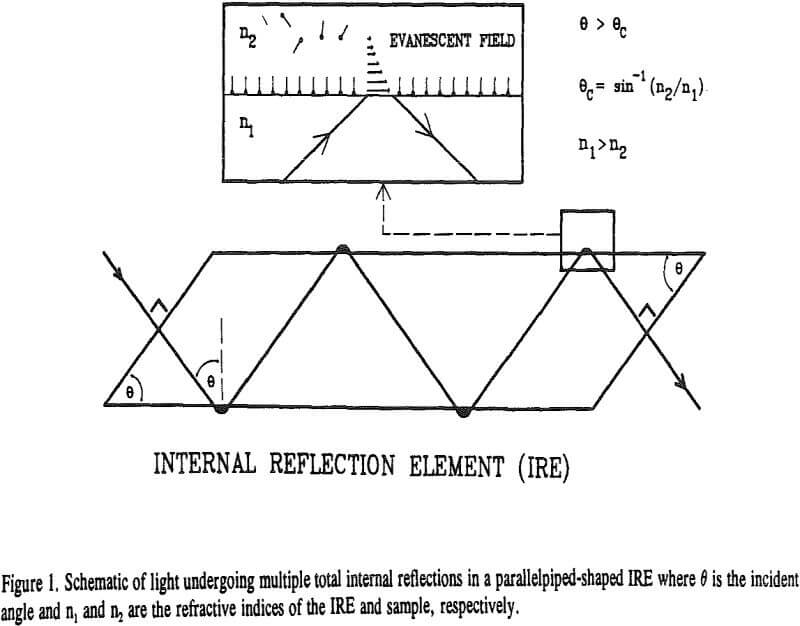
internal reflection element (IRE). Two requirements must be met before this can happen. First, the IRE must be optically denser, that is, have a higher refractive index than the sample (n1 > n2). Second, the incident angle of the light beam in the IRE must be greater than a critical angle as determined by Snell’s law (θ > θc).

Where A = integrated area of the infrared absorbance region
N = number of internal reflections = (l/t)cotθ…………………………………………………………(2)
l = length of IRE in contact with solution
t = IRE thickness
ε = molar adsorptivity of the infrared absorbance region
de = effective depth = (n21Eo²dp)/(2cosθ)…………………………………………………………….(3)
Cb = bulk concentration
dp = depth of penetration = λ/[2πn1(sin²θ-n21²)½]………………………………………………(4)
λ = average wavelength in the infrared absorbance region
Eo = electric field amplitude
n21 = n2/n1 = ratio of the sample and IRE refractive indices
Adsorption densities were calculated from real-time spectra for oleate adsorbed by fluorite and dodecylsulfate adsorbed by alumina. Based on the kinetics of the adsorption process, equilibrium adsorption isotherms were then determined.
Use of the in-situ FT-IR/IRS technique was the first time in which both variables were established simultaneously by experimentation.
In-Situ FT-NIR/IRS Procedure
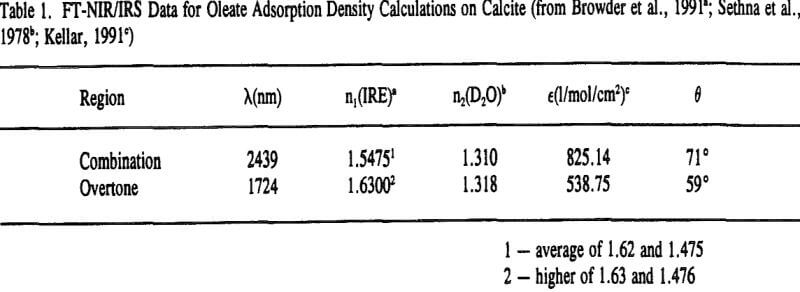
Calcite IREs were prepared from a large, optically-pure, natural specimen of Iceland Spar (Mexico) purchased from Ward’s Natural Science Establishment, Inc. The IREs were cut into the approximate dimensions of 50 x 10 x 1-mm using a Buehler Isomet low-speed diamond saw. The calcite IREs were then polished at angles of either 710 or 59° which were confirmed using a Rame-Hart model 100-07-00 goniometer.
Once cut, the calcite IREs were polished with a series of powders obtained from Harrick Scientific Corporation. The powders ranged in size from 400 grit to 0.1 microns. The calcite IREs were then acid-polished with a very dilute solution of Mallinckrodt nitric acid (HNO3), prepared with 18 MΩ water. This step removed the tiny imperfections that developed during the cutting and powder-polishing procedures and therefore yielded an optically smooth surface.
Spectra Collection
NIR spectra were recorded with a Bio-Rad Digilab Division FTS-40N spectrometer and 3240 Data Station. Optics included a tungsten filament source and a quartz beamsplitter. A DSK Controller VI was employed to protect the FT-NIR spectrometer from transient voltage surges and to act as a noise filter to clean up noise harmonics. Additional surge protection was provided in the electrical outlet. Further checks on the electrical circuits showed the FT-NIR spectrometer to be the only instrument on-line.
Because quite narrow regions were being monitored through the use of these LP and NBP filters, resulting inter- ferograms were broad and appeared similar to a single cosine wave. The gain-ranging radius (GRR) was therefore increased from a standard value of 40 to 120 and the noise level value (NLV) was decreased from 0.1 to 0.005. The GRR change was made so that the amplification factor of 16 would only be applied to the wings of the inter-ferogram and not to portions within the specified radius of the centerburst.
Vacuum Flotation Procedure
Various solutions were prepared with 195 ml of 18 MΩ water at pH 9.2 in 250-ml flasks and sparged with either oxygen or nitrogen gas for two hours. The sparger was then lifted above the solution while 5 ml of an oleate stock solution at pH 9.2 was added to bring the oleate concentration to a specified value.
Contact Angle Procedure
Calcite and fluorite IREs were used for the contact angle measurements and were therefore cleaned with the water/acetone/methanol washings and the argon plasma used in the in-situ FT-NIR/IRS study. Oleate solutions were prepared the same way as the flotation experiments except, in this case, a Teflon stir-bar and a Corning Hot Plate Stirrer were used to stir and elevate the temperature when needed.
MLRS Procedure
Vacuum flotation procedures were followed. However, experience with the MLRS technique dictated that high surface area samples were required. BET analysis showed freshly ground -400 mesh (-37 µm) Iceland Spar to be 0.83 m²/g and calcite precipitate (PfiCarb M from Pfizer) to be 1.91 m²/g. Synthetic fluorite from Alfa Products of Morton Thiokol, Inc. at 8.6 m²/g and -37 µm fluorite from Optovac, Inc. at 1.21 m²/g were also used. No difference was observed for oleate adsorption at either of the calcite samples or at either of the fluorite samples.
Spectral Collection
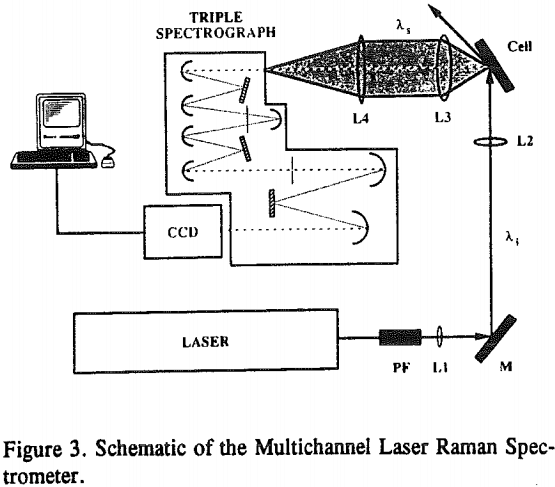
Laser Raman spectra were collected with the apparatus shown in Figure 3. The state-of-the-art spectrometer consists of an argon ion laser to excite the sample into a Raman-active state, a plasma-line filter (PF) to remove plasma lines and thereby produce monochromatic light of wavelength λi, excitation optics (a mirror, M, and focussing lenses, L1 and L2) to guide the laser light to the sample, collection optics (camera and focussing lenses, L2 and L3) to collect the Raman signals at 90° to the sample surface and focus the Raman signals (λs) on the entrance slit to the triple spectrograph, a triple spectrograph to disperse the Raman scatter and thereby remove the Rayleigh scatter with a system of mirrors, slits and gratings, a charge-coupled device (CCD) to detect the Raman signals, and finally a computer to operate the CCD camera and process the data.
Surface Tensiometry Procedure
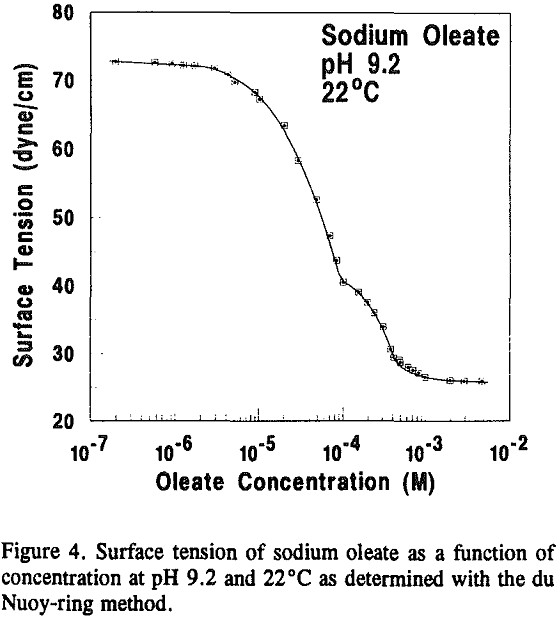
Equilibrium oleate concentrations for both the vacuum flotation and MLRS experiments were determined from surface tension measurements using a Kruss K10T Digital Tensiometer and the du Nouy-ring method. The platinum ring was cleaned with IR-grade acetone (Mallinckrodt) and heated with a Bunsen burner prior to every measurement. All solutions were filtered with Whatman 3 qualitative filter paper. Blank tests showed the filter paper did not influence the results.
Results and Discussion
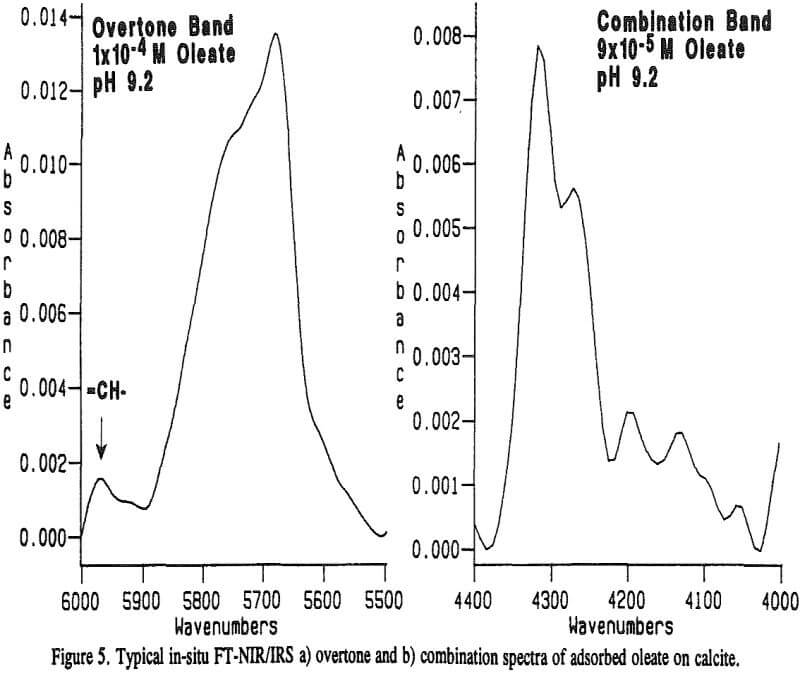
Typical in-situ FT-NIR/IRS spectra of the overtone and combination regions of adsorbed oleate on calcite are shown in Figure 5a and 5b, respectively. These spectra were obtained at about the same concentration after approximately 10 hours of equilibration. Although the molar absorptivity for the overtone is lower (see Table 1), the absorbance scale, and hence the integrated absorbance, for the overtone spectrum is higher.

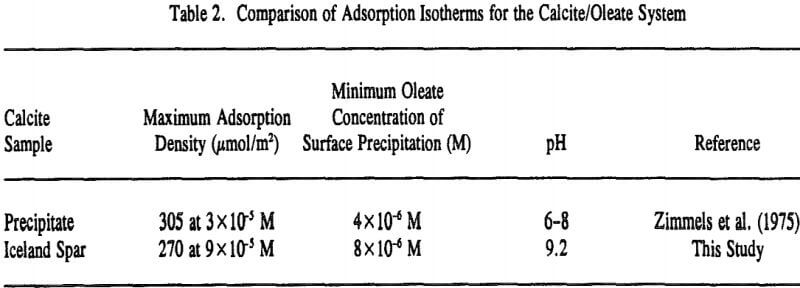
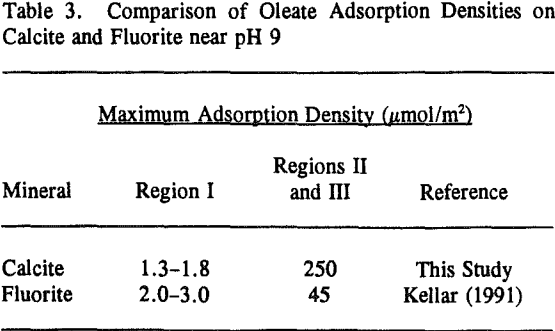
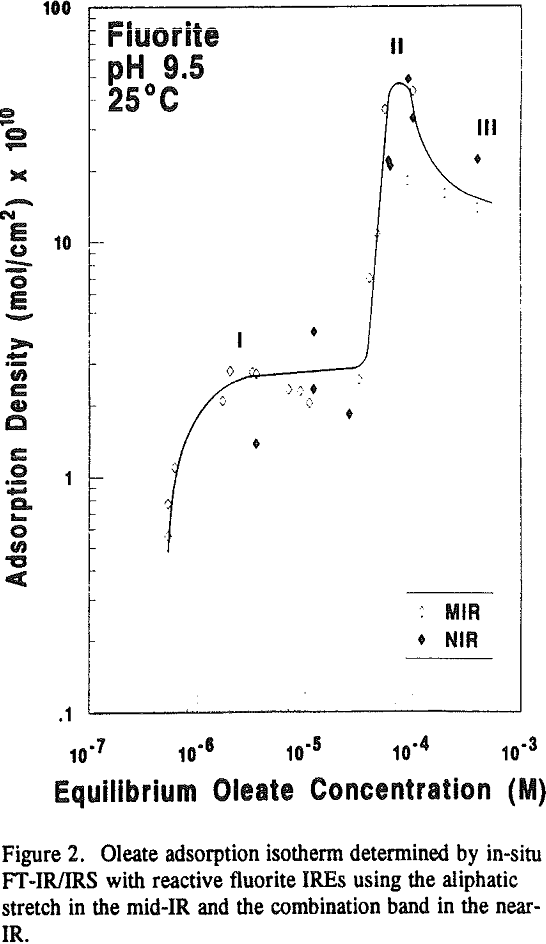
Because fluorite and calcite have the same solubility of 0.0014 grams per 100 ml of water (Browder et al., 1991), the extent of surface precipitation in Regions II and III would be expected to be similar as well. However, as depicted in Table 3, a comparison of the two isotherms clearly shows that calcium dioleate surface precipitation is nearly six times more extensive on calcite than on fluorite and appears to be inversely related to the amount of chemisorption in Region I.
Flotation and Contact Angle
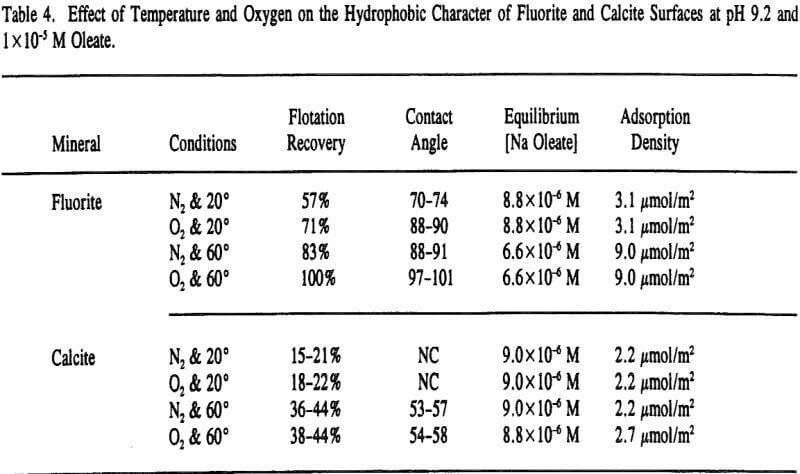
Vacuum flotation recoveries and contact angle measurements were conducted at pH 9.2 and various oleate concentrations to examine the effect of temperature and oxygen. At higher concentrations of oleate (> 1 x 10 -4 M), the hydrophobic character of both mineral surfaces appeared to be independent of temperature and oxygen content with both minerals yielding 100% recoveries.
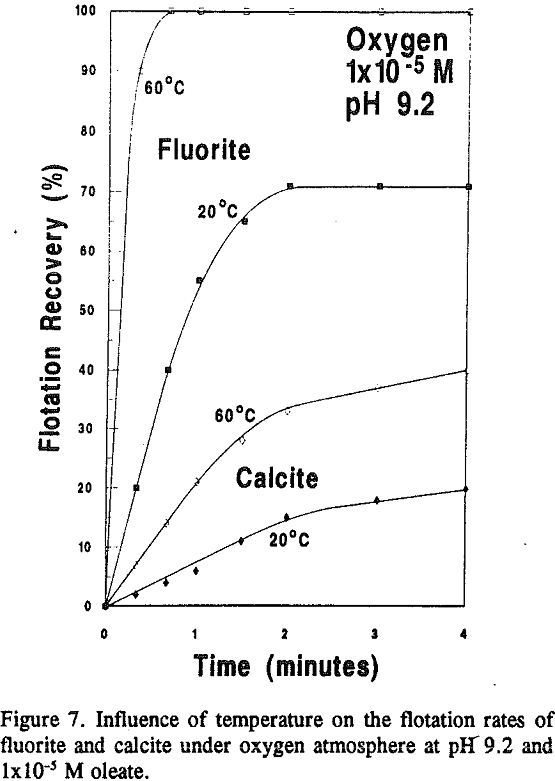
From visual estimations of mineral recovery in the vacuum flotation cell as a function of time (and corrected to the actual response after 4 minutes), it became evident that separation efficiency was time dependent thereby suggesting that fluorite flotation from calcite is kinetically controlled (see Figure 7). The fast flotation response of fluorite is indicative of its high contact angles and high chemisorption densities.
Multichannel Laser Raman
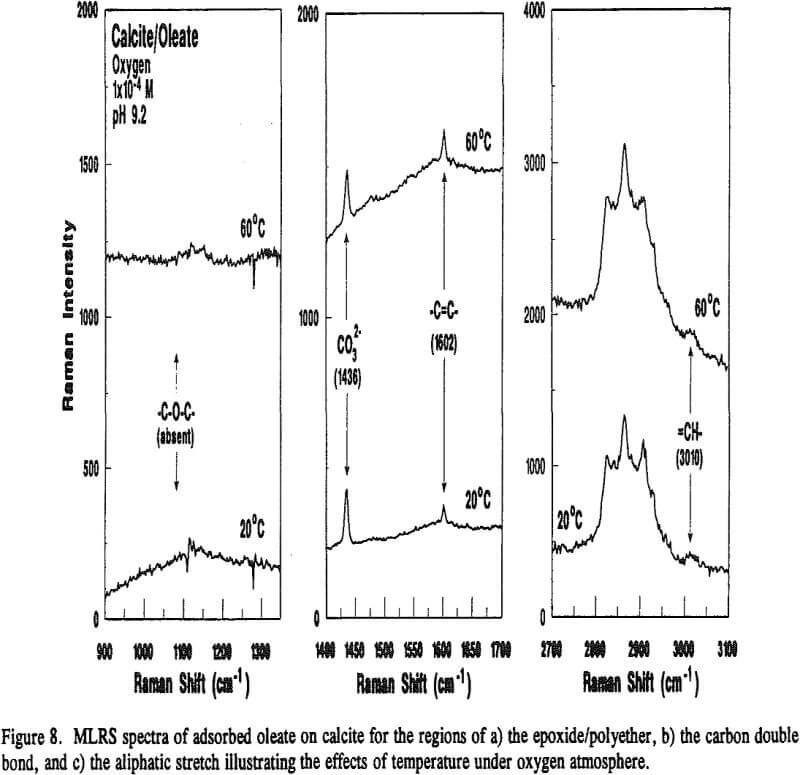
Because calcite and fluorite are respectively opaque below 3000 and 1200 cm-¹, the in-situ FT-IR/IRS technique with reactive IREs could not be used to detect the appearance of epoxide/polyether bands. However, Raman spectroscopy, can. With this technique, very intense monochromatic radiation (λi) from a laser is absorbed by molecular or atomic orbitals causing electrons to become excited. When the electron relaxes back to a vibrational level in the ground state, photons of various wavelengths are emitted.
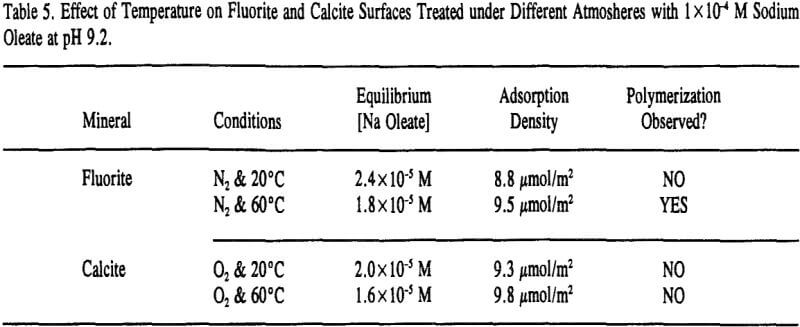
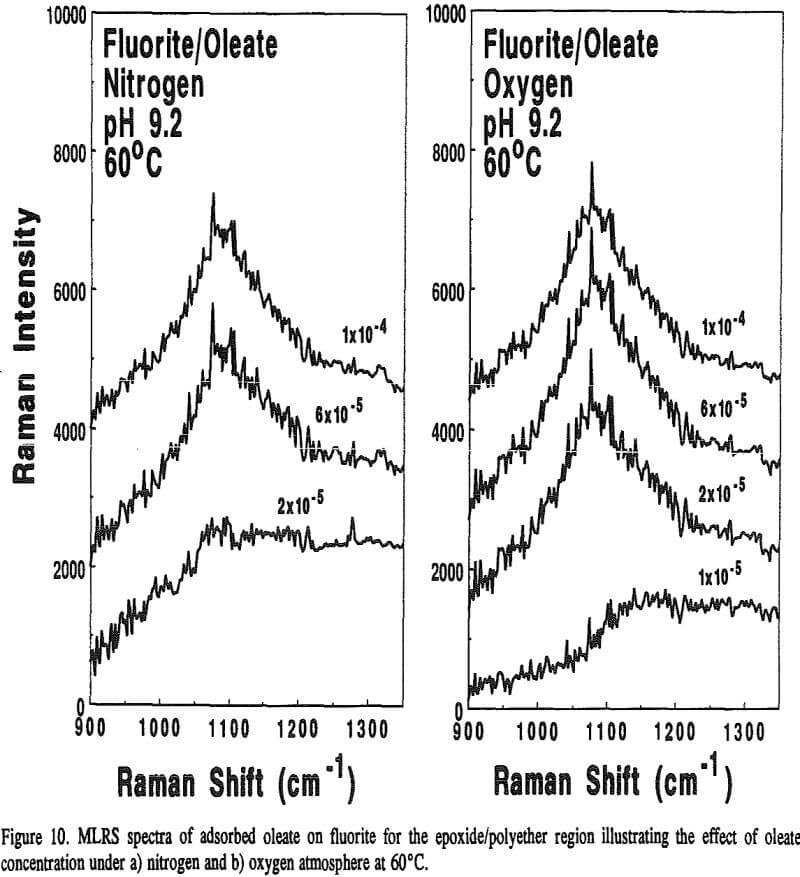
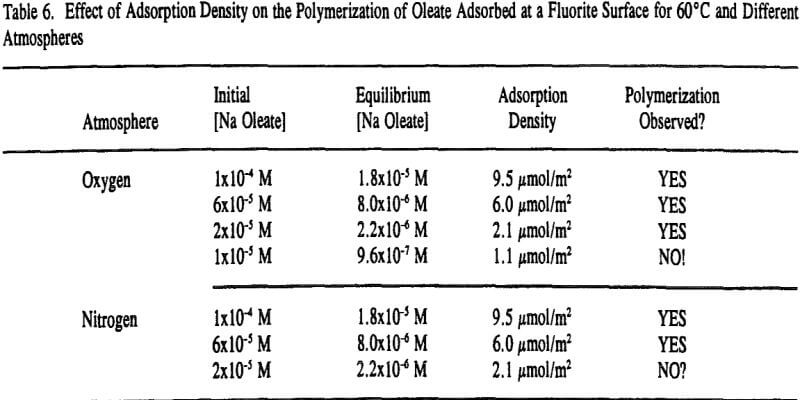
On the other hand, adsorbed oleate at the fluorite surface underwent a polymerization reaction because both the =CH- and -C=C- bands disappeared and the epoxide/polyether band appeared as revealed in Figure 9. Surprisingly, this was evident on the fluorite sample prepared at 60°C under a nitrogen atmosphere which could explain why the flotation response of fluorite under this condition was better than oxygen at room temperature as described earlier in Table 4. It seems the oxygen content ( = 0.001 atm) was not low enough to prevent the polymerization reaction.

Conclusions
Investigations using the in-situ FT-IR/IRS technique with reactive IREs was extended to calcite surfaces but required the use of an FT-NIR spectrometer. Adsorbed oleate FT-NIR/IRS spectra in the overtone (5600-6000 cm-¹) and combination (3900-4400 cm-¹) regions were obtained and used to calculate adsorption isotherms at various equilibrium oleate concentrations ranging from 1×10 -6 to 2×10-³ M.

Related: Best Laser Engraving Machines
