Table of Contents
The major conclusion to be drawn from the four series of tests is that reasonable care in preparing specimens and conducting compression tests on a hydraulic machine will provide an acceptable compressive strength value for most applications. For normal uniaxial compression tests, nonparallel ends, end surface texture, steel false end platens, and spherical head friction have only minor influence.
The influence of nonparallel ends is small enough to allow rigid head testing up to an angle of 8 minutes; an adjusting head should be used for greater angles. The adjusting head is effective to at least 15 minutes of non-parallelism without affecting the apparent strength or creating a large standard deviation.
The condition of the ends of a specimen appears to affect compressive strength and fracture pattern if the surface texture variation is greater than 0.001 inch. The surface waviness is more critical than roughness since it controls the amount of contact area.
Contact with the specimen either by smooth steel false end platens of different diameter or thicknesses or by a concentrically grooved platen does not measurably alter the resulting compressive strength if the ASTM requirements for platen design are followed. Since thickness of end platen is not an important variable, the center of the specimen face need not be coincident with the center of the spherical head. However, concentric alinement of the vertical axes of the spherical head and specimen is still recommended.
Spherical head action is also limited in its importance to initial alinement of specimen and loading head. Once alinement to less than 8 minutes of nonparallelism is accomplished, the spherical head can be fixed by clamping or by ball friction without statistically altering the results.
These specifications and remarks apply only to compressive strength determination and not to the reproduction and study of uniform strain fields.
Attempts to define detailed stress-strain relationships during loading and breaking of laboratory models of short rock pillars in compression led to the investigation of end conditions reported here. Neither Balla’s theoretical solution of stress-strain distribution in a cylinder nor Relton’s work on Young’s modulus could be adequately verified. Analysis of the preliminary test data indicated a need for better control of the mechanical procedures of testing.
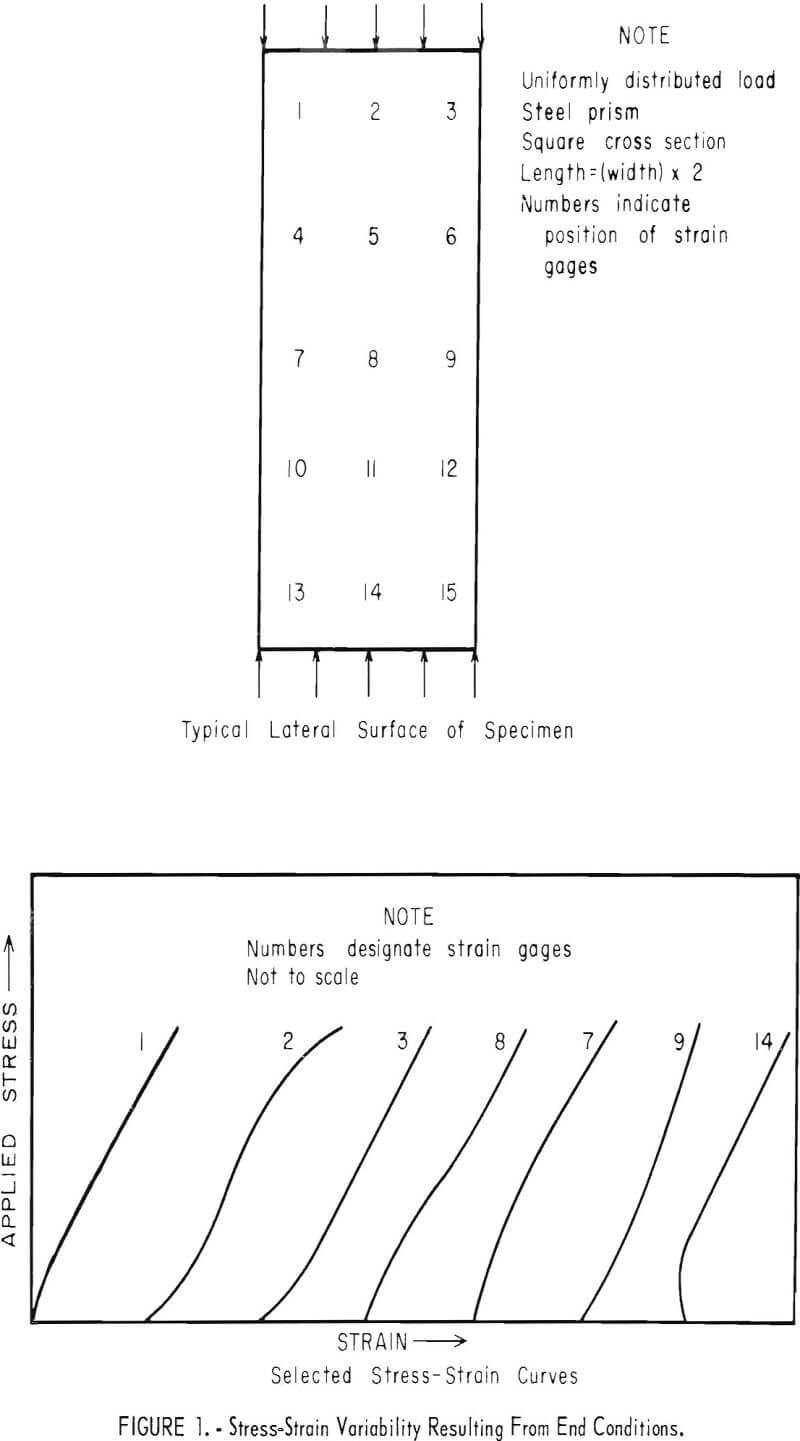
Although procedures for compression testing of concrete are given in detail in the ASTM Standards, the standards for rock testing are still being formulated by a subcommittee. Those available are very useful generally, although not definitive enough for purposes of preventing nonuniform model or specimen strain. The stress-strain curves shown in figure 1, exaggerated for purposes of illustration, were obtained from one face of a uniformly loaded steel prism. The distortion from a straight line, which was as much as 10 percent of the total strain for center gages and up to 30 per-cent for corner gages, was due to testing variables referred to here as end conditions.
The recorded strain of a specimen loaded in compression is a measure of the material properties of Young’s modulus and Poisson’s ratio, but it is influenced by many factors. The measured compressive strength is most influenced by end constraint due to the physical property differences between the end platen and specimen. This influence has been well documented by Hansen, Newman and LaChance, and Seldenrath. The practice of keeping the length of the specimen equal to twice its diameter is impossible in studying short pillars. The effects of spherical head bending, described by Hansen and Rusch; spherical head position, described by Gonnerman; and spherical head friction and size, described by L’Hermite and Tarrant, have not been adequately determined for the accurate strain measurements desired. Other end conditions such as testing machine influence, investigated by Wright, and nonparallelism effects, described by Paquin, are also thought to be responsible for large errors, particularly in short column loading.
The specific end conditions studied in this investigation were (1) non-parallelism of specimen ends, (2) surface texture of specimen ends, (3) the effect of the spherical head, and (4) the influence of the steel platen in contact with the specimen ends. This report gives the results of a preliminary investigation of their influence on compressive strength only.
Following a general presentation of specimen preparation, the studies of nonparallelism and specimen end surface texture are discussed. This discussion is followed by a section on the effects of the end platen and the spherical head. In each section, experimental procedure, data and analysis, and results are given independently. All conclusions are presented in the final section.
Sample Preparation And Testing Procedure
Blocks of the test rocks were diamond-core-drilled. Cores were then cut to approximate length, and the ends were surface-finished with a grinder. The final size was 2-1/8 inches in diameter by 4-¼ inches in length, measured to 0.001 of an inch length tolerance. Perpendicular tolerance of the end planes to the axis of specimen was 1 degree. Nonparallel ends were produced by placing appropriate shims under the specimen holder. The different surface textures on the ends were produced by varying the speed of grinder crossfeed and wheel dressing. Except for the test of surface texture, end surfaces were finished to a surface variation of less than 200 microinches using the technique given by Horino. All specimens were air dried at room temperature a minimum of 30 days for granite and 90 days for limestone, marble, and sandstone.
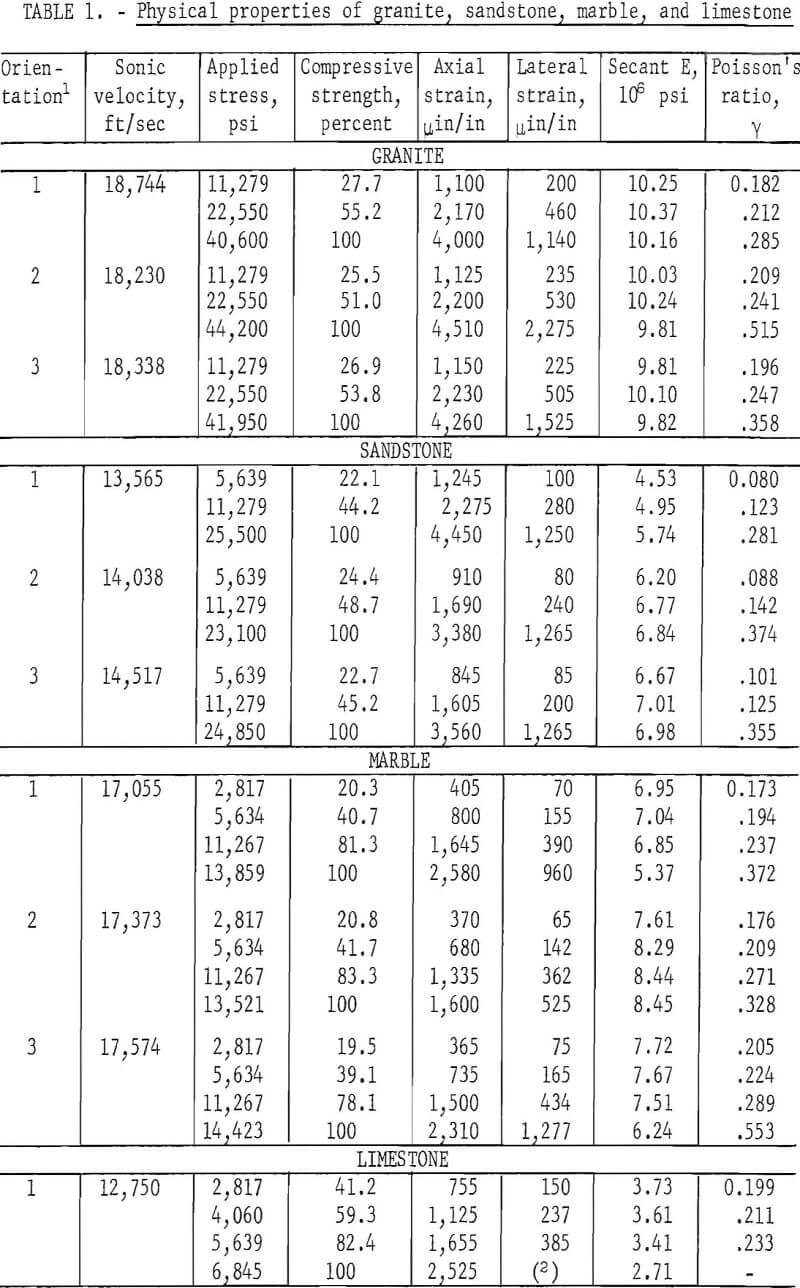
Poisson’s ratio and Young’s modulus of elasticity were determined in three directions for each rock type except limestone, (See footnote 1, table 1.) Continuous recordings of axial and lateral strain were made until specimen failure. Three electrical resistance strain gages were bonded horizontally at 120° intervals around the specimen at its midpoint. These were connected in series to provide an average horizontal strain. A similar vertical arrangement provided an average vertical strain. The modulus of elasticity and Poisson’s ratios for the four rock types ranged from approximately 2.5 x 10 6 to 10 x 10 6 psi and from 0.08 to 0.55 respectively. A Poisson’s ratio greater than 0.50 has been explained by Walsh as a crack formation phenomena. Sonic velocity for each of the three directions in each rock type was also determined for the unloaded specimen. A maximum velocity change of approximately 7 percent was attributable to bedding. The physical property data from the tests are given in table 1.
Testing procedures such as number and selection of specimens, control of moisture, positioning of specimen, and rate of loading followed those given by Obert. A preload of 5 percent of estimated compressive strength was used to provide proper spherical head adjustment and centering. Three different hydraulic machines were used with calibration checks before and after the test series. The calibration error was less than 1 percent.
Inherent nonparallelism of upper and lower loading-machine heads was determined to be 0.001 inch for all three hydraulic machines.
Specimen Variables
The purpose of the tests was to determine the influence of nonparallel specimen ends and poorly prepared or rough specimen end surfaces on measured compressive strength. Smooth hardened steel end platens were used in all tests. It was anticipated that the test results would be applicable to laboratory model and field testing.
Nonparallel Ends
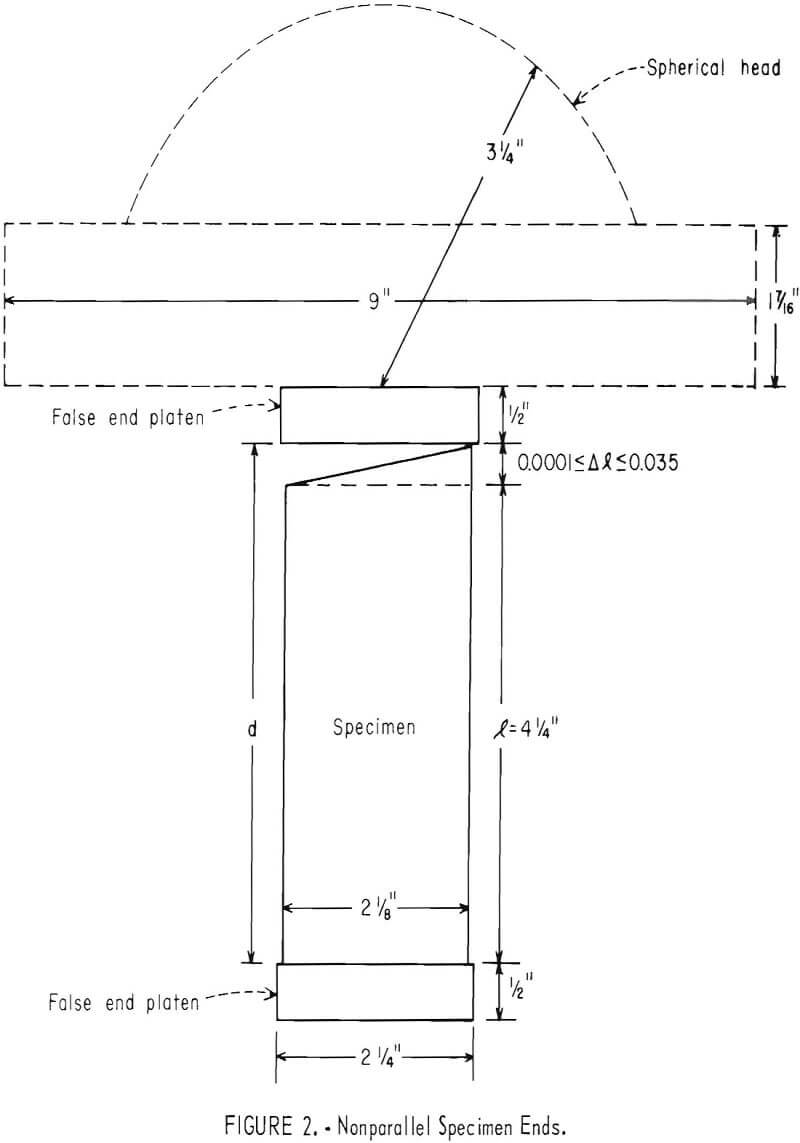
Figure 2 is a schematic representation of the specimen with nonparallel ends in which the nonparallelism was varied in increments of 0.001 inch from 0 to 0.035 inch. Approximately 100 specimens of each rock type were prepared for this test. Half of each group was broken using an adjustable or spherical head, and the rest were broken using a fixed or nonadjustable flat head. Measurements were taken to determine the adjustment of the end platens (distance d and l + Δl in fig 2). The distance d is the minimum distance between steel platens after specimen is loaded to two-thirds of ultimate load. The difference (l + Δl) -d for an adjustable head test was always within the limit of Δl ±0.001 inch. This indicated that the original testing machine nonparallelism of 0.001 inch was constant throughout the test and that all bearing surfaces were contacting. This was not true for the nonadjustable head tests. During the latter (l + Δl) -d was greater than 0.001 inch but never exceeded 0.004 inch. This measurement indicated that the load was not uniformly distributed during a test and that bearing surfaces were contacting only at the specimen high point. A check of the testing machines again showed the upper and lower heads to be alined to within 0.001 inch of parallel in 8 inches; this condition was constant during the entire load cycle.
The results of breaking 375 samples of four rock types are shown in figure 3. Examination of the graphs shows no apparent effect on compressive strength and scatter of data for either head due to nonparallelism up to approximately 0.005 inch. A Δl of 0.005 inch in 2-1/8 inches is an angle of about 8 minutes. A spherical head gave equally good results on parallel ends or nonparallel ends up to a of 0.010 inch in 2-1/8 inches or an angle of 15 minutes which is used as the cutoff point in this report, because data are limited for higher angles. For a taper greater than 0.005 inch in 2-1/8 inches, the measured compressive strength using the flat head decreased
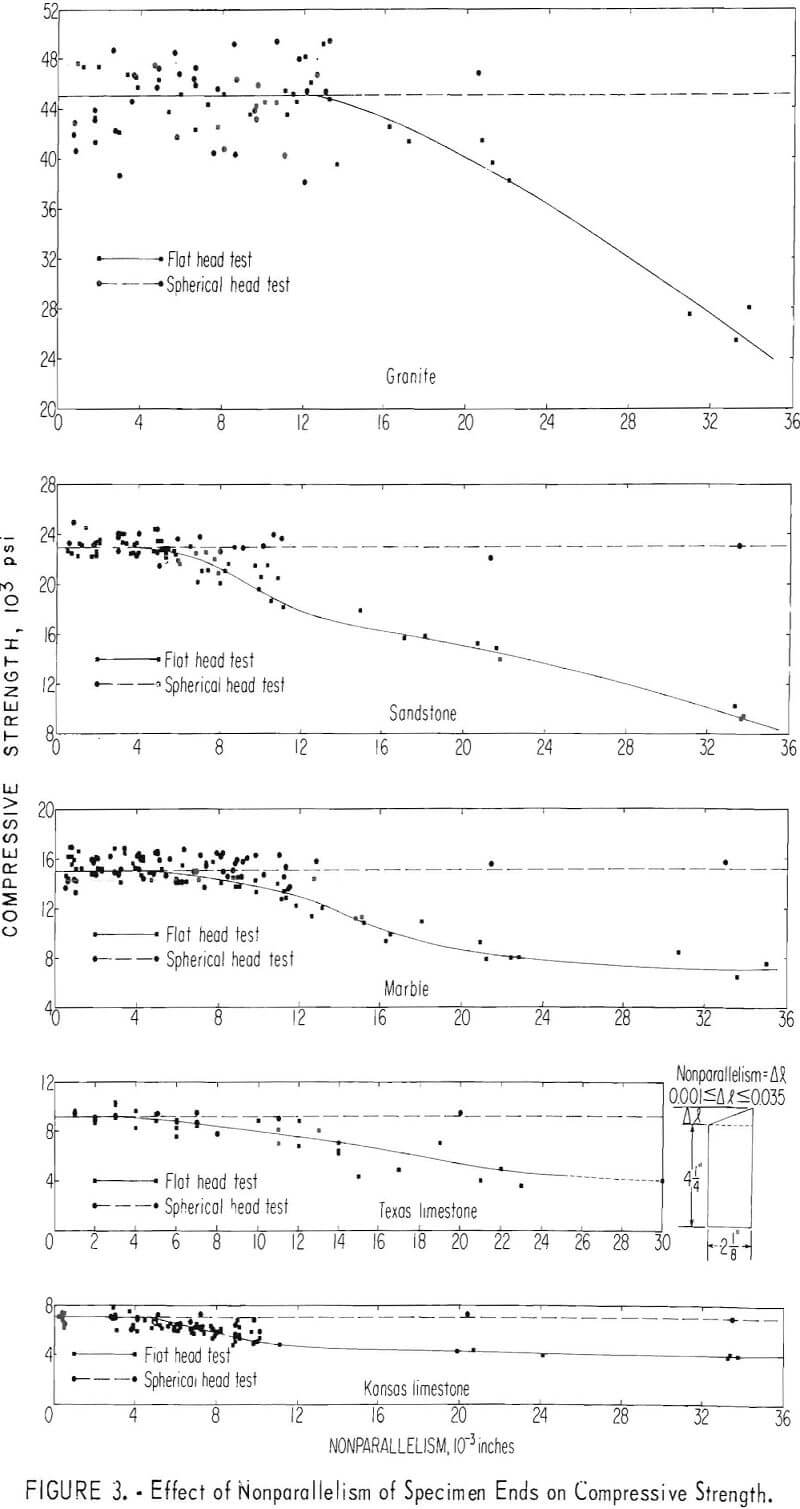
rapidly. The central tendency of the data from each group is approximated by the curves in figure 3. Scatter of the data remained constant at all degrees of nonparallelism tested. From these results, Grosvenor’s value of 0.005-inch nonparallelism for a spherical head test with a 2-inch-diameter sample is a safe value.
Roughened Ends
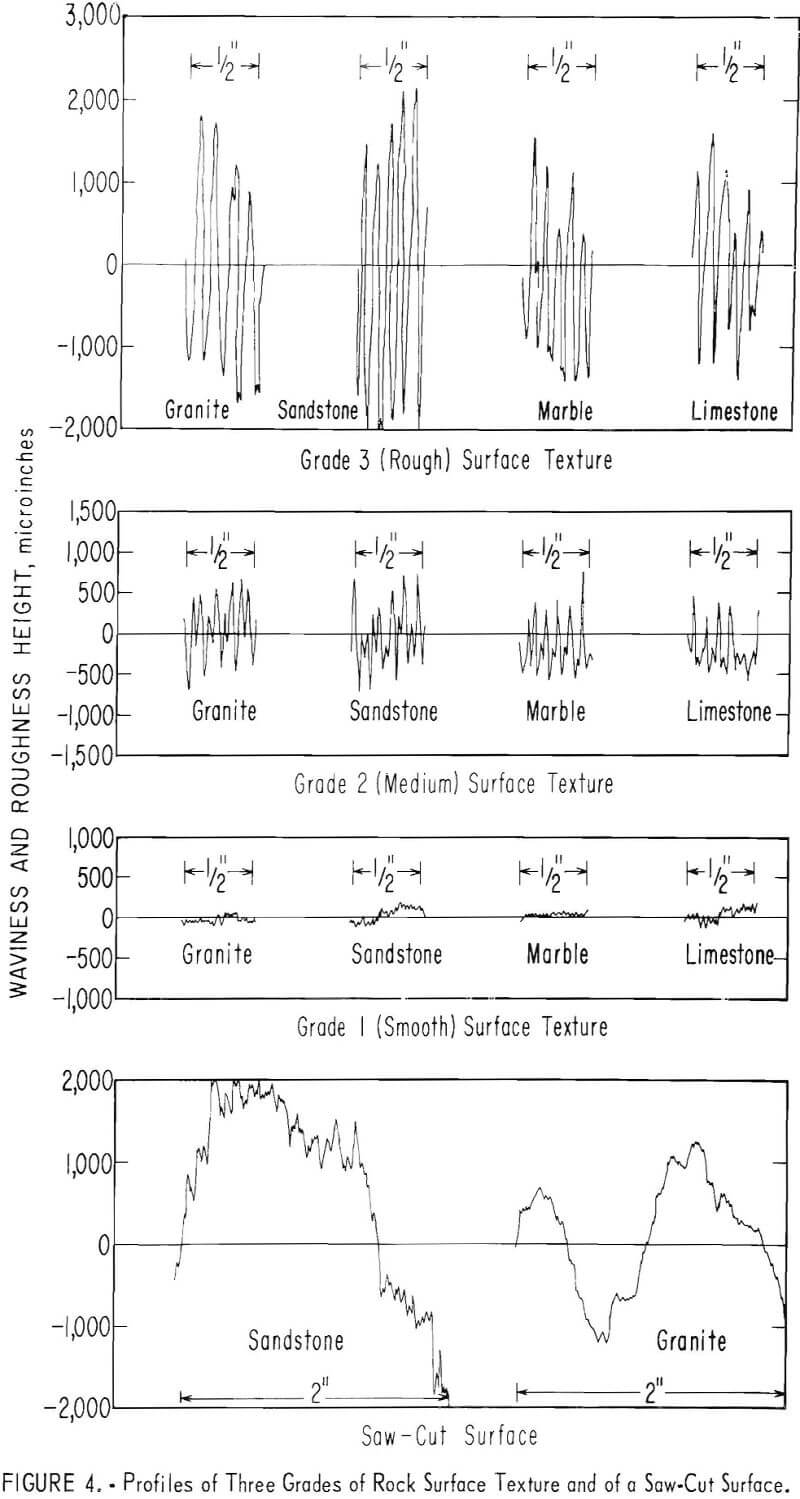
The three grades of specimen end surface texture for each rock type, prepared as previously described, are shown in figure 4. The range of the maximum amplitude of the waviness and roughness of the surface irregularities is 100 to 5,000 microinches. The division of this range into the various grades of surface texture in figure 4 is arbitrary. Matching surfaces of the steel platens used on each end of the specimen during the test had a finish of 40 microinches. Saw cuts without surface preparation are quite variable, but for comparison a group was tested. Two typical surfaces are shown in figure 4; the main surface irregularities of 0.001 to 0.005 inch are due to bending of the saw blade during cutting. Surface-texture profiles were made using the technique described by Horino.
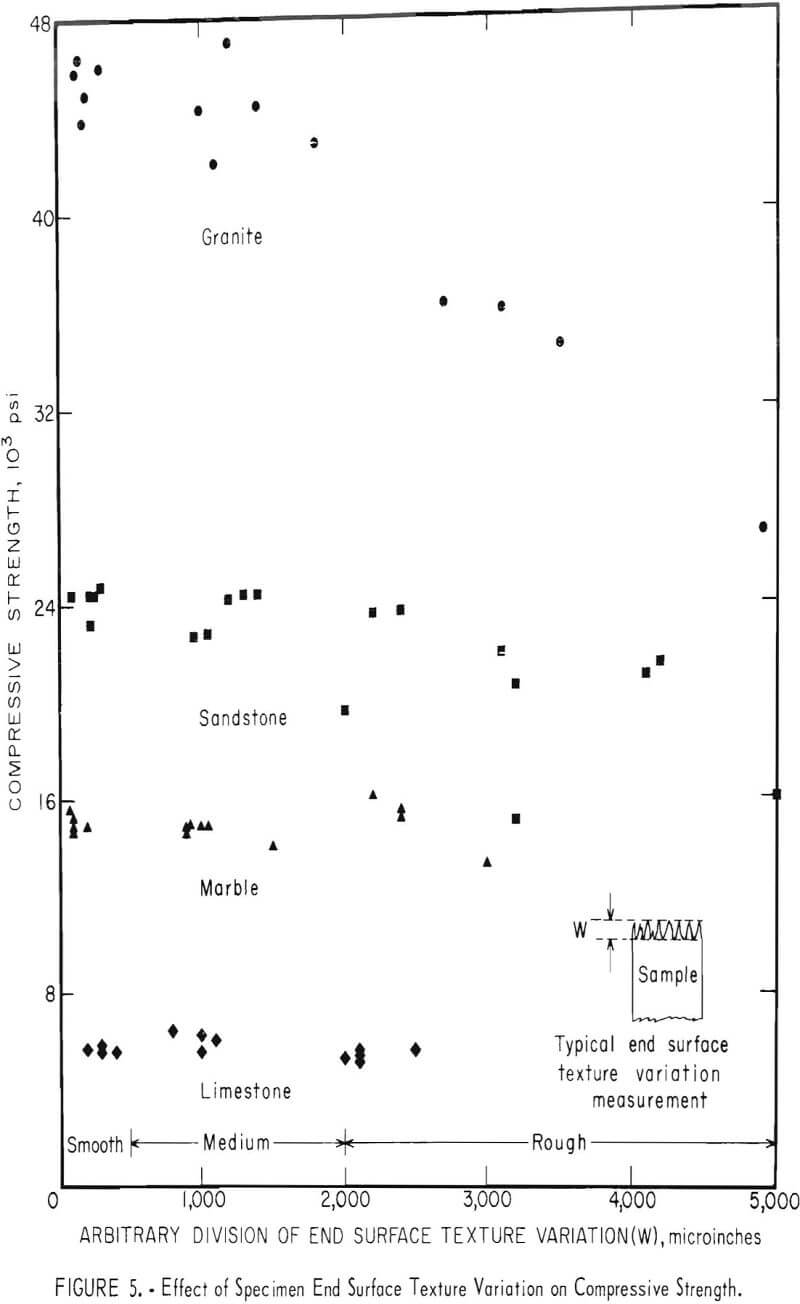
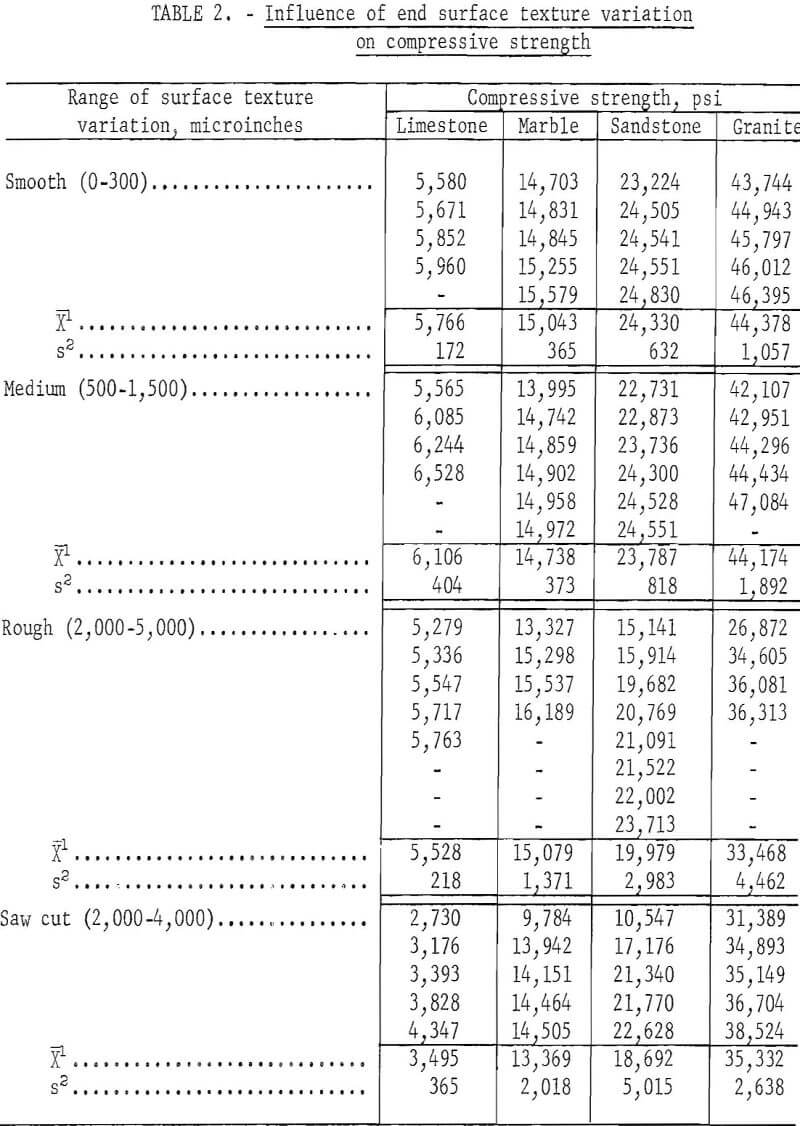
The definition of end surface texture variation, W, also referred to as surface irregularities, is the range of the maximum amplitude of the waviness and roughness. The graphs of compressive strength versus surface texture variation in figure 5 and the data in table 2 serve only as guides for sample preparation or for surface loading during model studies. As would be expected, the table and to some extent the graphs show that the standard deviation of the breaking strength increases with increased surface texture variation for all rock types. Interestingly, the compressive strengths of the soft materials marble and limestone show less response to W than do the harder granite and sandstone. Granite, the hardest material, is the most sensitive to W. A distinctive failure pattern of vertical splitting occurred in most of the samples with W greater than 0.003 inch. The tests also proved that saw cuts without grinding would generally not be acceptable unless care was used to keep W, due to bending of the saw blade, below 0.002 inch. The shape and spacing of surface irregularities appeared to be more critical than the height. The data for the saw-cut surfaces, given in table 2, were not plotted in figure 4 owing to the difficulty of correctly identifying the appropriate measure of surface texture variation. The difficulty can be seen by examining the two profiles of saw-cut surfaces shown in figure 4.
External Variables
During rock testing the expensive crossheads and spherical head assemblies are frequently protected with steel false end platens. The influence on specimen strength of these false end platens, which are placed between the specimen end surfaces and the machine loading platens, is not known. Also, the spherical head friction influence is assumed rather than known. The following investigations were conducted to determine these influences.
End Platen Influence
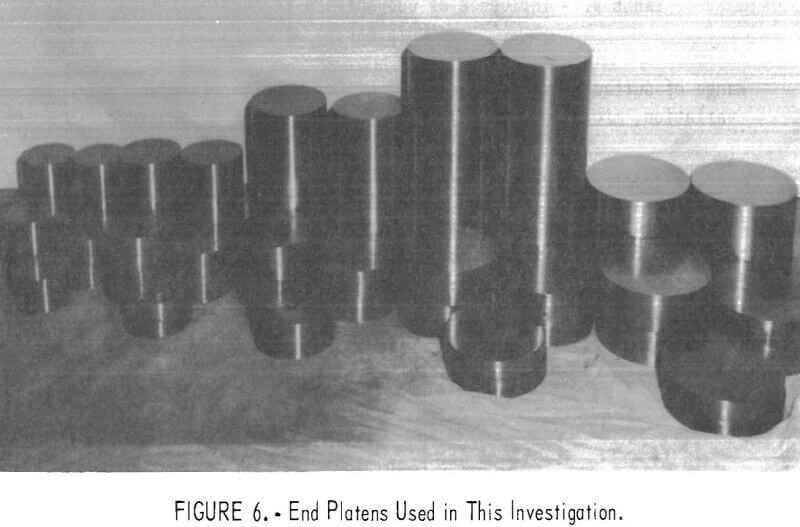
Twenty sets of steel end platens having a Rockwell C hardness of 30 and a tensile strength of 125,000 psi were prepared and ground to a surface texture variation of less than 100 microinches. They are shown in figure 6. Sets of two end platens, ½-, ¾-, and 1-inch thick, were made for each of five
diameters, 2-1/8, 2-½, 3-1/8, 3-½, and 4-1/8 inches. In addition, five pairs of end platens were made with the following dimensions:
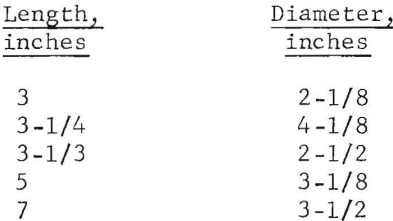
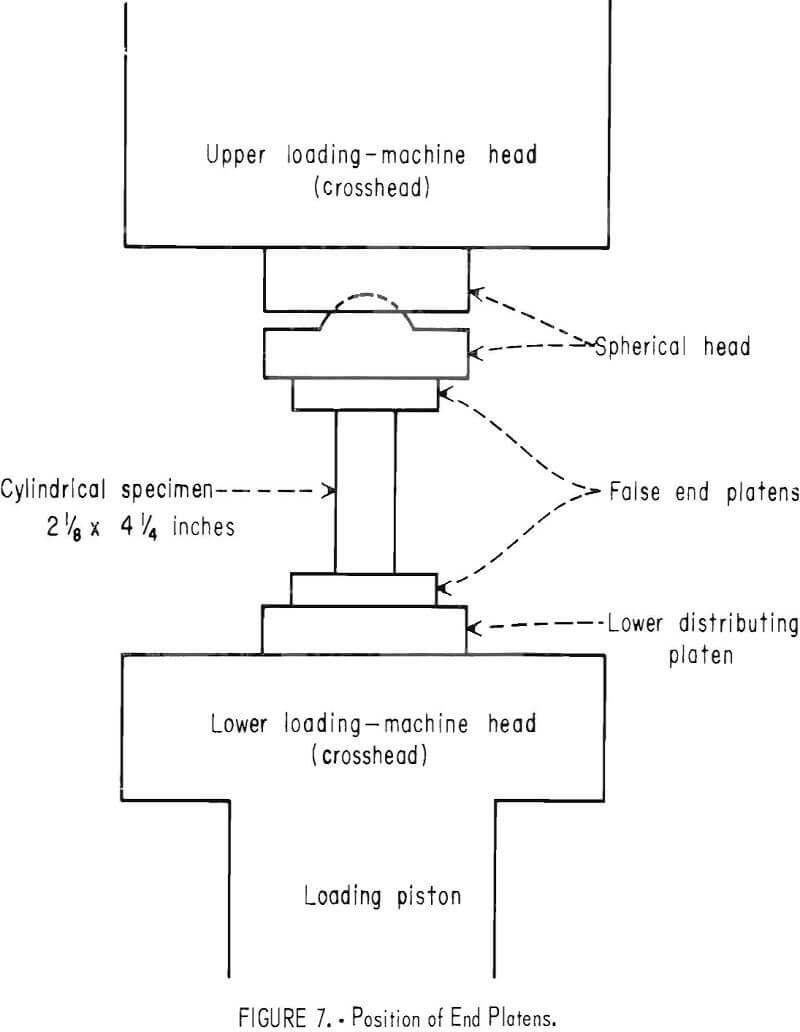
These five pairs of steel end platens, referred to in table 3 as L >2-1/8 inches, were greater in length than the specimen diameter. The relative position of the end platens during the tests is shown in figure 7.
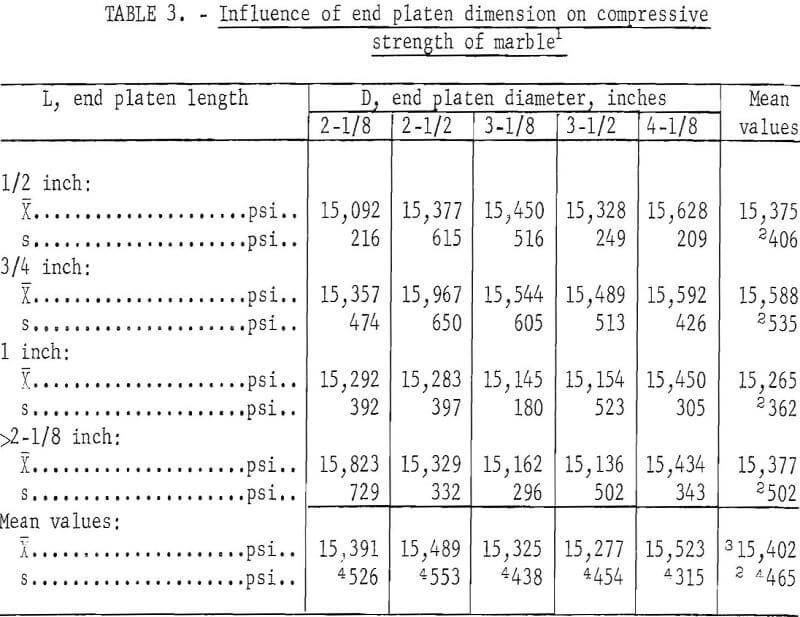
A total of 165 NX cores, 2-1/8 inches in diameter by 4-¼ inches long, were prepared from marble, limestone, sandstone, and granite. The first study consisted of five samples of marble broken on each pair of end platens. The grand mean (see footnote 3, table 3) of the compressive strength for the 100 samples was 15,402; the standard deviation was 465 psi. The average compressive strength (X) and standard deviation (s) for each of the 20 sets of data are given in table 3. An analysis of variance of the four lengths and five diameters was computed. The pooling of the within and interaction sum of squares was used. The resulting F values were 2.18 and 1.04, compared with the theoretical values of 2.76 and 2.53 at the 5-percent significance level. The conclusion is that steel end platen thickness and diameter have no effect on the uniaxial compressive strength of marble.
For comparison, five marble samples were broken on the same spherical head using a commercial platen with concentric grooves directly in place of the lower distributing platen and without false steel end platens. Both the face of the spherical head and the commercial platen were concentrically grooved and hardened to a Rockwell C rating of 58 to 63. The average compressive strength and standard deviation were found to be 15,707 psi and 398 psi, respectively. Analysis of the data proves that the compressive strength of marble is not influenced by steel end platen size or thickness.
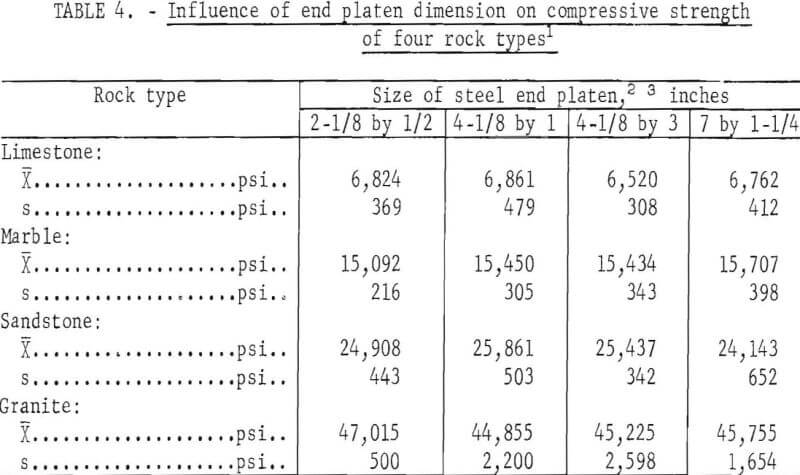
Similarly, low standard deviation and lack of trend occurred for the other three rock types. Table 4 shows the average compressive strength (X) and standard deviation (s) for each rock type with several sizes of steel end platen. The following sizes were used: (1) A small-diameter, thin end platen; (2) a large-diameter, thin end platen; (3) a large-diameter, thick end platen; and (4) the standard commercial end platens. Only two tests had statistically important results which could be significant to testing procedures. One is the apparent low compressive strength of limestone samples on 3-inch-long by 4-1/8-inch-diameter end platens which makes a total column length of 10-½ inches for the sample and two end platens. The other is the apparent high compressive strength of granite samples on the ½-inch-long by 2-1/8-inch-diameter end platens (column length 5½ inches). The standard deviation is 5 percent or less in both cases. The long columns may indicate potentially unstable conditions that decrease apparent strength; however, the lowest
standard deviation for all limestone tests occurred with the long column. Also, two tests of the marble with 14- to 18 inch columns had low standard deviations and average strength values. The highest strengths and lowest standard deviations for granite occurred with the smallest end platens, possibly indicating better horizontal centering; however, all samples were centered by a micrometer depth gage to 0.01 inch. No explanation can be offered for behavior of either the marble or granite. However, the inherent rock variability for these rocks on another project was approximately 10 percent and it is assumed that these results are due to inherent rock variability rather than to end platen effect.
The preponderance of data indicates that all steel false end platens within the range of length and diameter tested are equally satisfactory. An interesting secondary conclusion drawn from these data concerns the spherical seat application. Since false end platen thickness does not affect strength, it must be concluded that in the vertical plane the center of the specimen need not be at the center of the spherical head. This should also allow for thicker ball platen surfaces and the accompanying reduction in platen-bending potential, a concern stated by Rusch.
Spherical Head Friction
Grosvenor reported that possible improvement of compression testing could be achieved by restraining spherical head action after initial loading. Atherton also indicated an increase in apparent compressive strength and decrease in standard deviation due to restraining the spherical head action. Attempts to corroborate these tests were unsuccessful for the four rock types.
Two identical spherical heads of 4-inch-ball diameter were made, heat-treated, and tested for similarity. Thirty plaster specimens broken on each head proved them to be identical.
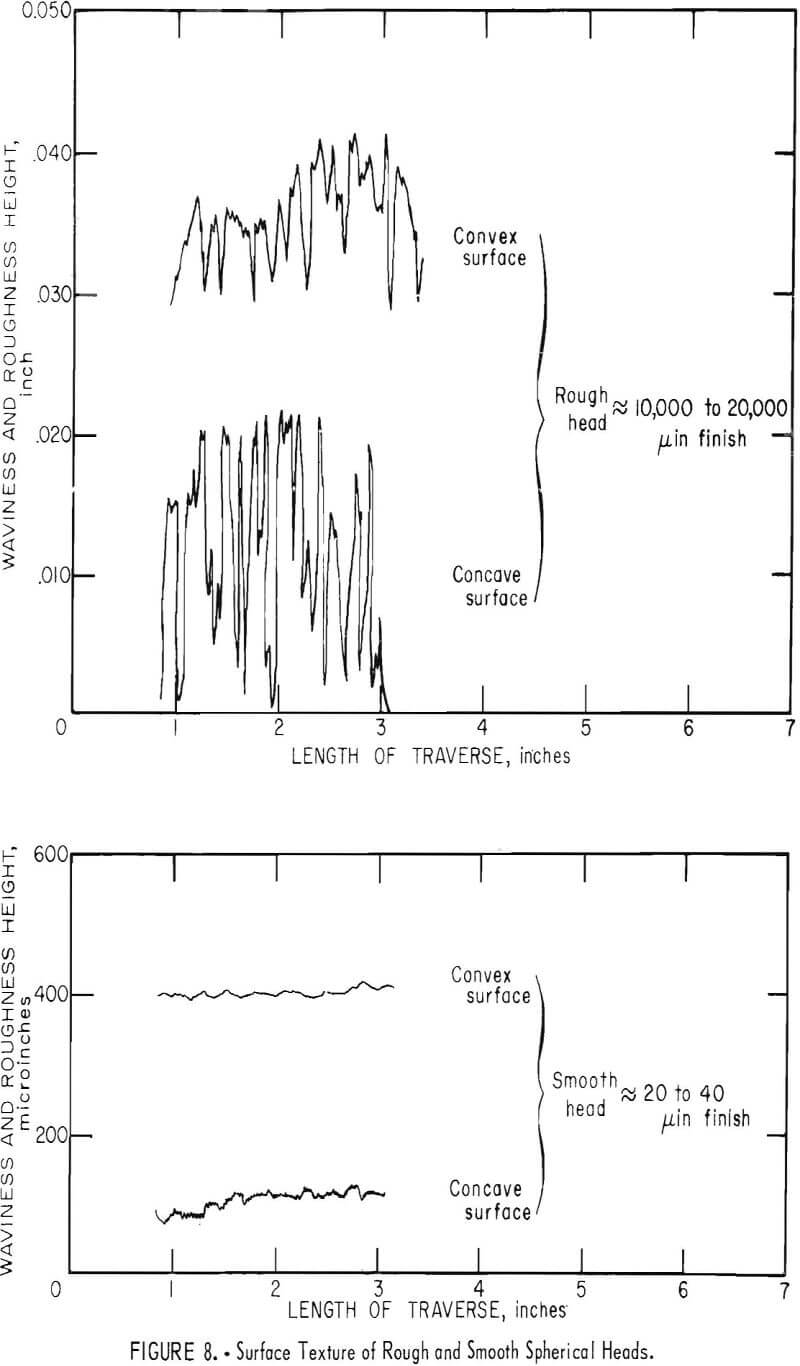
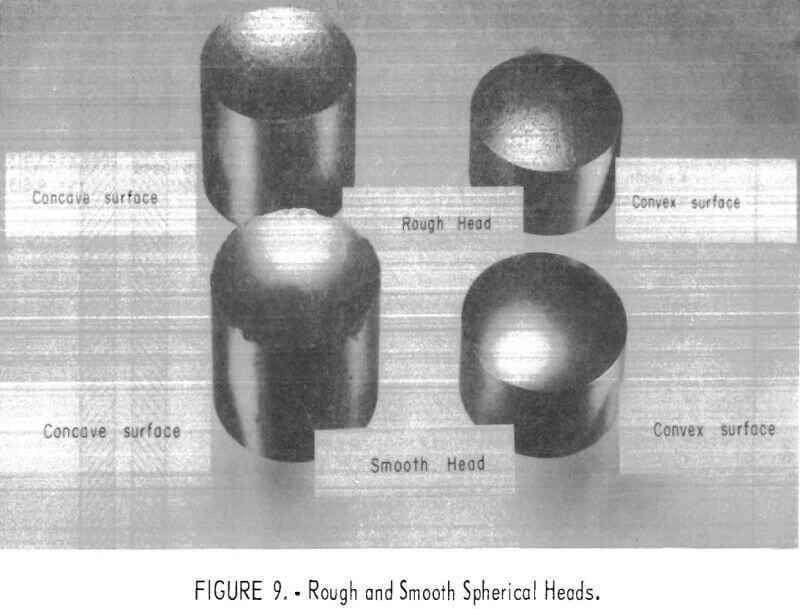
One head was retained in its original condition and used with a pressure grease. To prevent binding of any kind, it was cleaned and regreased after each specimen failure. The second head was tempered, severely roughened, and rehardened to 58 to 63 Rockwell C. It was cleaned and lightly oiled with mineral oil before each test. Several tests were made to move both heads either laterally or vertically under load. The results indicated that the rough head was rigid after initial loading. Two characteristic contours, shown in figure 8, were made by several traverses across the ball and socket joints of both heads. Figure 9 shows the contrasting surfaces of the two heads. The method used for the surface measurements is described in a previous Bureau publication.
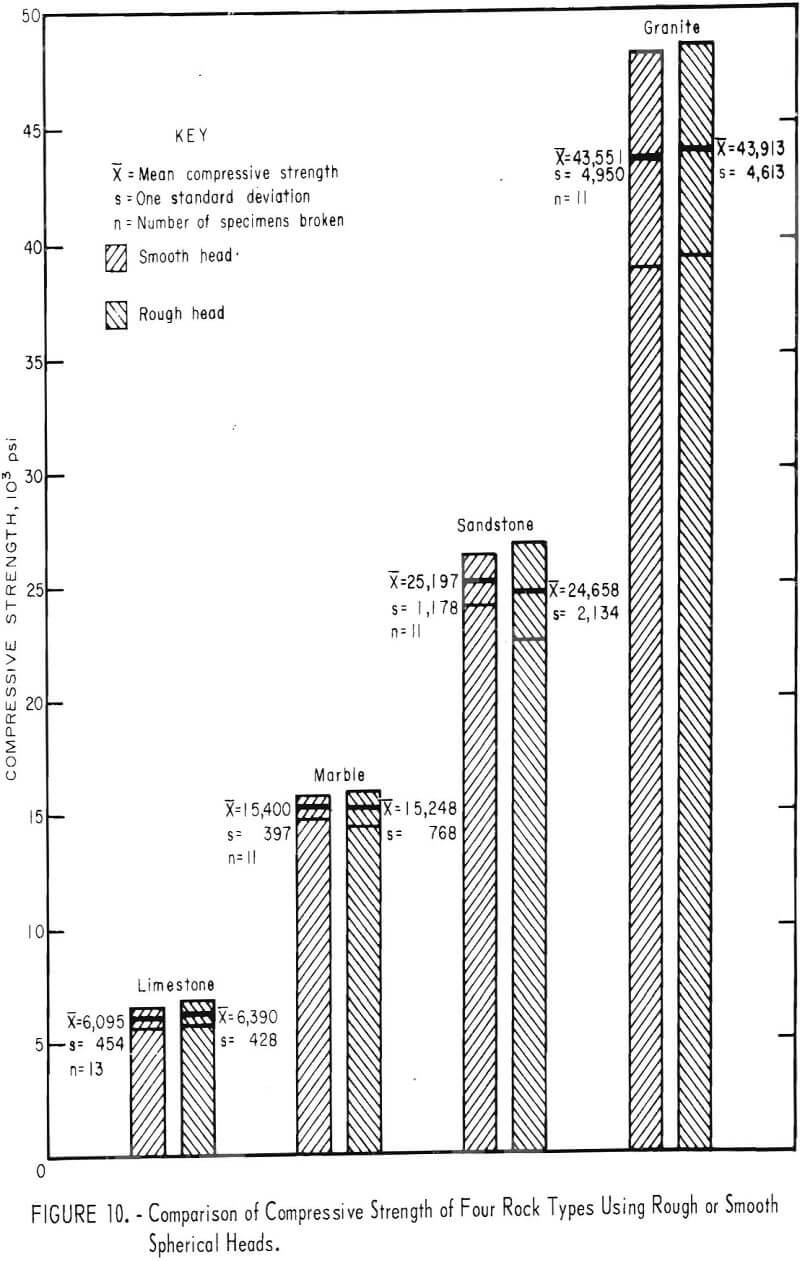
Eleven or more specimens of each rock type were broken using each spherical head. The results are given as a bar graph in figure 10. The difference between the mean compressive strength using the smooth spherical head and the mean compressive strength using the rough head never exceeds 5 percent. This is the same order of magnitude as the standard deviation for the sample group and is therefore not significant. Similarly, the standard deviations of the mean compressive strength shown in figure 10 from the two different heads vary by a maximum of 4 percent. A statistical analysis of variance shows no influence at the 5-percent significance level; in other words, the treatment effect is insignificant.
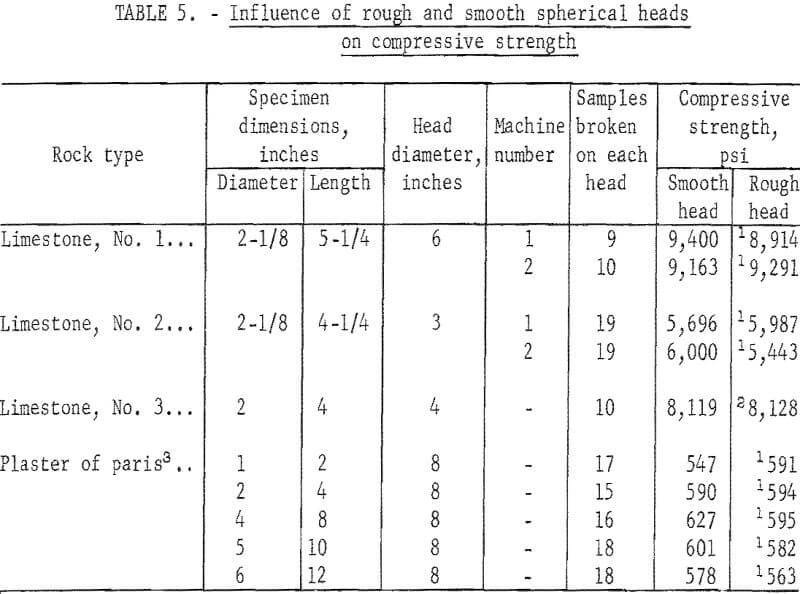
It was suspected that head size, specimen size, degree or type of roughness, and the testing machine itself might influence the results. Twelve additional experiments on four materials proved the influences to be negligible. As shown in table 5, varying the head diameter from 3 to 8 inches did not produce results favorable to either the rough or the smooth head. Neither varying specimen diameter from 1 to 6 inches nor changing machines showed a head friction effect. An entirely different surface friction was produced by two silicon carbide treatments (see footnotes to table 5), but no effect of head friction was observed. These 12 tests adequately confirmed the results of the tests using rough and smooth heads and showed conclusively that the purpose of the spherical head is the initial alinement of load and specimen end.
