Table of Contents
For many years, the impact test has been one of several techniques used to determine explosive sensitivity. This test has provided a useful index having practical value; however, it provides only an ordering of the sensitivities of a series of materials and, because of a lack of standardization in apparatus design and test conditions, comparison of results from different drop testers in terms of drop height, kinetic energy, or on some other basis has never been satisfactory.
Many suggestions have been made in favor of extending the interpretation of results beyond the recording of drop heights. Suggestions ranged from complete standardization in the design to some type of instrumentation to measure useful quantities that could be used as a basis for comparison of results. An interesting approach, using Kistler force gage instrumentation, was developed by Smith and Richardson. They found the gage reliable in providing a force-time history of the drop-weight event but determined that neither impulse nor energy measured by the gage was sufficient to provide complete characterization of a sensitive material and that a rate term was needed.
This investigation, using force-gage instrumentation, was undertaken to determine the effects of the drop-weight test parameters on force-time profiles (force pulse) and the relation between force pulse and the initiation of explosives. The report is presented in five sections: (1) Theoretical, in which expressions for maximum force and rate of applied force (input rate) are developed in terms of pertinent drop test parameters; (2) interpretation of force-time profiles; (3) experimental apparatus; (4) experimental studies; and (5) discussion and conclusions.
Theoretical Considerations
Several details of the principles dealing with elastic collisions and forces are pertinent to the studies. The drop-weight test system treated is one where energy from a falling weight (m1) is transferred to a stationary intermediate weight (m2) in contact with an anvil of essentially infinite weight (m3). The sample is placed between m2 and m3. The treatment may be divided into two parts: a collision between m1 and m2 and, subsequently, one between m2 and m3. Force expressions are developed for the latter collision; under some circumstances, significant forces may be delivered to m3 as a result of further interactions between the three masses. This phenomenon will be discussed in the experimental section.
For any elastic collision between two masses m1 and m2 having respective velocities of v1 and v2 before impact, the respective velocities V1 and V2 after collision can be calculated from the conservation of momentum
m1v1 + m2v2 = m1V1 + m2V2………………………………………….(1)
and energy m1v1² + m2v2² = m1V1² + m2V2²………………….(2)
Dividing equation 1 by equation 2 shows that the relative velocity of approach of two bodies before collision is equal to the relative velocity of recession after collision:
v1 – v2 = V2 – V1………………………………………………………..(3)
The coefficient of restitution (e) is a measure of departure from perfect elastic behavior where
e = V2 – V1/v1 – v2……………………………………………….(4)
When the collision is perfectly elastic, e = 1; when e = 0, the collision is perfectly inelastic and the two bodies adhere and move as one body after collision. In most collisions 1 > e > 0.
Applying these principles to a drop-weight tester where a falling drop weight (m1) impacts a stationary intermediate weight (m2) along a straight line, the velocity (V2) of m2 after impact, assuming e = 1, is
V2 = 2 m1v1/m1 + m2…………………………………………..(5)
where v1 = √ 2 g h,
h = drop height for m1,
and g = constant of gravity.
The velocity of m1 after impact is
V1 =V2-v1…………………………………………………(6)
The kinetic energy (KE2) of the intermediate weight after impact is
(KE2) = ½ m2V2² = 4 m1² m2 g h/(m1 + m2)²…………………………….(7)
Several useful concepts deducible from equations 5, 6, and 7 are as follows:
a. When m2 <m1, the direction of both masses immediately after impact is toward the anvil; oscillatory inputs are possible in this case.
b. When m2 > m1, the direction of is toward the anvil while m1, undergoes an immediate rebound.
c. V2 is proportional to √h.
d. V2 → 2 v1 (its maximum velocity) as m2 → 0.
e. (KE2) = m1 g h when m2 = m1; thus, all of the kinetic energy is transferred under these conditions.
The kinetic energy transfer efficiency for various mass ratios (R) of m1 and life is shown in figure 1; the mass ratio is taken so that R < 1, and the
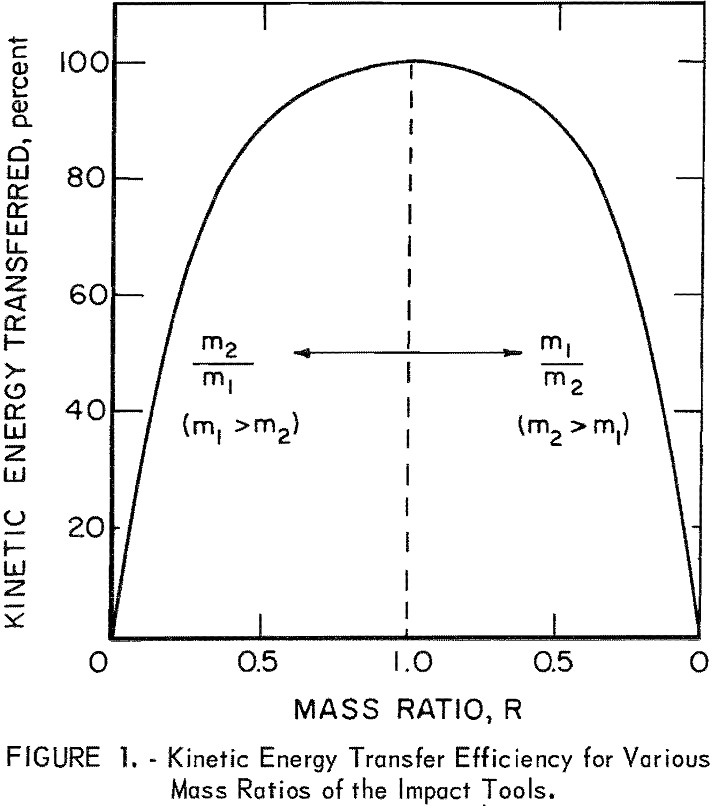
percent transferred is the same for equal values of R.
These concepts provide useful information as to the kinetic energy transfer efficiency in the first impact phase; they also indicate the direction of the drop weight after the first impact phase, which provides perspective on the possible role of the drop weight in future interactions, and they specify the state of the intermediate weight which is about to engage in the second impact phase that between m2 and the anvil m3.
Assuming perfect elastic behavior in the second impact phase, the collision between the intermediate weight (m2) and the anvil of infinite mass (m3) may be visualized as an elastic compression of the two components with the force reaching a maximum value when all the kinetic energy (KE2) of m2 is stored as elastic energy. The elastic energy is then released, the force declines progressively, and m2 rebounds with velocity -V2 (equal but opposite in sign to the approach velocity). The energy transfer efficiency is zero since no kinetic energy is transferred to the anvil (m3).
The forces generated in this collision can be described by considering the problem of a mass subject to a linear resistive force:

Since this type of force produces simple harmonic motion, the solution of equation 8 in the special case where t = 0 when x = 0 is x = A sin ω t. The force is then

The quantity E depends on initial conditions; it is the kinetic energy (KE2) of the intermediate weight at impact:
![]()
Equation 10 shows that the force = 0, when t = 0 (at impact); it increases sinusoidally with time to a maximum value when t = π/2 ω = π/4 π f = T/4 where T is the period of a complete cycle of oscillation:
Fmax = – √2 k (KE2)……………………………………………………………(11)
The time to maximum force can be specified by considering T = 2 π √m/k, where T is the period for a simple harmonic oscillator. From the fact that in this case the force level went from zero to maximum in the time T/4,
tm = T/4 = π/2√m2/k………………………………………………………..(12)
where tm = time to maximum force
and m2 = mass of intermediate weight.
The average rate of applied force can be obtained by dividing equation 11 by equation 12:

where h = drop height,
m1 = mass of drop weight,
and m2 = mass of intermediate weight.
Several additional concepts dedueible from equations 11, 12, and 13b are as follows:
a. The maximum force increases with √(KE2), where (KE2) is the kinetic energy of the intermediate weight (also Fmax ~ √h).
b. The time to maximum force is independent of the velocity of intermediate weight but increases when the mass increases; that is, tm ~ √m2.
c. The rate of applied force (input rate), which will be shown to have a significant effect on the reaction mechanism, may be increased in two ways (see equation 13b):
- The input rate will increase with the drop height (input rate ~ √h) ; the rate increases wholly by virtue of an increase in the maximum force level (Fmax) since the time to maximum force remains constant in elastic behavior.
- The input rate will increase when the mass of m2 is decreased relative to that of m1. The rate increase will depend on the value of the quantity (m1/m1 + m2). Thus for a given m1 this quantity approaches a maximum value of unity when m2 → 0. It should be emphasized, however, that any increase in the input rate by this method will be accompanied by a corresponding decrease in the maximum force level because Fmax ~ √KE2 (equation 11); this will result in poorer energy transfer efficiency.
These concepts are based upon the assumption of perfect elastic behavior. In the collision between m1 and m2, the contact surfaces of these components are hardened steel, and the collision should, for all practical purposes, approximate an elastic one. The effects from inelastic properties would be to reduce the velocity and kinetic energy of the intermediate weight given in equations 5 and 7. These equations, however, still provide insight on how these quantities vary in terms of the initial collision parameters.
In the interaction between m2 and the anvil, m3, the insertion of granular material between the masses will reduce the elastic nature of the collision significantly; however, even under these conditions approximate elastic behavior has been observed experimentally after the explosive is somewhat crushed and compressed. The equations for maximum force and input rate should in any event indicate how these quantities are affected by the system parameters.
Interpretation of Force-Time Profiles
An interaction between m2 and the anvil will produce a force-time profile as depicted in figure 2, providing there is no interference from m1 during the interval T/2.
The total impulse delivered to the anvil is

For perfect elastic behavior (e = 1) , Δ v = 2 V2; for e < 1, Δ v < 2 V2.
The energy (El ) of any impulse (I) is

where m = mass.
The kinetic energy of m2, however, is calculated from the shaded area (A) , since all kinetic energy of m2 was stored as elastic energy in a time tm (V2 = 0 at t = tm) . Thus, when e = 1,

and the energy of rebound (for m2) is associated with area B.
When perfect elasticity does not exist, e < 1; for example, when a sample is placed between m2 and m3, areas A and B would be diminished somewhat. However, an impulse measured from the force-time profile would still represent the actual impulse that the sample was subjected to, but an energy E’ calculated from the shaded area A would now be less than KE2 since some energy would be used to deform the sample.
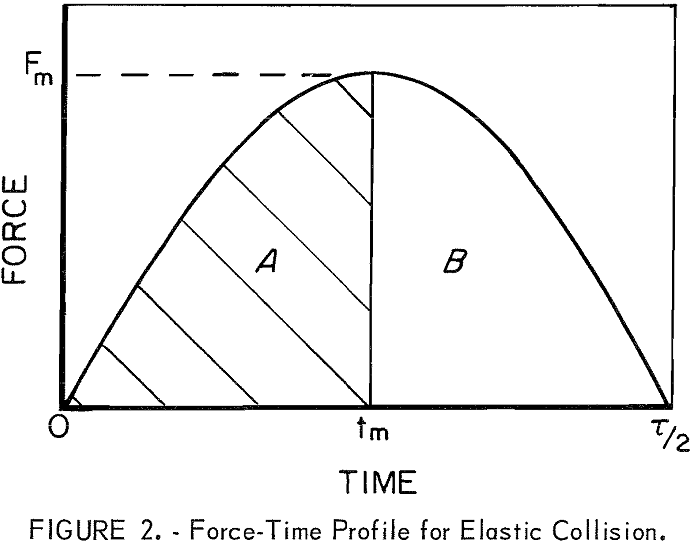
For loosely packed explosive crystals or powders, e will not be constant during the initial phases of compression. It has been shown that the relatively small forces developed during this phase increase in a more linear fashion with time, followed by the sinusoidal pulse shown in
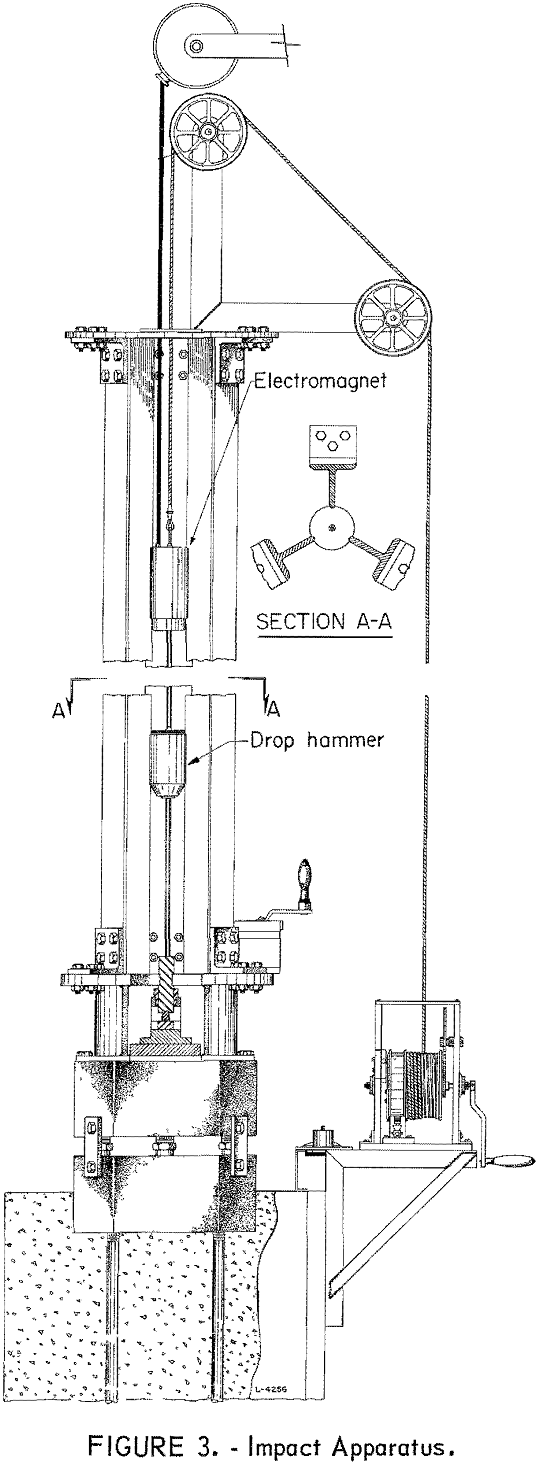
figure 2. Some primary explosives may react during this initial compression pulse. In our studies the secondary explosives used reacted on the sinusoidal pulse at force levels requiring attenuation of the input signal so that the forces in the initial compression phase were barely detectable; hence, they were not integrated into the impulse measurements.
Experimental Apparatus
Drop Tester
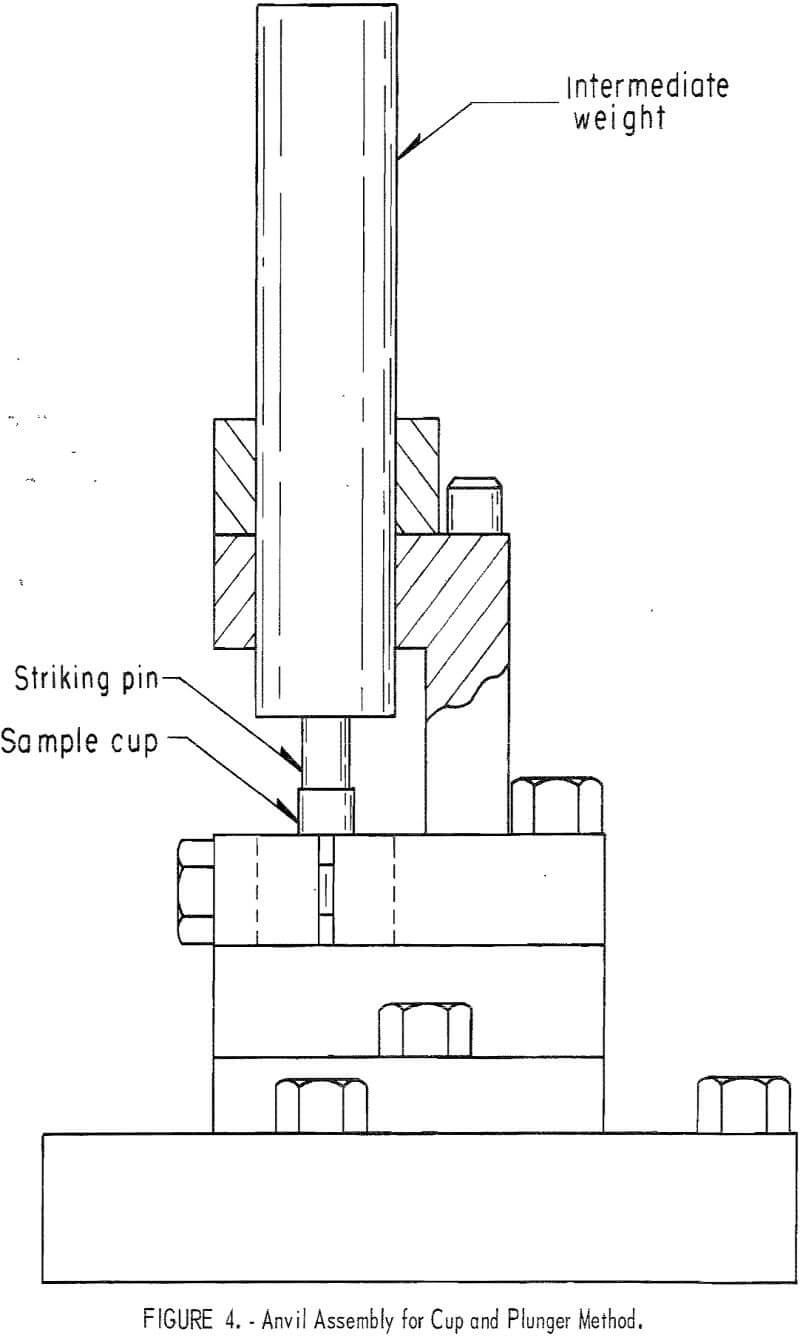
The drop-weight impact apparatus in use (fig. 3) utilizes a 5-kilogram drop weight (“drop hammer”) that is raised or lowered by an electromagnet mounted in a yoke situated between guide rails formed by three steel T-beams. The falling drop weight strikes an intermediate hammer (plunger), about 1-¼ inches in diameter by 6 inches long, that is coupled but not rigidly attached to a striking pin that fits into a ½-inch-diameter steel cup containing the explosive (fig. 4). The steel cup rests upon a steel anvil that is firmly attached to and supported by a steel plate and massive concrete base. All steel impact surfaces are hardened to a value of 55-60 on the Rockwell C scale.
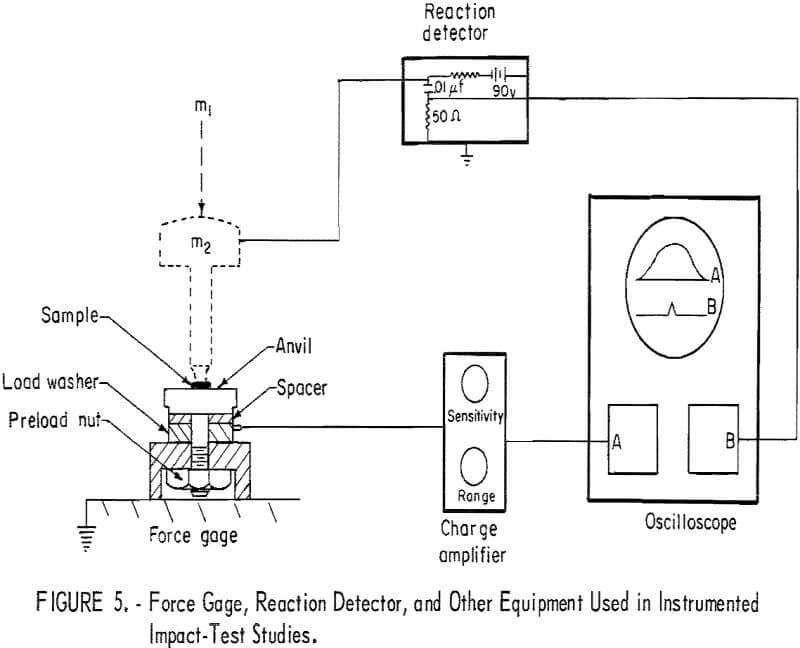
In this investigation, the Bureau equipment was modified by the introduction of a force gage in the anvil assembly. A study of the force-time profiles produced by the Bureau tools and with modified tools using inert samples is discussed later in this report. In subsequent experiments with explosives, an ionization reaction detector was added to the system to aid in detecting precise times of reactions. The force gage and detector are similar to those used by Smith and Richardson. Other minor modifications will be
discussed where applicable. The instrumented system used in explosive trials is shown in figure 5,
Force Gage
The Kistler force gage (fig. 5) is a model 907-A piezoelectric element (load washer) sandwiched between a hardened steel anvil and a steel mount and is used with a Kistler model 504 Dial-gain charge amplifier that converts charge signals from the piezoelectric transducer to voltage signals suitable for display on readout equipment. Voltage output is proportional to the force exerted on the gage anvil. The gage system was capable of measuring a maximum dynamic force load of about 45,000 pounds. Except in some calibration tests, the force levels attained in experimental tests were less than 75 percent of this value. The gage was calibrated by releasing several different weights of different mass, at various drop heights (no intermediate component used); the drop and rebound velocities were measured by photoelectric means. In each case the quantity m Δ v (actual impulse delivered to the anvil) was equated (see equation 14) to Fdt obtained by mechanical integration of areas under the entire force pulses as recorded on oscillograms. If these quantities are equal, the system is “direct reading;” otherwise the ratio of the two quantities is the calibration factor.
Reaction Detection Instrumentation
The detector consisted of a simple R-C discharge circuit that applied a 90-volt potential between the intermediate weight and anvil (fig. 5). In principle, a conducting path was provided by ionization when a reaction took place. The output of the R-C circuit (a fast-rising pulse) was monitored on the lower beam of a dual-beam scope (the upper beam recorded the force-time profile). For nonreactions, the circuit did not discharge because the layer of compressed explosive (solid) continued to provide isolation of the components. Other necessary insulation included a nylon liner in the guide bushing and insulating tape on the guide rails in the region directly above the intermediate weight (for a distance equal to the length of the drop weight).
Experimental Studies
Force-Time Profile
The purpose of these experiments is to demonstrate the effects that changes in various test parameters (tool mass ratio, drop height, and sample thickness) have on the shape of the force pulse presented to the sample. Inert starch samples were used throughout these demonstrations because internal forces from reacting explosives could alter or obscure that portion of the force pulse following reaction. The shape of or change in shape of the force pulse resulting from changes in test conditions can be explained (qualitatively) by the collision mechanics presented earlier, and references to equations in the theoretical section will be made where applicable.
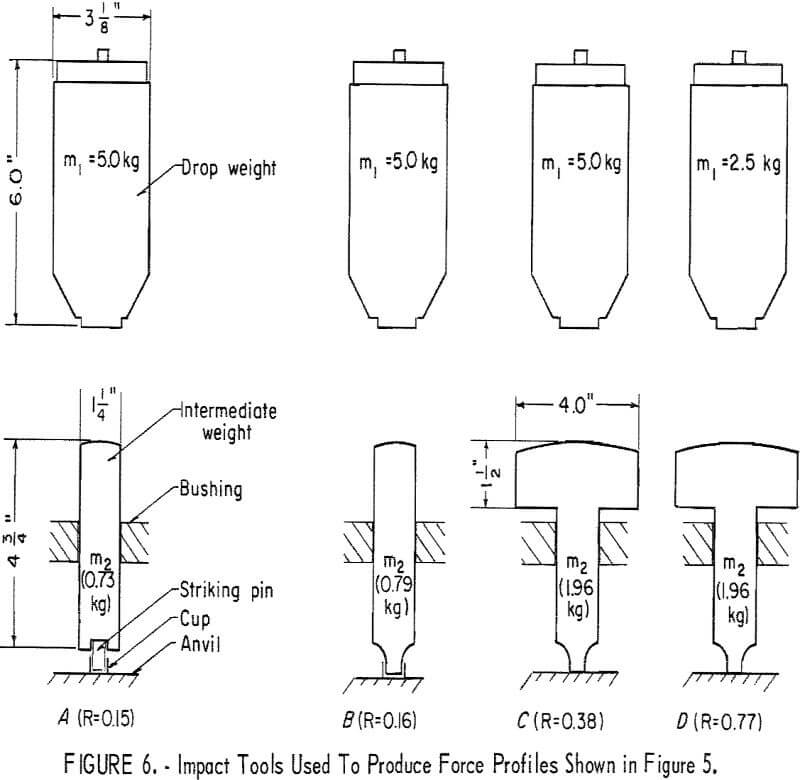
The first demonstration is to show the effect of tool mass ratio (R = m2/m1) on the force-time profile. The various tools used in these experiments are shown in figure 6, and corresponding force-time profiles are given in figure 7. The oscillograms in figure 7 show results of three repeat trials for reproducibility; the sweep velocity and scope gain were 50 µsec/cm and about 5 x 10³ lb F/ cm (pounds of force per centimeter), respectively.
The Bureau tools in figure 6A (m1 = 5.0 kg, m2 = 0.73 kg, striking pin = 17 g) produced the profiles in figure 7A. If we consider the intermediate weight (m2) and striking pin as one mass, then the mass ratio (R) for these tools is 0.15. These tools produced profiles exhibiting numerous force pulses for which reproducibility was good for the first force pulse and poor for subsequent pulses; maximum force was attained on the second pulse. An analysis of this profile is deferred pending presentation of profiles resulting from a slight modification of the Bureau tools.
The slightly modified tools are shown in figure 6B; the intermediate component (m2) and striking pin have been combined into one component. The mass ratio (R = 0.16) is essentially the same. The profiles produced (fig. 7B) are quite similar to those for the Bureau tools except that reproducibility is quite good over the whole force-time profile. Thus, loose coupling between m2 and the striking pin was the cause of the nonreproducible aspects for the Bureau tools.
Both sets of profiles presented so far exhibit oscillatory-type inputs with the second pulse dominant a feature which is undesirable because, when the inert samples were replaced by explosives, reactions took place on the dominant force pulse; thus, the explosive, when tested, would be subjected to a full compression cycle before reacting on a subsequent cycle.
Oscillatory force pulses occur as a result of insufficient “kinetic energy transfer from m1 to m2. Figure 1 shows that the kinetic energy transfer efficiency for R = 0.16 is only about 45 percent; thus, as equations 5 and 6 predict, the direction of m1 after impact with m2 is toward the anvil. The drop weight (m1) does not rebound immediately and is available for further interactions with m2 when m2 rebounds (or partially rebounds) from the anvil.
Two additional force-time profiles are presented from tools having progressively more favorable mass ratios. The tools in figure 6C (m1 = 5.0 kg, m2 = 1.96 kg) were used to produce the profiles given in figure 7C where R = 0.38. The three profiles are quite reproducible; the kinetic energy transfer efficiency is 75 percent. The first force peak is now dominant; however, significant energy is still delivered on the second and third oscillation of m2.
Lastly, the tools in figure 6D (m1 = 2.5 kg, = 1.96 kg) were used to produce the profiles given in figure 7D. In this case, R was 0.77, resulting in an energy transfer of about 95 percent. Essentially all the impulse or energy was delivered via a single force pulse. It should be pointed out that the cup (to contain sample) was not used in the latter two cases; the cup altered the profiles only in minor details and had no effect on reducing the oscillatory nature of the profiles.
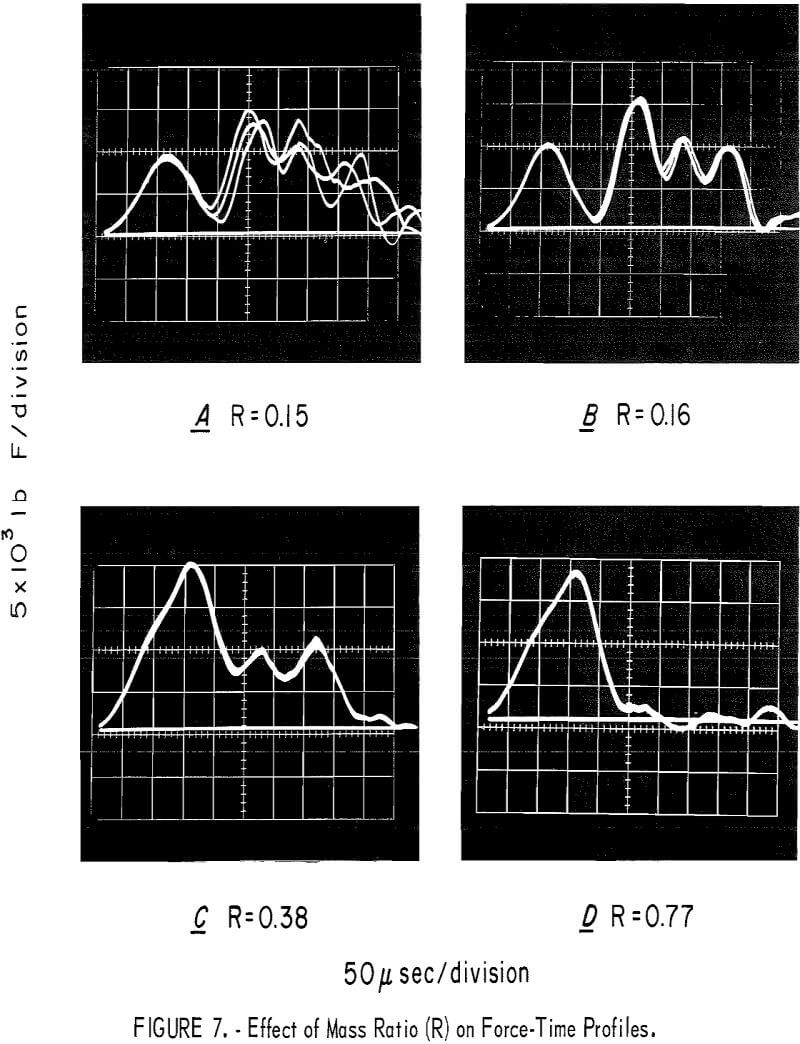
These experiments demonstrate that oscillatory inputs will result if m2 < < m1; the drop weight cannot be removed from the scene and caught mechanically after the first force pulse (as is done in some systems) because it does not rebound until the oscillatory input is complete. No experiments were carried out for m1 < m2 because it required major changes in the existing equipment; however, the input should not be oscillatory in these cases because m1 should rebound immediately after impact with m2. (V1 would be negative in equation 6.) The drop weight should, however, not be much lighter in weight than m2 because the kinetic energy transfer efficiency would be reduced (equation 7); hence equations 11 and 13a indicate that both the maximum force level and the input rate would be reduced correspondingly.
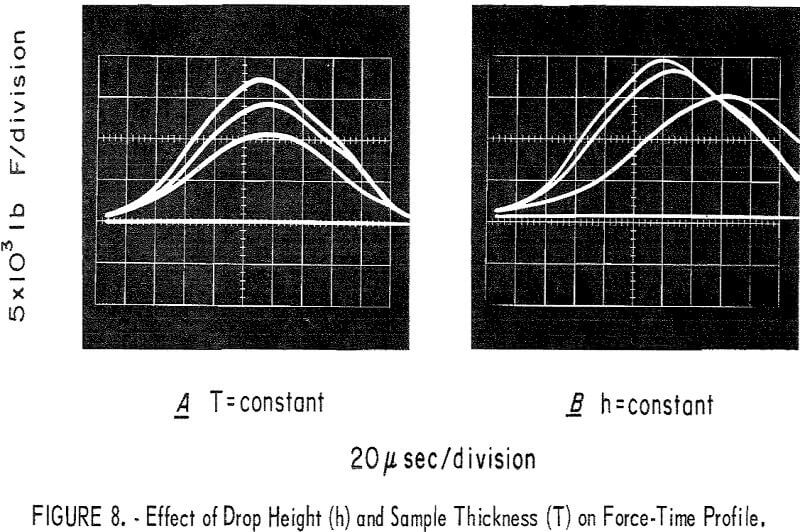
Having dispensed with the mass ratio effect on the force-time profile, we now wish to demonstrate the effects of drop height (h) and sample thickness (T) on force pulse shape; these effects are shown in figures 8A and 8B, respectively. In figure 8A, the drop height was varied from 25 cm to 50 cm in two steps, producing the three profiles shown. Note that the effect is to increase the maximum force level and that the times to maximum force remain essentially constant, indicative of elastic behavior (equation 12). Thus, the sample, after having been deformed by the impact, exhibits elastic properties. The maximum force levels, however, cannot be predicted with precision without detailed knowledge about the elastic properties of the deformed sample in each case. The most important point is that the maximum force and hence the input rate (equation 13b) increase with the drop height.
In figure 8B, the inert sample thickness (T) was increased by a factor of two in two steps; h was constant. An increase in T reduces the value of the elastic constant, k, in equation 12, and the time to maximum force increases for thicker samples. The maximum force decreases as T is increased because the elastic constant, k, and possibly the kinetic energy of m2 (KE2) were reduced at the time of elastic compression of the sample (equation 11). The important point here is that the input rate is reduced drastically by virtue of a lower force level and by virtue of a longer time to maximum force.
The effects of h and T on the force-time profile presented are important because in the explosive trials that follow the input rate has a marked effect on the occurrence of reaction.
Explosives
Since the arrangements of tools shown in figure 6D transmitted the most energy to the sample under the best conditions tried, they were used to study
the force pulse relationships with three explosives: HMX, PETN, and RDX. Simultaneous measurements were made of reaction time and force pulse. The consistency of all was crystalline (rather than powdery), so chosen because it was easier to maintain uniform thickness layers in the crystalline form. In each case, the explosives were dried and screened in one batch and placed in a desiccator until needed. They were dried 4 hours at 100° C. Approximate average particle sizes, determined by screening, were 165, 165, and 275 microns for HMX, PETN, and RDX, respectively. For tests, the samples were placed on the anvil (no cups used) in layers ¾ inch in diameter (the contact surface of m2 was only ½ inch in diameter), using thin hard cardboard cards with ¾-inch holes in them to maintain a consistent boundary and, hence, uniform layer thickness. Thicknesses (T) specified were based upon the mass (M),
loose packing density (p), and radius (r) of the explosive sample (T = M/pπr²). For T = 0.33 mm, the corresponding masses of HMX, PETN, and RDX explosive distributed over the ¾-inch-diameter area were 200 mg, 167 mg, and 262 mg, respectively. These samples, as well as others at different T values, were weighed to within ±2 mg.
All tests were made at drop heights higher than the H50 height because in preliminary trials the time-to-reaction measurements for trials at or near that point varied by as much as 300 percent, making it impossible to attach significance to average results. This preliminary result demonstrated that the input to the explosive at the H50 point is marginal, producing highly non- reproducible reaction response. Thus, in the ensuing studies, the force pulse shape was varied by varying the drop height (at heights above the H50 height) and the explosive thickness.
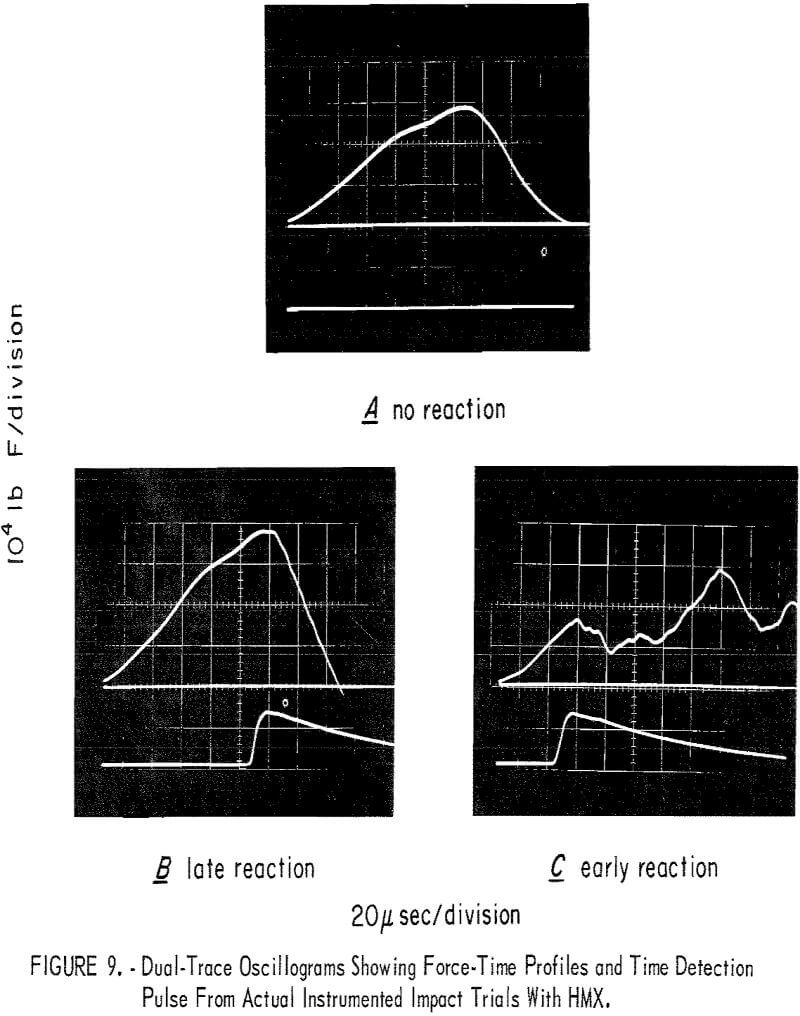
Sample oscillograms from tests with HMX are shown in figure 9; the force pulse is on the upper trace, and the time of reaction is on the lower trace. The sweep velocity and gain here were 20 µsec/cm and 10 4 lb F/cm. Figure 9A shows a case for no reaction, while figures 9B and 9C are cases where reactions occurred at progressively earlier times. In most trials, the result was more like that in figure 9C. Note that the portion of the force pulse, after reaction, is markedly altered after a relatively violent reaction (fig. 9C); the change is more subtle for less violent reactions (fig. 9B). The detector pulse, however, clearly indicates the time of reaction in each case.
Time-to-Reaction Data
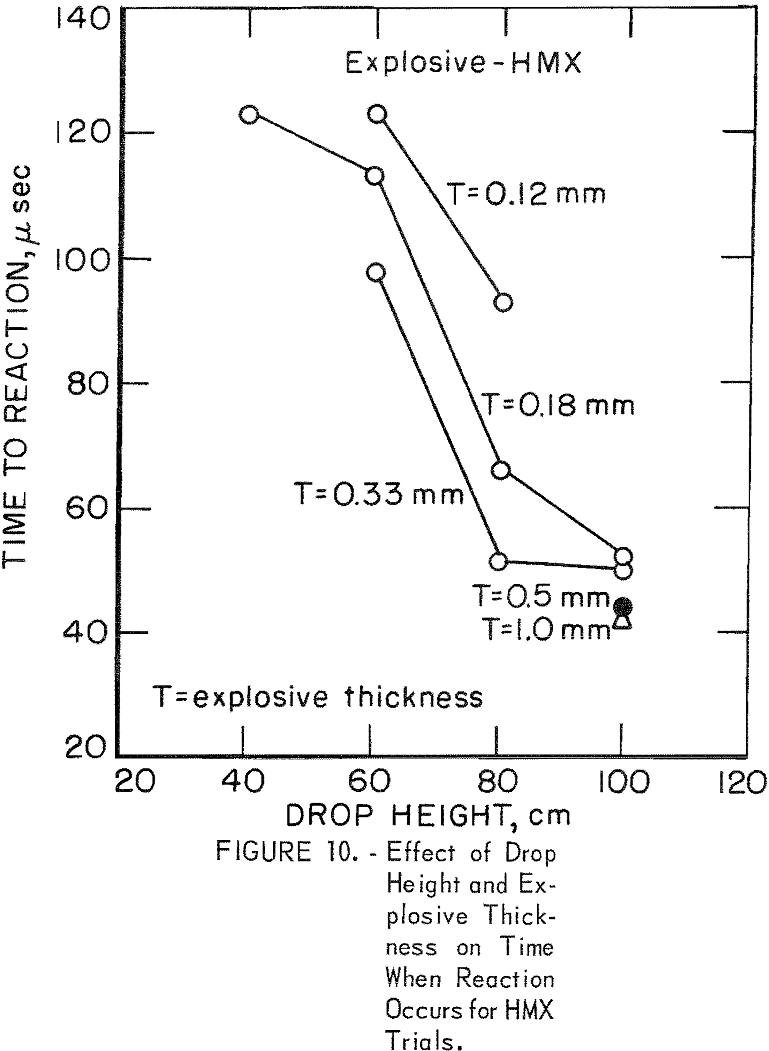
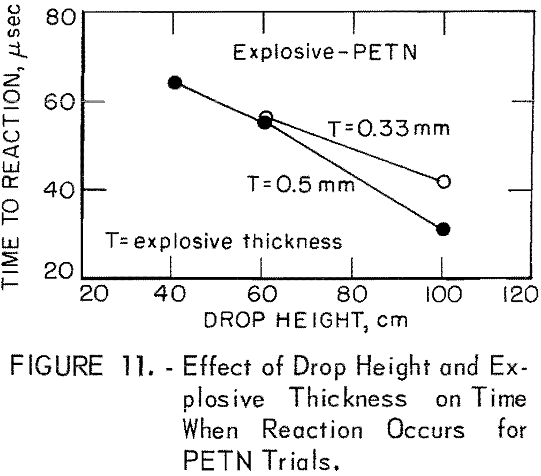
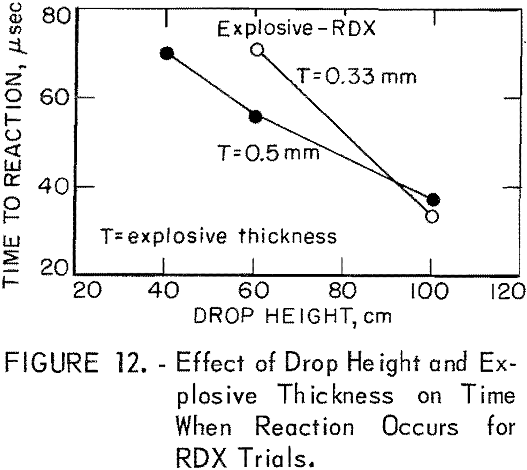
Time-to-reaction measurements are shown as a function of drop height (h) for several explosive thicknesses (T) in figures 10, 11, and 12 for HMX, PETN, and RDX, respectively. The thickness range investigated was 0.12 to 1.0 mm; average values from four trials are shown. The scope was triggered on the input pulse at a force level that was, for all practical purposes, zero.
The HMX data clearly show that the time to reaction decreases markedly when the height, h, is increased, confirming the results of Rideal and Robinson. For example, using a 0.33-mm-thick HMX sample, the time to reaction at 100-cm drop height was about 50 µsec less than it was at 60-cm drop height. Similar trends were observed for the other HMX explosive thicknesses tested at drop heights ranging from 40 to 100 cm. The data also show lower time-to-reaction values as thickness, T, was increased.
Tests with PETN and RDX performed at T values of 0.33 and 0.50 mm and at h values ranging from 40 to 100 cm show trends quite similar to those observed for HMX. The time measurements decrease when h is increased and also tend to decrease as T increases.
Data Reproducibility
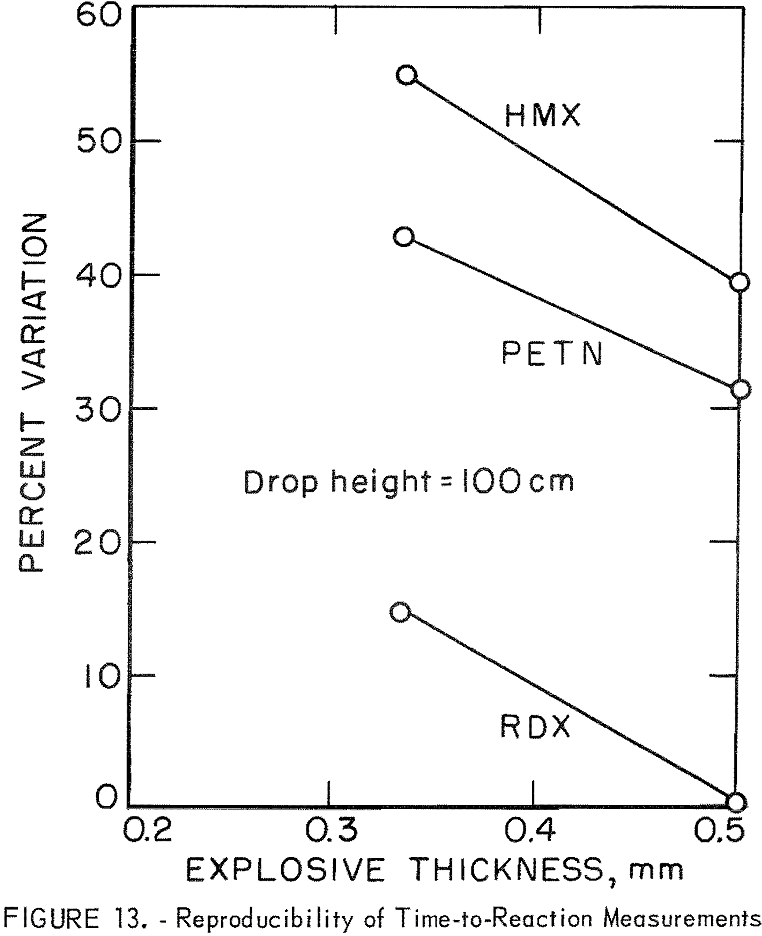
Figure 13 shows the reproducibility of individual measurements in terms of percentage variation as a function of explosive thickness (T) for trials carried out at 100-cm drop height with HMX, PETN, and RDX. The percentage variation is the difference between the highest and lowest value from four trials, divided by the average value. Variations for RDX trials were significantly less than those observed for HMX and PETN, with HMX exhibiting the greatest variations. Variations also decreased as T was increased. Although not shown, the variations were also substantially larger at lower drop heights (at lower input rates). These non-reproducible aspects make it difficult to accumulate meaningful data at low input rates (low drop heights) and with thin explosive samples.
Energy and Pressure Data
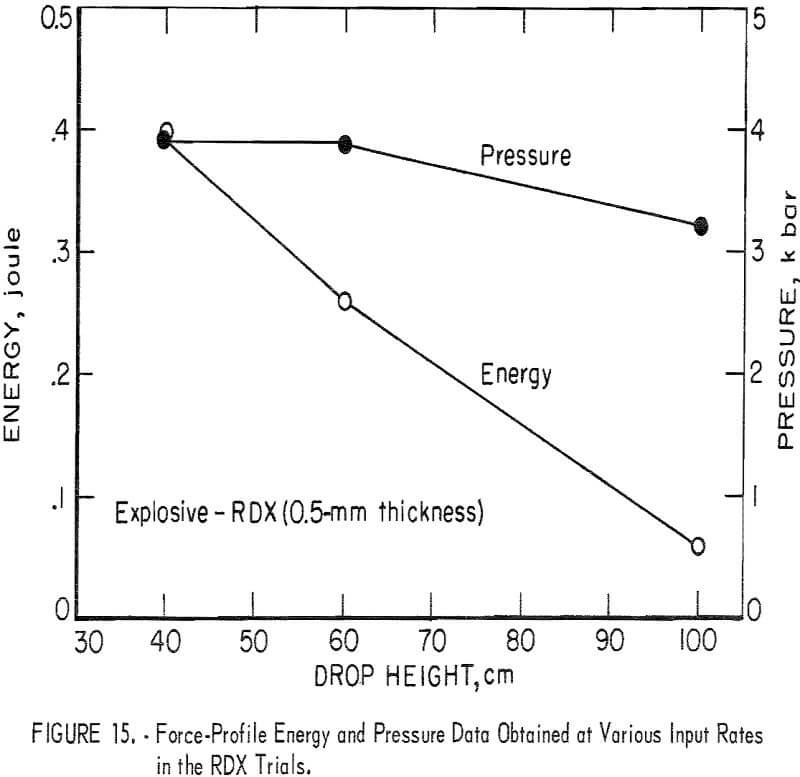
Impulse measurements were taken from the two least variable available data sets; these were impacts on 0.5-mm-thick PETN and RDX samples. Energy equivalents were calculated from impulse values, and force values were converted to pressure equivalents. The energy here is that of the force pulse presented to the explosive up to the time of reaction while the pressure is that at reaction. Energy and pressure were plotted against drop height in figures 14 and 15 for the PETN and RDX trials, respectively.
Energy is not constant; in the PETN trials, the energy at 40-cm drop height is about 7.5 times larger than that at 100 cm; a factor of 6.5 is observed in the RDX trials. These differences are much larger than could be assigned to experimental errors.
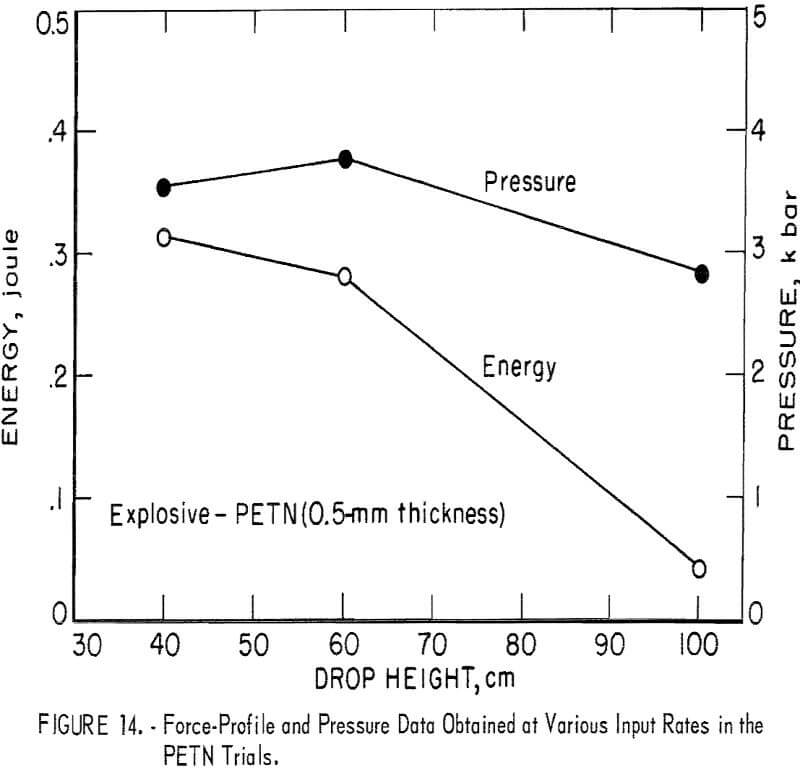
The pressure levels at the time of reaction ranged from 2.9 to 4.0 kilobars, with generally lower pressure levels corresponding to higher input rates and with slightly higher pressure levels associated with the RDX trials.
Thus, the pressure levels, the force-profile energies as measured by the gage, and the times at which reactions occurred were not constant; they decreased as the rate of input was increased. Reproducibility of these measurements was also much better at the higher input rates. The input rate is therefore a pertinent consideration in the reaction phenomenon.
Explosive Thickness Effect
The explosive thickness effect requires further clarification. Contrary to expectations, the time-to-reaction observations decreased as the thickness was increased over the range investigated. The input rate, however, was shown to decrease for thicker samples (fig. 8). This apparent paradox clearly demonstrates an important sample-size effect. Possibly, in thinner samples, the localized decompositions are less likely to be propagated to neighboring explosive particles and more likely to be absorbed by metal parts so that reactions are delayed. In these experiments, the sample-size effect opposed the rate effect and was dominant. The importance of using appropriate size samples and maintaining uniformity is indicated.
Discussion and Conclusions
The application of a force gage and a reaction detector to the Bureau of Mines drop-weight apparatus has provided valuable insight into the nature of the stimulus delivered to the test specimen and the response of the specimen to the stimulus. The results indicate the desirability of certain modifications of the present test apparatus. They should also be of considerable value in the development of standards for drop-weight testing.
With the tools currently employed in routine drop-weight testing, it was found that the force pulse delivered to the test specimen was oscillatory in nature and not reproducible. Reproducibility is markedly improved if the striker pin used in the current setup is rigidly affixed to the intermediate hammer. In addition, single well-defined force pulses can be generated if the masses of the drop weight and intermediate hammer are made more nearly equal. This, in effect, decouples the drop weight from the intermediate hammer and allows the hammer to deliver a smooth compression pulse to the specimen.
After the drop-weight tools were modified to generate single compression pulses, other factors were found to influence the stimulus delivered to the test specimen. The peak force with attendant rate of force application was found to vary with sample thickness and presumably with initial sample density; particle size may also be important. Rigid control of these parameters must be maintained if the sample is to “see” the same stimulus for a given set of impact conditions.
Given complete control over the input stimulus, other factors affect the response of the test specimen to a given impact. The most important of these are thought to be moisture content, particle size, and degree of confinement of the test specimen. These variables must also be controlled.
An attempt was made to attach some fundamental significance to the various physical quantities measured in drop-weight tests on several explosives. The least ambiguous of these was the peak force or pressure applied to the sample at the time the sample explodes. This was found to decrease only moderately as the rate of force application was increased. As a consequence, no unique value can be assigned to this parameter. Values of total delivered energy at the time of sample reaction can also be deduced from the force-time data accrued in the drop-weight tests. However, the distribution of this energy among the various mechanical components and the explosive is not known. Since the compressibility of the explosive sample is much greater than the mechanical components, it would appear that most of the energy resides in the test specimen. Even so, this quantity was found to decrease with increasing drop height which controls the rate of force application. Thus, from a practical point of view, the drop-weight height at which reactions occur is as significant a variable as the physical quantities available from force-gage measurements, and there would be little value in incorporating such instrumentation in a standardized drop-weight test procedure. This is not to say that force-gage instrumentation would not be useful in the calibration of drop-weight testers or in more fundamental studies of ignition mechanisms.
The results of these studies point up the fallacy of the common practice of equating the results of different impact testers in terms of so many kilogram-centimeters of drop weight-mass height, or so many joules of drop weight-kinetic energy. At present, there appears to be no way of normalizing the results obtained with impact devices of different design. In fact, the attainment of equivalent results from identical impact machines will require much more control over sample preparation and test procedures than is currently exercised in the industry.
