Table of Contents
Dissolved zinc concentrations averaged 9,400 µg/L (micrograms per liter) in water from abandoned lead and zinc mines, some of which discharge at the surface. Contamination of the shallow aquifer by the highly mineralized mine water is limited to the immediate mining area. The quality of water in the deep aquifer is generally excellent and unaffected by mine water.
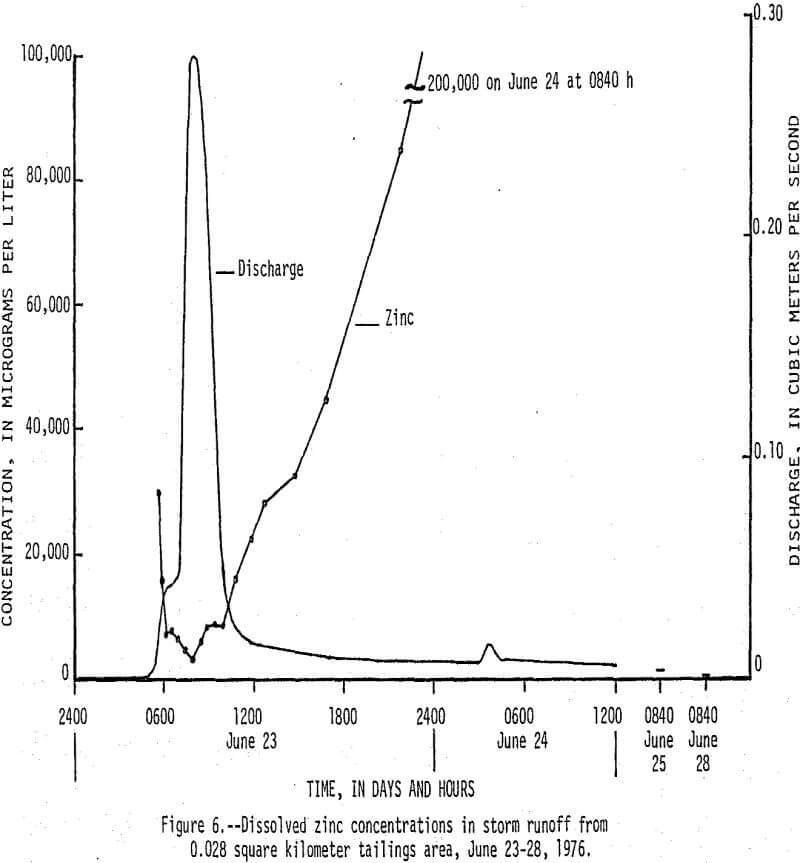
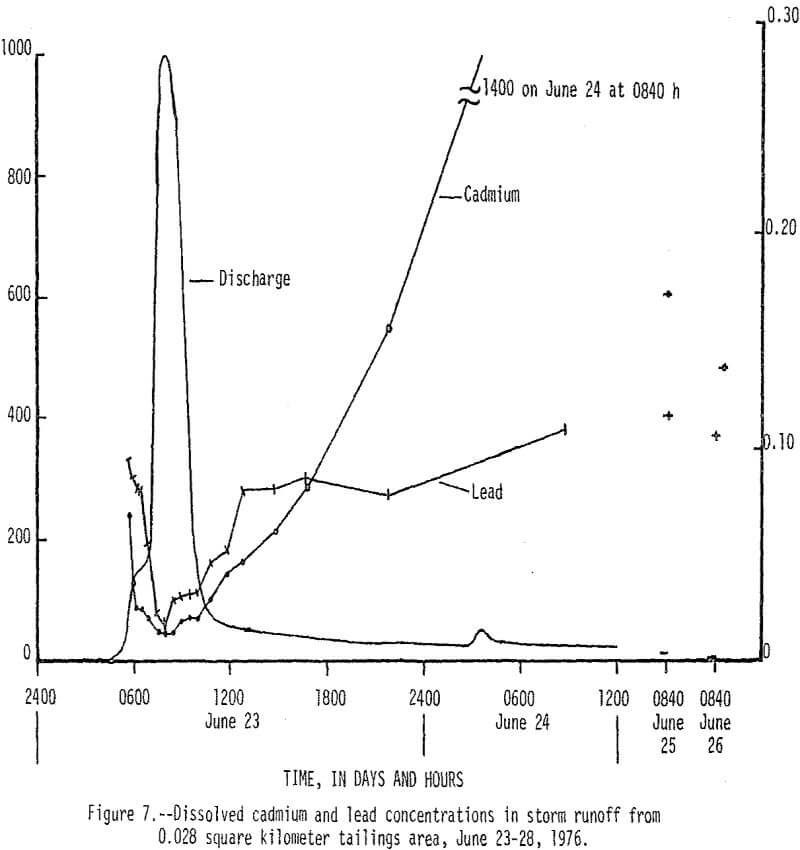
Dissolved zinc concentrations averaged 16,000 µg/L in runoff from tailings areas. However, during a summer storm, runoff from a 0.028 km² tailings area contained maximum dissolved zinc, lead, and cadmium concentrations of 200,000; 400; and 1,400 µg/L, respectively.
Mine-water discharges increase dissolved zinc concentrations in receiving streams from a background of about 40 µg/L to about 500 µg/L during periods of low flow. The higher concentrations are sustained during high flow by runoff from the tailings areas. Deposition of tailings on stream bottoms increases zinc concentrations in bottom material from a background of about 100 µg/g (micrograms per gram) to about 2,500 µg/g and increases lead concentrations in bottom materiel from about 20 µg/g to about 450 µg/g.
Results of this study indicate the continuing need to control metal-mining wastes after mining has ceased, as well as during active mining.
Ground Water
The shallow aquifer consists of cherty limestone of Mississippian age and the deep aquifer consists of cherty dolomite and sandstone of Ordovician and Cambrian age. The shallow and deep aquifers are separated by relatively impermeable silty limestone and shale of Mississippian and Devonian age. The shallow aquifer reaches the surface at places and extends as deep as 150 m. The deep aquifer is reached at a minimum depth of about 100 m and extends as deep as 550 m.
Water-level measurements in approximately 200 wells and mine shafts that bottom in the shallow aquifer show the water table is 10 to 30 m below land surface at higher elevations (ground-water recharge areas) and near the land surface at lower elevations (ground-water discharge areas). A few mine shafts have spring-like discharges of mine water. Ground-water divides generally correspond to topographic divides. The movement of ground water is from the divide areas to the streams.
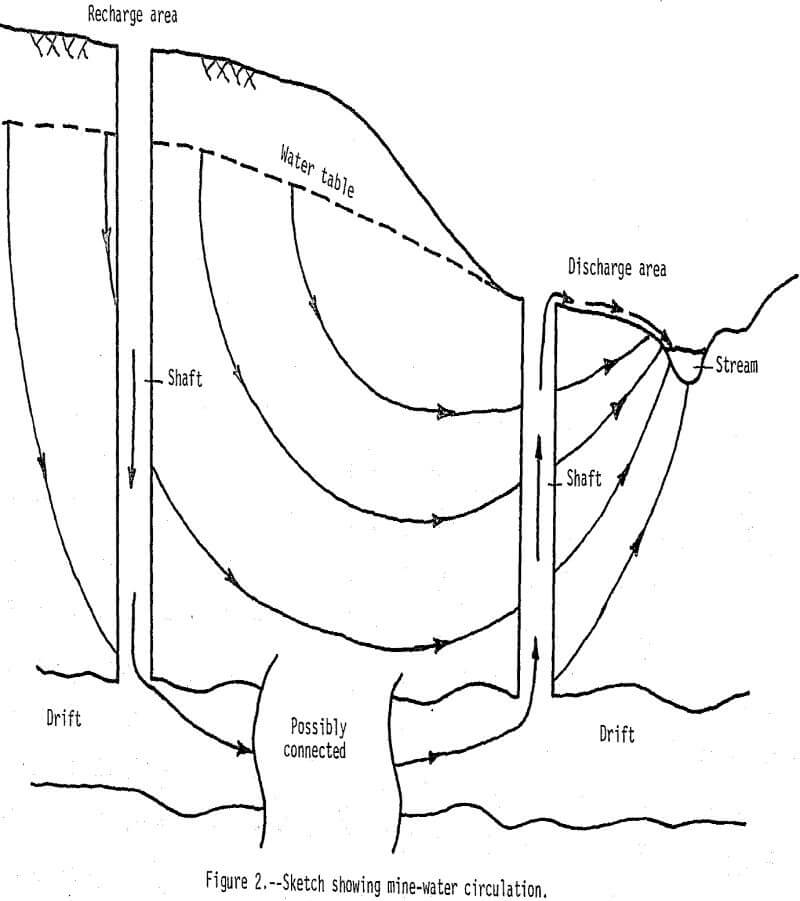
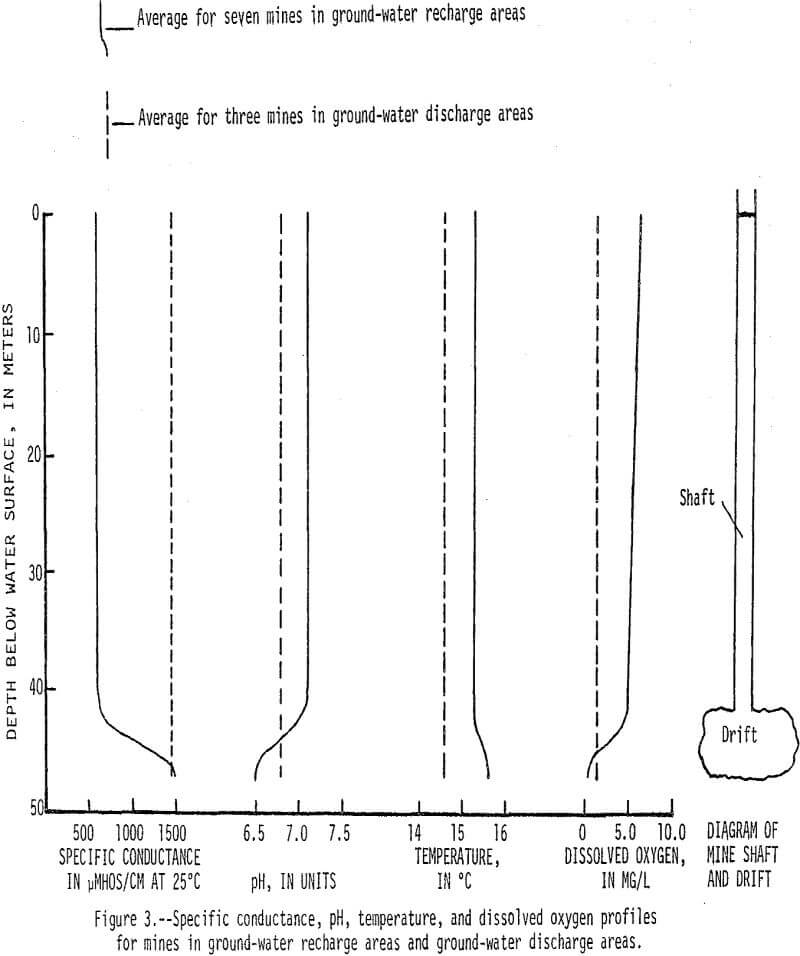
Dissolved-solids concentrations in water from the mine shafts are generally greater than 1,000 mg/L (milligrams per liter). In ground-water recharge areas downward movement prevents water in drifts from circulating up into mine shafts (fig. 2), and water in these shafts contains less than 500 mg/L dissolved solids. Conversely, in ground-water discharge areas upward water movement causes water in the drifts to circulate up through the shafts. This phenomenon is further illustrated by specific conductance, pH, temperature, and dissolved oxygen profiles that represent average characteristics for seven mines in recharge areas and three mines in discharge areas (fig. 3).
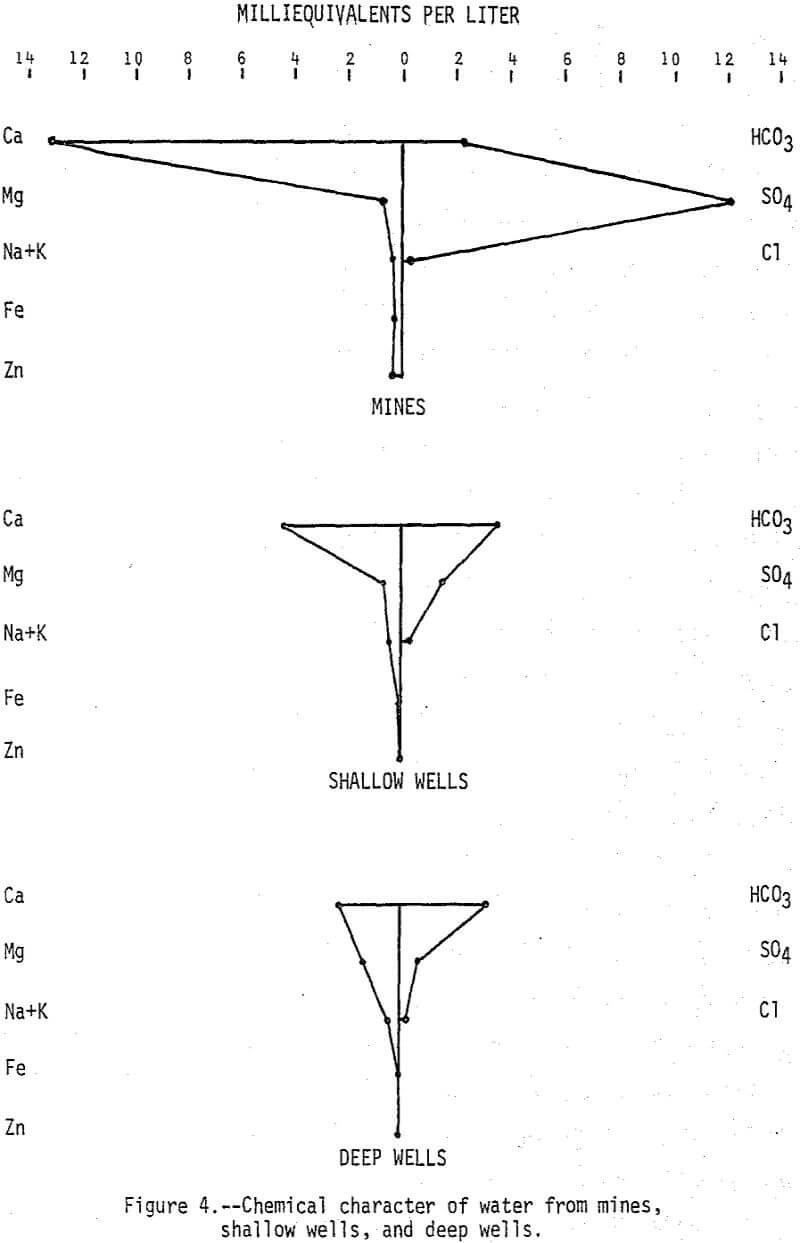
Major constituents in water from 14 mines, 21 shallow wells, and 14 deep wells are summarized in Figure 4. Calcium and sulfate account for most of the increased mineralization of the mine water, but zinc which averaged 9,400 µg/L is very significant from the standpoint of pollution. Other metals are generally low in concentration in the mine water because surrounding limestone rocks neutralize the mine water to a pH of greater than 6.0. Results of the shallow well sampling indicate that although wells located in or very near mines may be seriously affected by the mine water, there does not appear to be widespread dispersion of the highly mineralized mine water in the shallow aquifer.
Water in the deep aquifer is a calcium magnesium bicarbonate type and it can be distinguished from water in the shallow aquifer by its lower mineral content and lower calcium magnesium (Ca:Mg) ratio. The average Ca:Mg ratio (calcium and magnesium expressed in milliequivalents) is 23 for water in the mines, 23 for water in the shallow wells, and 1.7 for water in the deep wells. The lower ratio for water in the deep aquifer is indicative of the higher magnesium content of the dolomitic rocks. The deep aquifer is separated from the shallow aquifer by confining beds, but faults, fracture openings, or poorly constructed wells can connect the aquifers resulting in increased downward leakage. Evidence that this may be happening can be found in the Webb City area where a municipal well near a mine was abandoned in 1972 because of high mineralization of the water. In general, however, quality of water in the deep aquifer appears to be excellent and relatively unaffected by mine water.
Tailings Area Runoff
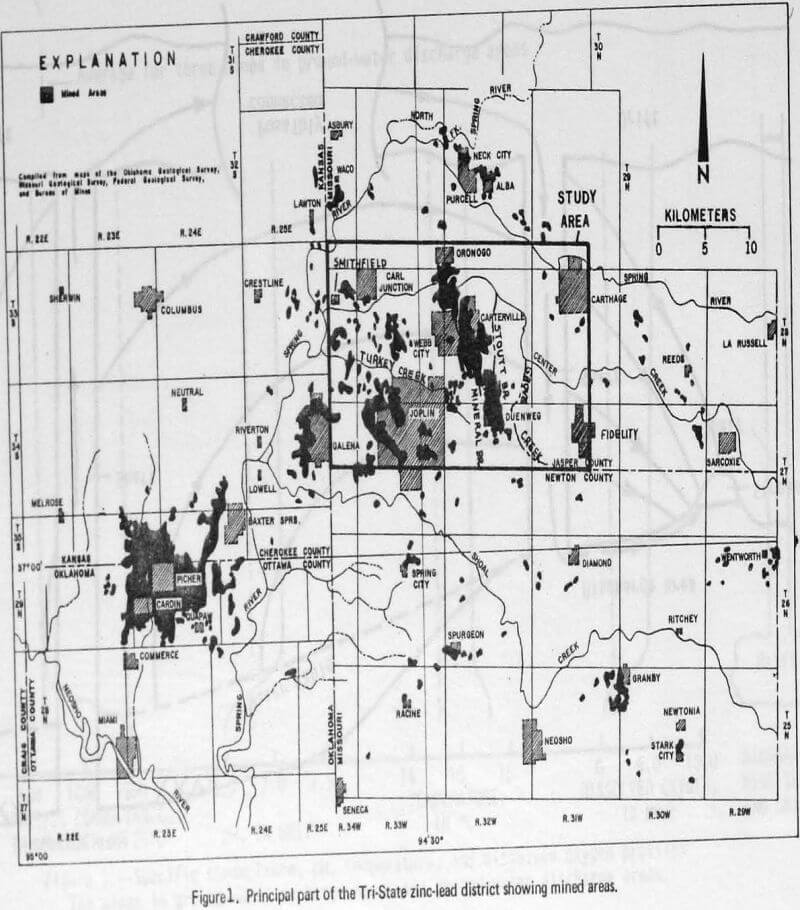
There are about 12 km² of tailings amounting to about 41 million m³ (cubic meters) in the Joplin area. About two-thirds of these are in the Center Creek basin. The distribution and size of tailings piles on the surface generally correspond to the distribution and size of mines beneath the surface. However, some of the ore was removed from the area for processing and some of the tailings have been removed and used for road surfacing and railroad ballast or ground into sand for sand blasting.
The greatest concentration of tailings piles is in the Oronogo-Duenweg mining belt which is about 3.2 km (kilometers) wide and extends from Oronogo to Duenweg, a distance of about 16 km. Outside the Oronogo-Duenweg belt the tailings piles are generally scattered and intermixed with woodlands and farmlands. Drainage from the Oronogo-Duenweg belt is primarily to Center Creek by way of Stoutt and Mineral Branches, which are both dry except during periods of heavy rainfall.
In eight reconnaissance samples of tailings seepage and runoff, dissolved-solids concentrations averaged 414 mg/L, compared to 134 mg/L for Center Creek upstream from the mining area. Dissolved zinc concentrations averaged 16,000 µg/L. The pH of the tailings runoff samples averaged 6.4, but in the sample with the lowest pH (3.5) maximum concentrations of dissolved zinc (35,000 µg/L), lead (1,400 µg/L), and copper (360 µg/L) were observed. Other metals concentrations were generally low:
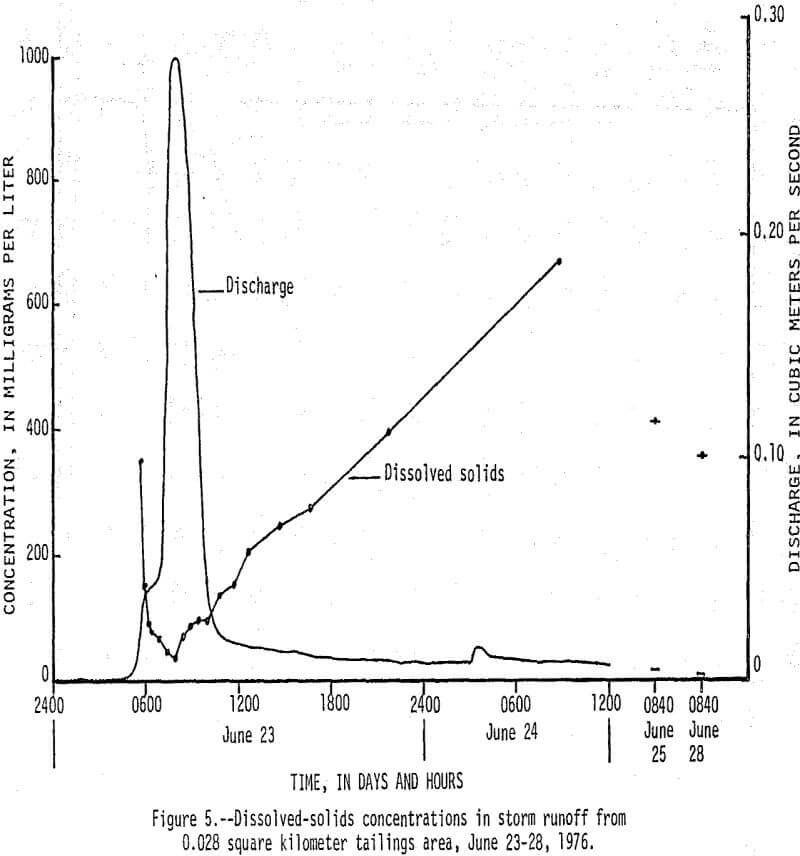
On June 23, 1976, between 0430 h (hours) and 1430 h, 13 cm (centimeters) of rain fell on a 0.038 km² tailings area that had been selected for storm-runoff sampling. Runoff from the area increased from 0 m³/s (cubic meters per second) at 0430 h to a peak of 0.28 m³/s at 0800 h, then gradually decreased to 0.017 m³/s at 1220 h (fig. 5). Flow that occurred after 1220 h was mainly seepage out of a 70,000 m³ tailings pile, which continued for 9 days after rainfall stopped. There was an inverse relationship between the amount of runoff and the concentration of dissolved constituents in the water as shown by the dissolved solids and discharge graphs in Figure 5. Of particular significance are the high concentrations of dissolved zinc (fig. 6) which reached a maximum of 200,000 µg/L and lead and cadmium (fig. 7) which reached maximum values of 400 and 1,400 µg/L, respectively. The water had a pH of less than 5, but soon mixed with higher pH water in Stoutt Branch and the lead and cadmium quickly precipitated. Analyses of water-suspended sediment mixtures indicate that during storm runoff nearly all of the zinc is in solution, but large amounts of lead are sorbed to suspended sediment.
Effects On Streams
Center Creek, which has an average flow near the mouth of about 6.8 m³/s is the largest stream in the area that is affected by mine-water discharge and tailings area runoff.
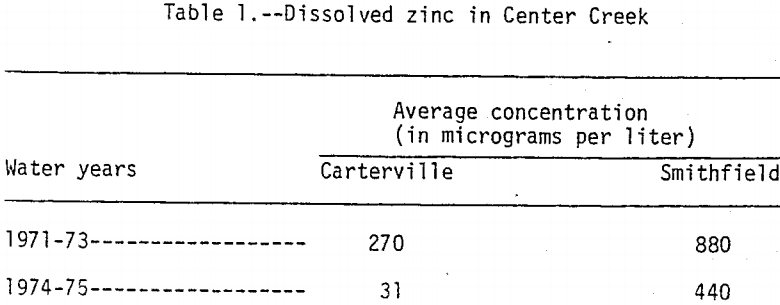
The station, Center Creek near Carterville is 30 km upstream from the mouth and is at the upstream edge of the mining area. The station, Center Creek near Smithfield is about 1.6 km upstream from the mouth and is downstream from the mining area. Dissolved zinc concentrations in water samples collected monthly from Center Creek near Carterville and bimonthly from Center Creek near Smithfield during water years 1971 to 1975, are summarized in Table 1. A water year is from October 1 to September 30. For example, the 1975 water year is from October 1, 1974 to September 30, 1975. The samples were collected during both low- and high-flow periods. During water years 1974 and 1975 dissolved zinc concentrations in water from Center Creek near Carterville were at or near background levels while dissolved zinc concentrations in water from Center Creek near Smithfield were consistently high. The higher concentrations at both sites during water years 1971 to 1973 were probably caused by pumping of mine water that eventually discharged into Center Creek upstream and downstream from Carterville. During low-flow periods the high zinc concentrations were caused by mine-water discharge, but during periods of high flow tailings area runoff was the main source. Concentrations of dissolved lead, chromium, and copper were uniformly low at both sites during the 1971 to 1975 water years.
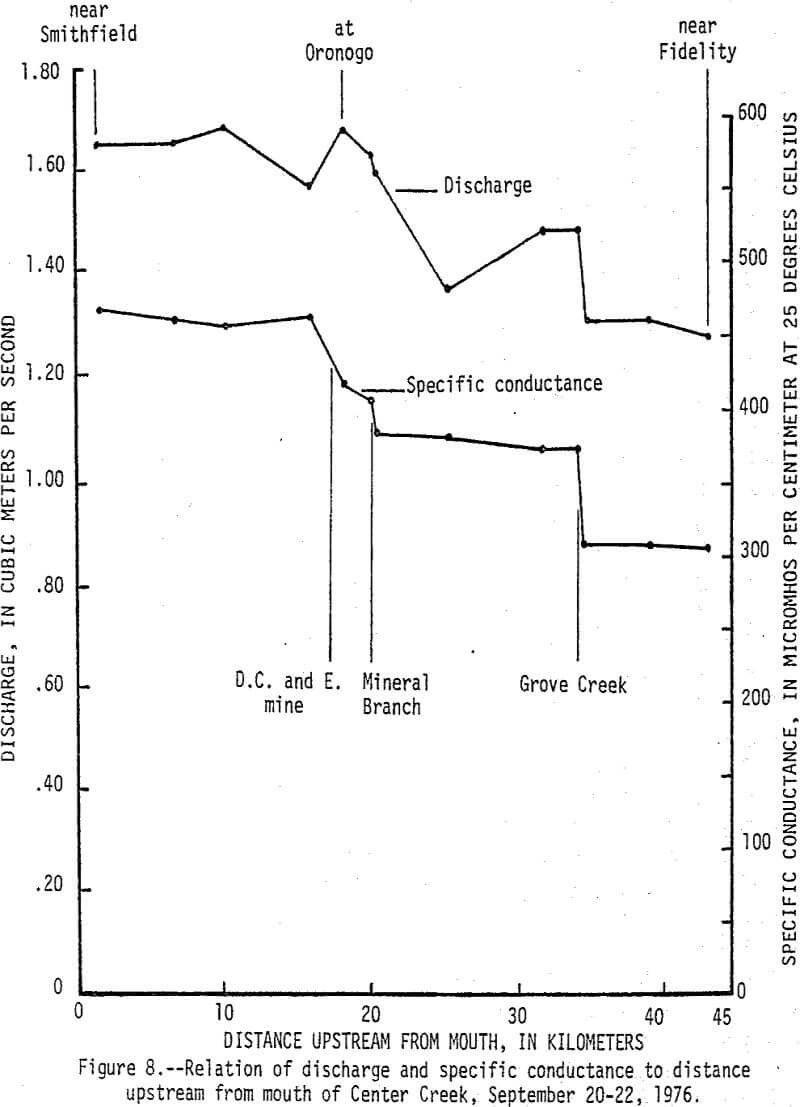
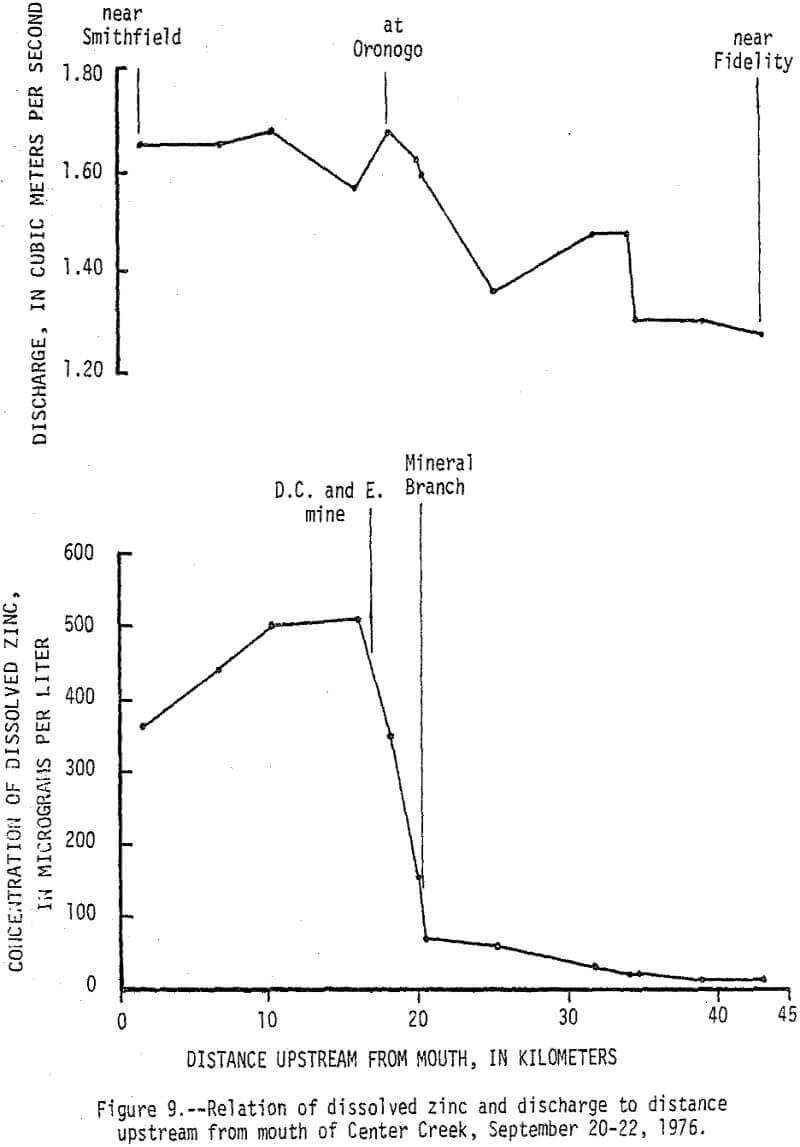
Data from a seepage run made on Center Creek September 20-22, 1976, delineates points and reaches where baseflow gains and losses and water-quality changes occur (fig. 8). At the time the seepage run was made the flow in Center Creek was about twice the 7-day 2-year minimum discharge. Specific conductance of the water in Center Creek increased from 305 µmhos/cm at 25°C (micromhos per centimeter at 25 degrees Celsius) near Fidelity to 468 µmhos/cm at 25°C near Smithfield. The difference is due mainly to sudden increases caused by surface inflow from Grove Creek, Mineral Branch, and the D. C. and E. mine and by ground-water inflow along a short reach upstream from Oronogo. The reach just upstream from Oronogo is in a swampy area and is the only place where mine workings cross Center Creek. The increases in specific conductance were caused mainly by increases in calcium and sulfate that, except for Grove Creek, were accompanied by significant increases in dissolved zinc (fig. 9). Dissolved zinc increased from a background of 40 µg/L upstream from the mining area to 500 µg/L downstream. Nearly all of the increase was caused by mine-water discharges from the Sunset mine and a nearby unnamed mine into Mineral Branch at Carterville that enters Center Creek 2.4 km upstream from Oronogo, subsurface seepage of mine water into Center Creek about 0.4 km upstream from Oronogo, and discharge from the D.C. and E. mine that enters Center Creek 0.6 km downstream from Oronogo.
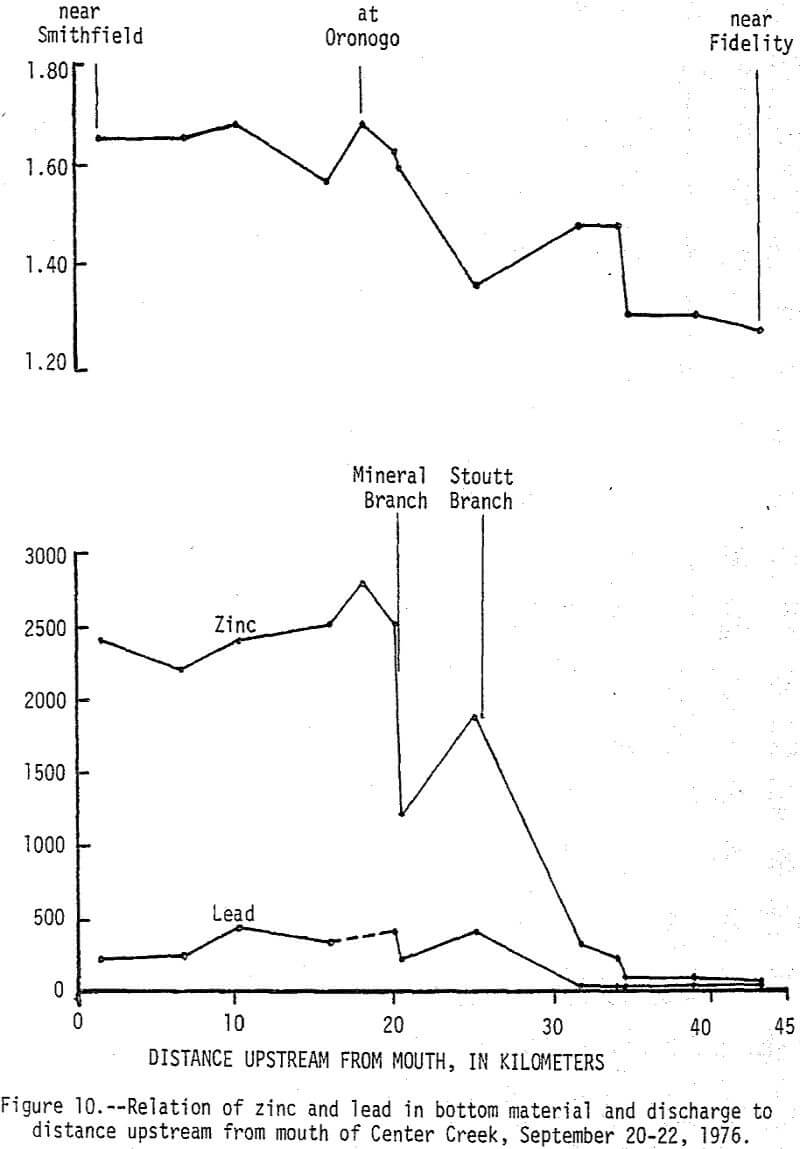
During high-flow conditions the high dissolved zinc concentrations are sustained by seepage and runoff from the tailings areas that are discharged mainly through Stoutt and Mineral Branches. Total zinc concentrations were usually about 30 µg/L higher than dissolved concentrations indicating most of the zinc is in solution, but some is associated with suspended sediments. Dissolved and total lead concentrations ranged from 1 to 29 and 5 to 59 µg/L, respectively, with no apparent increase downstream from the mining area. Concentrations of zinc in the bottom material increased from a background of 100 µg/g to about 2,500 µg/g and lead in the bottom material increased from a background of 20 µg/g to about 450 µg/g (fig. 10). These 25-fold increases occurred mainly downstream from Stoutt and Mineral Branches, and appear to be due to the depostion of tailings transported by these two branches during periods of storm runoff.
It is likely that the desire to control or limit environmental degradation was not as prevalent during the Tri-State District mining era as it is today, and the technology to do so certainly was not as advanced. The “New Lead Belt” in southeast Missouri (Wixson and Jennett, 1975) is an excellent example of how today’s environmental awareness, technology, and cooperation have combined to keep production of metals at a peak and environmental damage at a minimum. Results of the Joplin area study should serve as a general reminder of the continuing need to control waste discharges from active mining, as well as after mining has ceased.
