Table of Contents
Grinding with steel balls often adversely affects the flotation separation of sulfide minerals. This is due mainly to the galvanic interactions among different sulfide minerals and steel grinding media. Since rest potentials of sulfide minerals are much higher than those of steel balls, they are always cathodic to grinding media materials.
½O2 + H2O + 2e- = 2OH-………………………………………………………………….(1)
FeS + ½O2 + H2O + e- = Fe(OH)2 + S=…………………………………………….(2)
At a lower potential such as -0.955 V (vs. SHE), the hydrogen depolarization may take place.
2H+ + 2e- = H2…………………………………………………………………………..(3)

Experimental
The pyrrhotite sample (57.7% Fe, 38.5% S, 4.8% Ni, 0.09% Cu) used in this investigation was from Falconbridge Ltd.’s Strathcona mine in Ontario, Canada. The sample is monoclinic, and therefore, is a magnetic variety. High carbon low alloy (HCLA) steel (0.8% C, 1% Mn, 0.5% Cr, 505 HVN) was chosen to represent grinding media.
Electrode Potential Measurements
The working electrode was prepared from pyrrhotite by mounting a specimen into the bottom of a Lucite tubing (I. D. 1.2 cm) with epoxy resin so that a single face was in contact with the solution. The geometric surface area of the electrode was approximately 0.166 cm². The electric contact was made by attaching a copper wire to the back of the specimen using silver conducting epoxy cement. The electrode of HCLA steel was also prepared in the same manner as that of pyrrhotite.
Immediately prior to each test, the electrode was ground with a 600-grit silicon carbide paper and then polished wet on a metallurgical polishing wheel using 0.3 µm alumina powder. The freshly polished electrode was rinsed with distilled water and immediately transferred to the cell for electrochemical measurements.
Cyclic voltammetry was used to characterize redox reactions that occur at the pyrrhotite surface. The potential sweep started from rest potentials towards negative-going direction unless stated otherwise. The reason why the rest potential was chosen as the starting potential was to prevent any electroactive species in the samples from going into solution. The sweep rate was fixed at 0.05 V per second. In some tests, the agitation was provided by vigorously bubbling nitrogen near the pyrrhotite electrode.
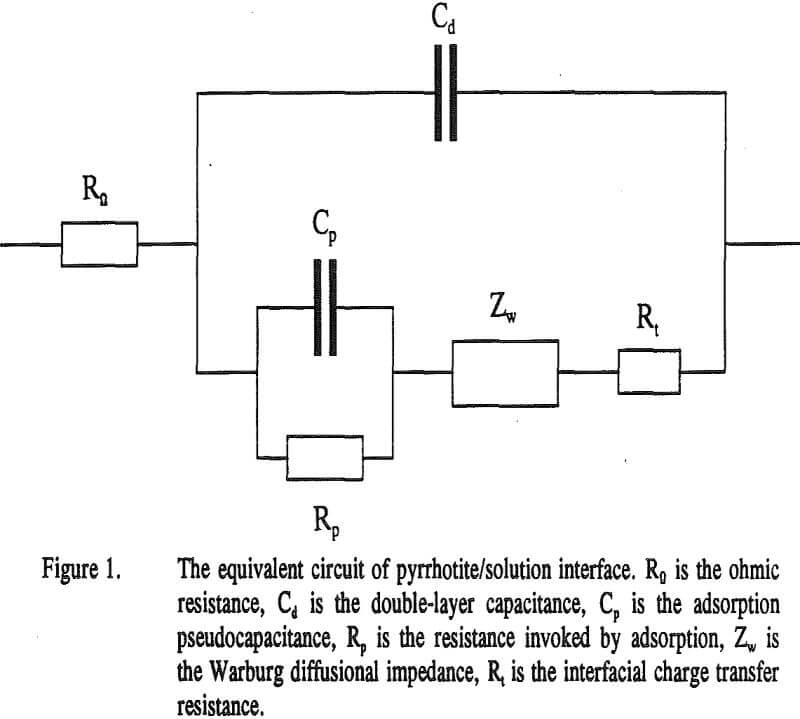
The equivalent circuit used to analyze the impedance results is presented in Figure 1. The circuit was selected after trying several models. In the circuit, Rn is the ohmic resistance representing the sum of resistances of the solution, the electrodes and the leads toward them. Cd is the double-layer capacitance, Cp is the adsorption pseudocapacitance, an indicator of the adsorbed surface films.
q = γθ……………………………………………………………………………….(5)
where γ is the charge corresponding to a complete monolayer, and θ is the fraction of adsorption (or discharge) sites on the surface that are covered at a given time. The capacitance due to the variation of q with potential is given by
Cp = γ(∂θ/∂E)………………………………………………………………….(6)
Rp is the resistance invoked by adsorption, is the Warburg diffusional impedance given by
Zw = σ(1-j)ω-½………………………………………………………………………….(7)
where σ is the Warburg coefficient, ω is the angular frequency and j= √-1. Rt is the interfacial charge transfer resistance.
Micro-Flotation Tests
For each flotation test, 1 gram of 74/105 µm (200/100 mesh) pyrrhotite sample was placed in a 200 ml flask which was filled with 120 ml of oxygen-free, 0.05 M sodium sulfate solution containing 10-³ M potassium ethyl xanthate (KEX). After conditioning for 3 minutes by tumbling, the sample and the solution were transferred into the Hallimond tube.
Results and Discussions
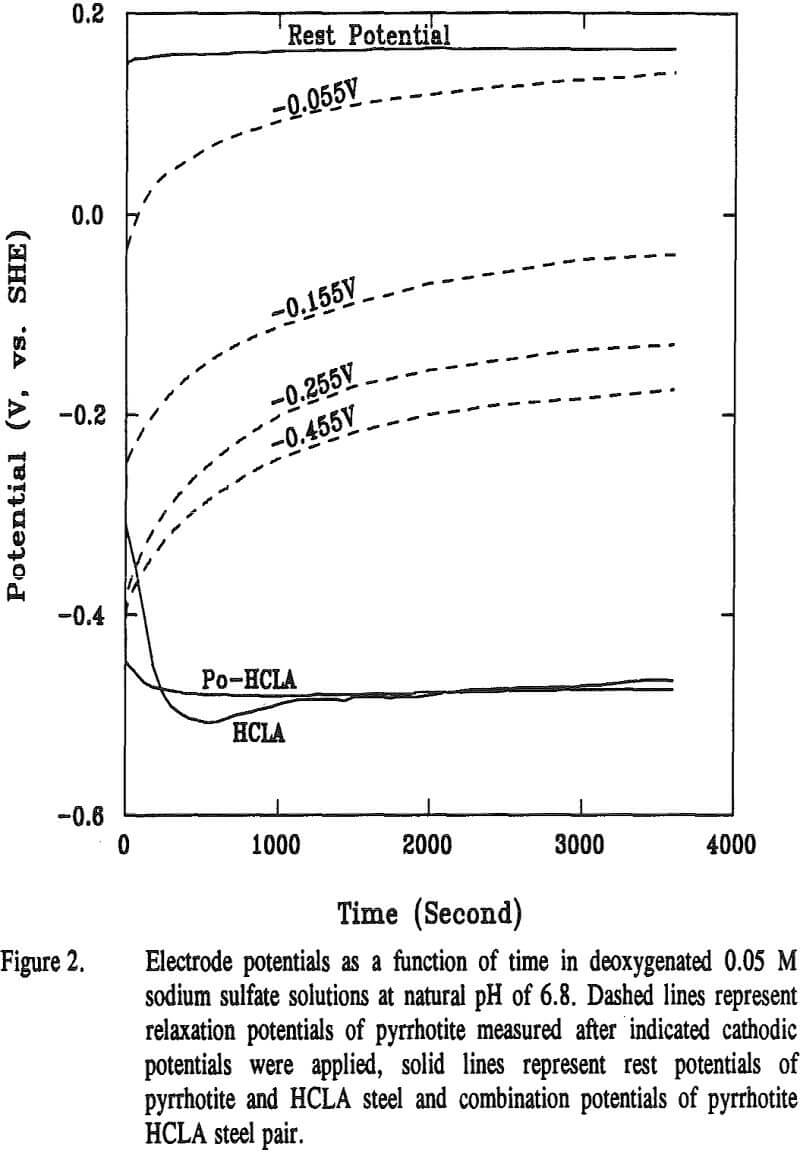
The relaxation potentials of pyrrhotite are compared with its rest potential in Figure 2. Also included are the rest potentials of HCLA steel and the combination potentials of pyrrhotite-HCLA steel. The combination potential markedly decreased to near the rest potential of the HCLA steel, implying that the interaction is cathodically controlled. The relaxation potentials were measured after different cathodic potentials, namely -0.055, -0.155, -0.255, and -0.455 V, were applied for 3600 seconds.
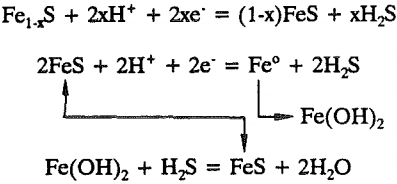
Fe1-xS + 2xH+ + 2xe- = (1-x)FeS + xH2S……………………………………………………………..(8)
The ferrous sulfide formed is further reduced to metallic iron according to

E = -0.364 – 0.059pH – 0.0295log[H2S]………………………………………………………….(10)
Fe(OH)2 + OH- = Fe(OH)3 + e-…………………………………………………………………(11)
E = 0.271 – 0.059 pH……………………………………………………………………..(12)
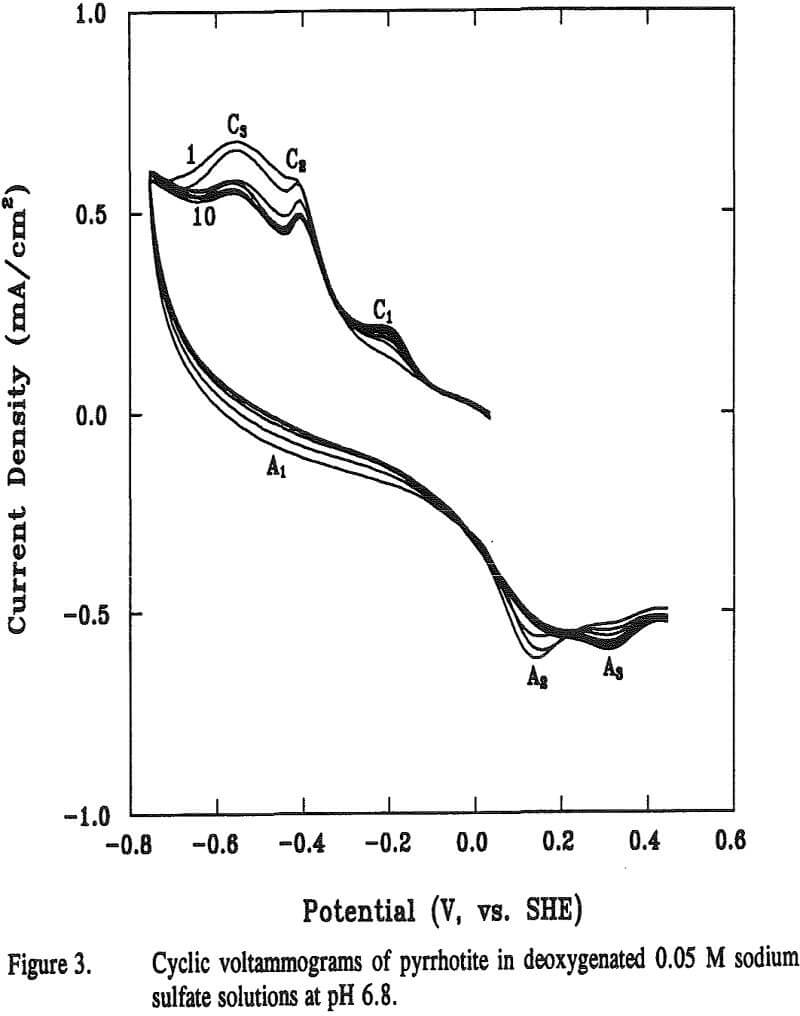
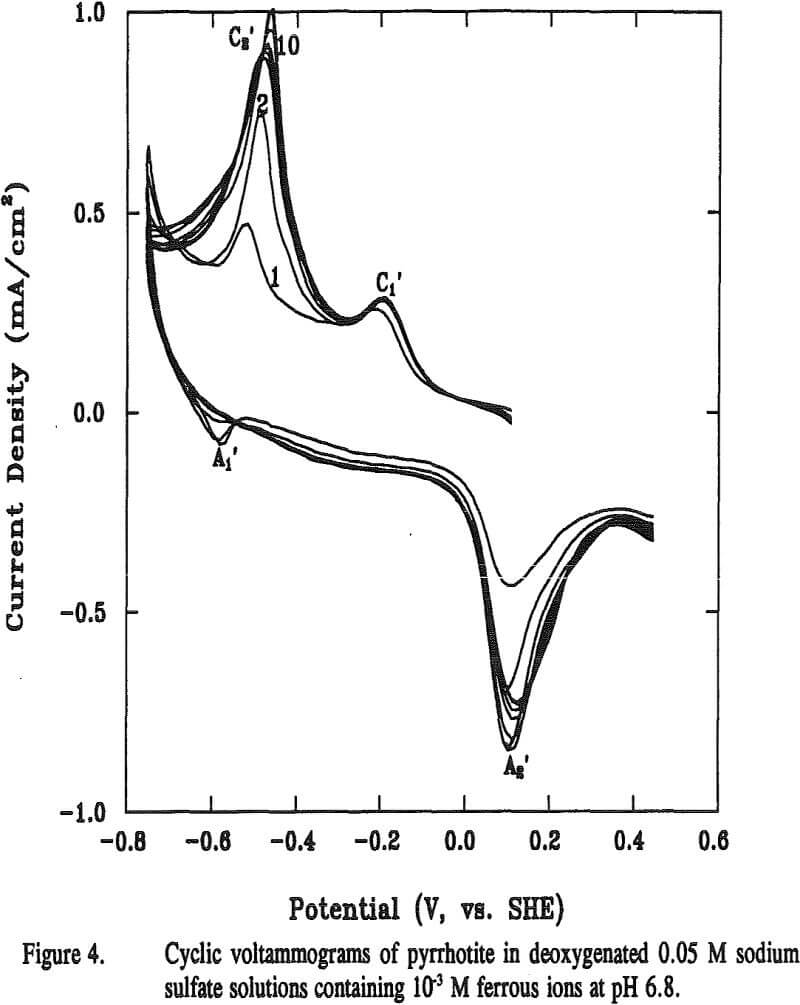
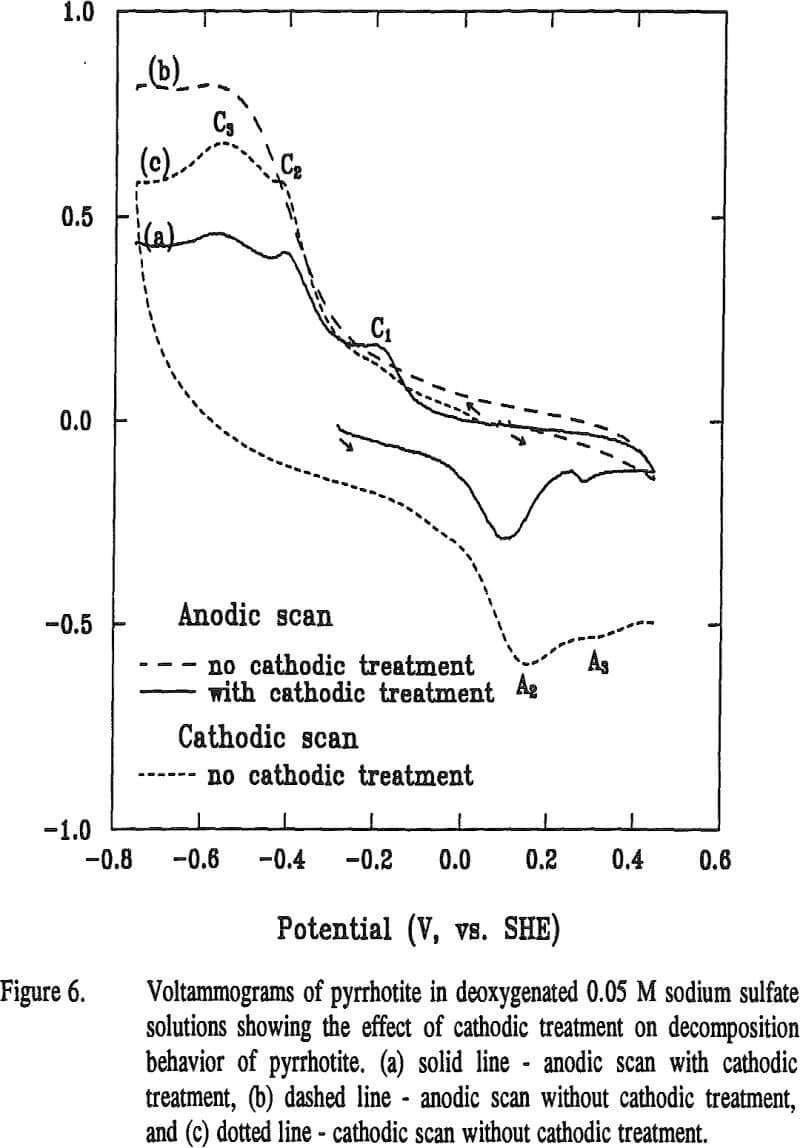
The reaction potential calculated according to Equation (12) is -0.13 V at pH 6.8. The calculated potential is located within the range of the starting potentials for both peaks C1 and A2 in the voltammogram. The appearance of the broad peak A1 may be attributable to the oxidation of metallic iron formed from previous reaction. Voltammograms obtained when final potentials were terminated either at -0.44 V (without going through C3) or at 0 V (without going through A2), respectively, showed no apparent peaks of C1 C3 and A2. These observations support the above assumptions that these three peaks are related.
Fe++ + 2e- = Fe°………………………………………………………………………..(13)
E = -0.440 – 0.0295 log[Fe++]…………………………………………………….(14)
Fe(OH)2 + 2H+ +2e- = Fe° + 2H2O……………………………………………..(15)
E = -0.047 – 0.059 pH…………………………………………………………………(16)
The charge corresponding to surface species, Qs can be calculated using an equation
Qs = Qt – Qnf………………………………………………………………………………………..(17)
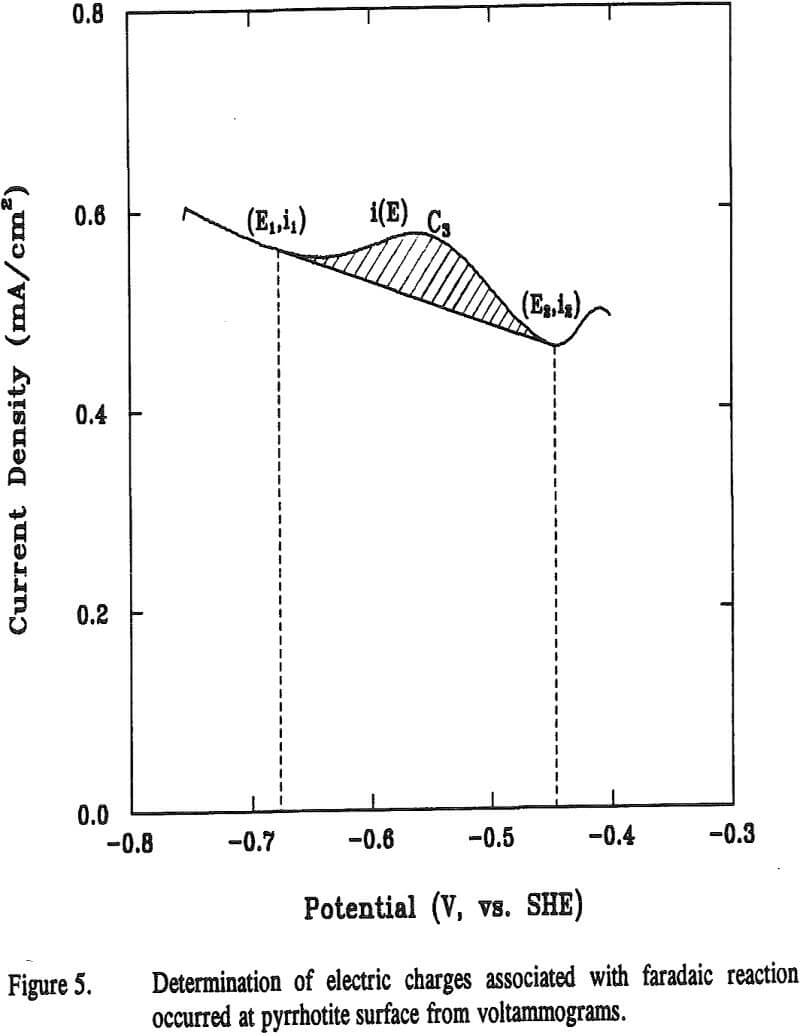
The potential sweep rate was 0.05 V per second, i.e., dE = 0.05dt. The shaded area in Figure 5 was obtained by integrating the curve i(E)

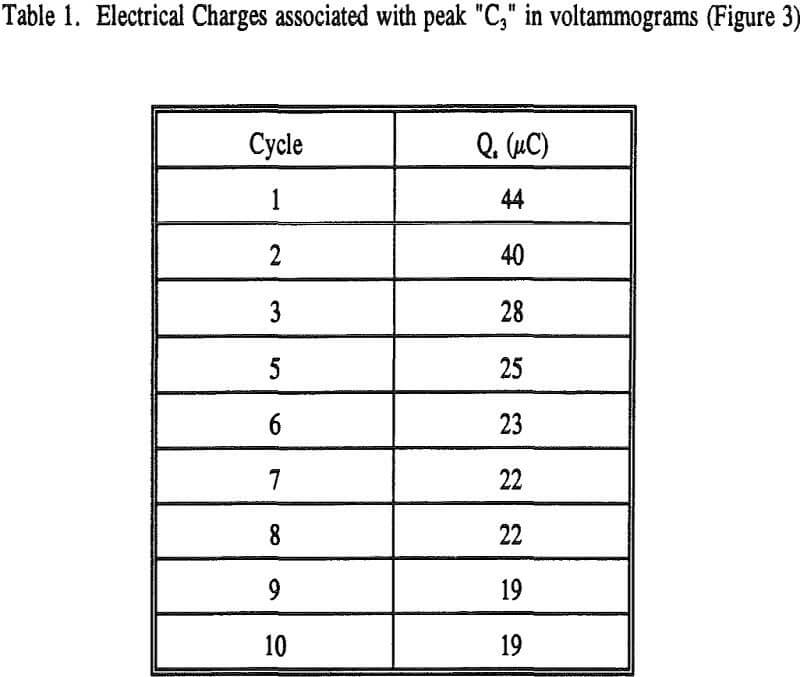
where A is the geometric area of the electrode. The results calculated from the voltammograms are given in Table 1.
The area of one iron atom
AFe = 2πrFe² = 2.51 x 10 -15 cm² / Fe atom
The total number of iron atoms occupying the electrode surface with an exposed area A = 0.166 cm²
using the Avogadro’s number of 6.024 x 10 23 atoms / mole.
The charge required to complete a monolayer of iron
QFe = nFN = 2.12 x 10 -5 C = 21 µC
AC Impedance Studies
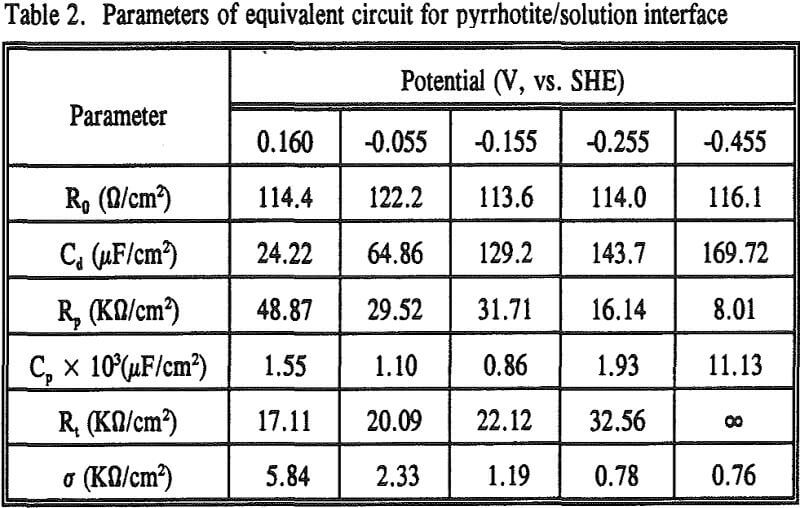
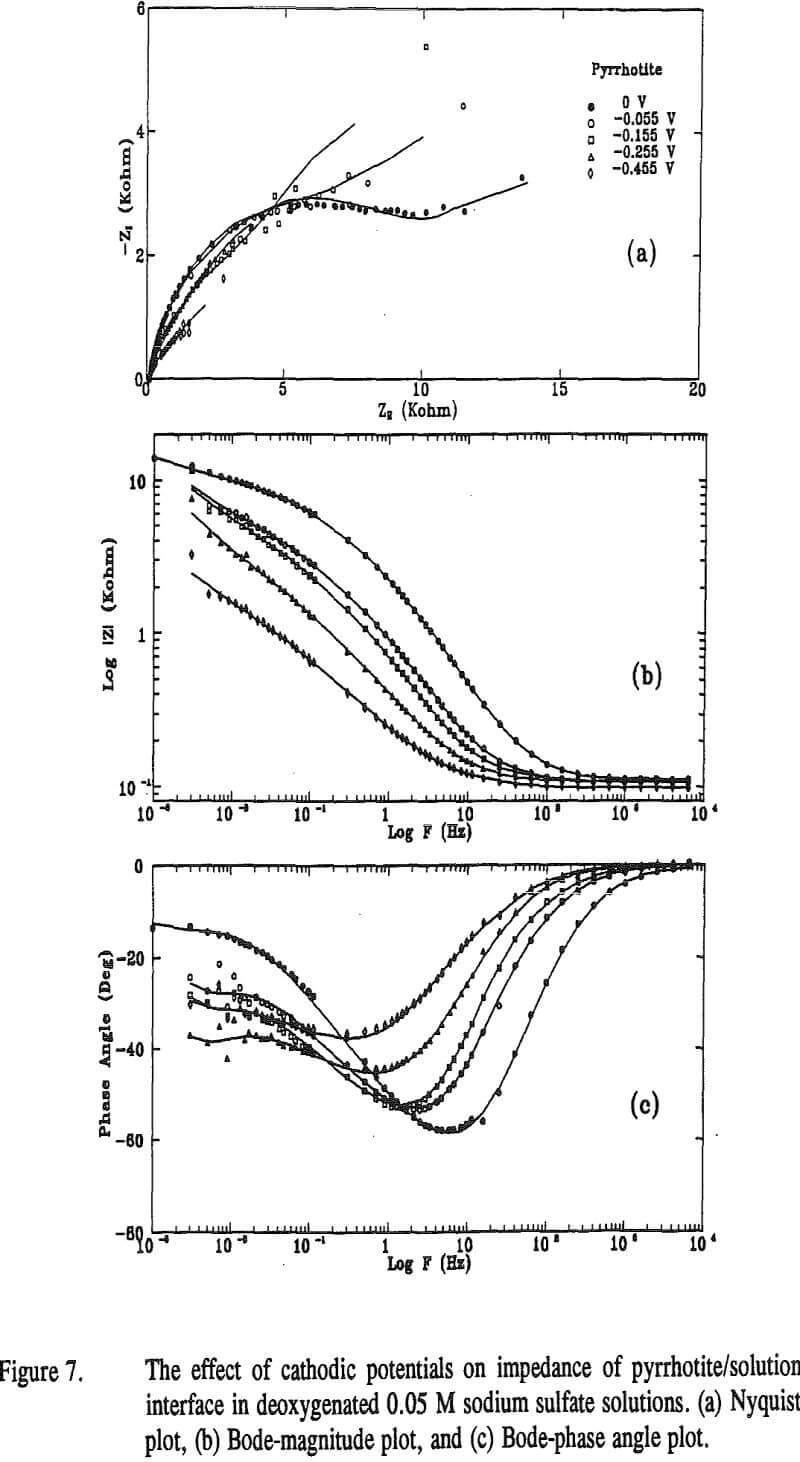
To study the effect of cathodic treatment on pyrrhotite/solution interface, impedance measurements were carried out at the rest potential of pyrrhotite and after applying several potentials of -0.055, -0.155, -0.255 and -0.455 V. The impedance results are shown in Figure 7 as Nyquist plot (a), Bode-magnitude plot (b) and Bode-phase plot (c), respectively. The points in the figure represent the experimental data, and the solid lines represent the fit lines obtained by the NLLSF technique.
Fe(OH)2 + H2S = FeS + 2H2O…………………………………………………………(20)
The free energy change for Reaction (19) is ΔG° = -14.59 kcal, and therefore the reaction is thermodynamically favorable. Evidence is also given by the change of σ values. σ decreased first with a decrease in potential, then remained virtually unchanged when cathodic potentials of -0.255 and -0.455 V were applied.
Surface Analyses
Depth profiles of elements by AES for a cathodically treated pyrrhotite show that the amount of sulfur decreased, whereas the amount of oxygen increased. The ratio of Fe:S changed from 0.71:1 to 2.14:1. After one minute of sputtering, the amounts of sulfur and oxygen for the cathodically treated pyrrhotite were the same as untreated pyrrhotite .
Micro-Flotation Tests
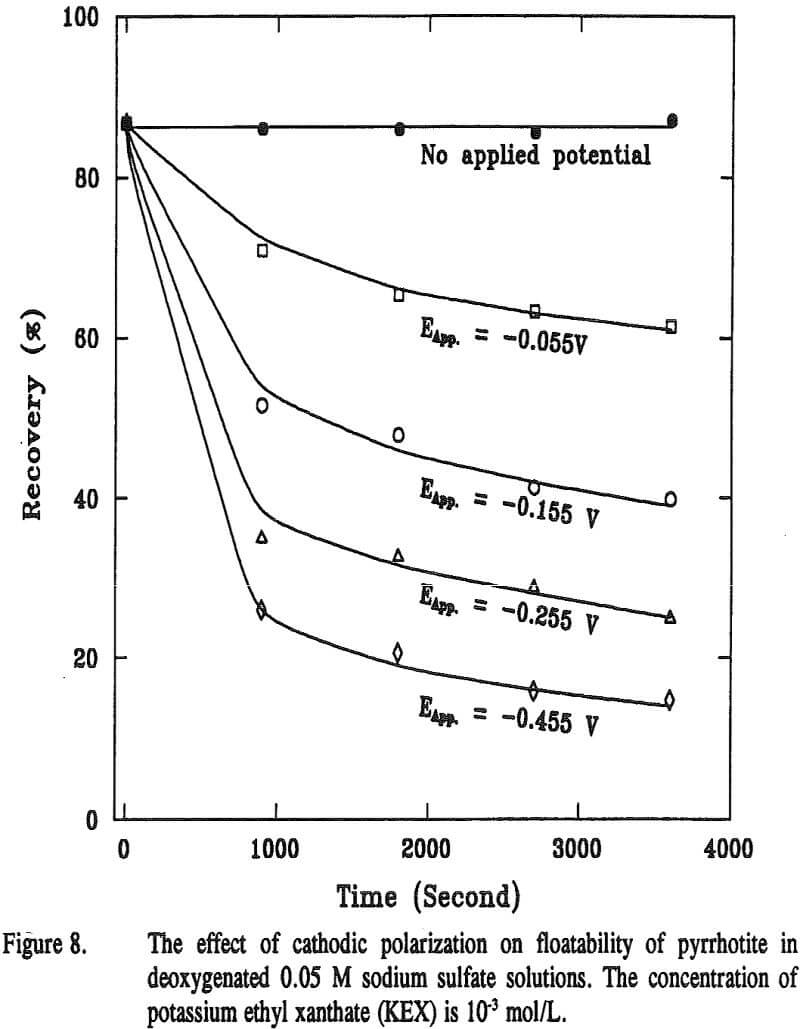
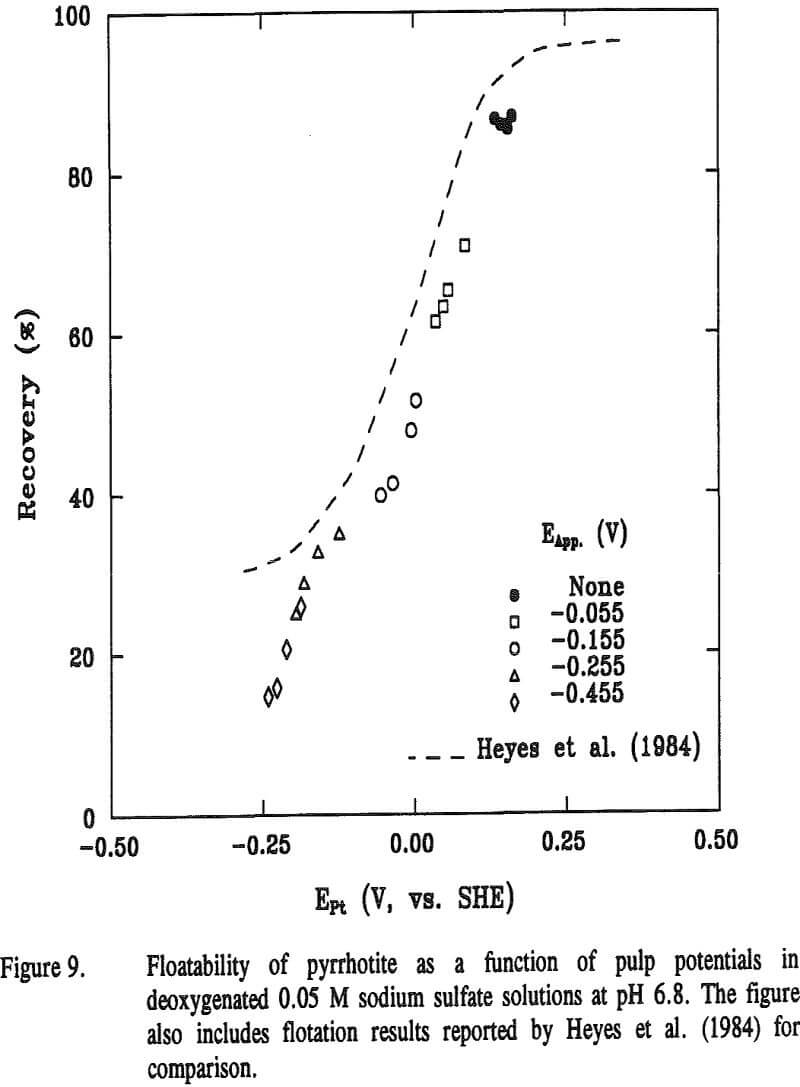
The micro-flotation tests of pyrrhotite were performed using 10-³ M KEX with and without cathodic treatment, and the results are presented in Figure 8. It is evident that the pyrrhotite floated well in the presence of the collector without cathodic treatment. However, the floatability of pyrrhotite decreased with cathodic treatment. The more cathodic the potentials applied and the longer the time used for polarization, the lower were the recoveries.
The cathodic decomposition mechanism clarifies the adverse effect on the flotation responses of sulfide minerals due to the electrochemical interactions among different minerals and grinding media.
Summary
Electrode potential measurement results indicated that the pyrrhotite-HCLA steel interaction was cathodically controlled, and the significant changes occurred at the surface of pyrrhotite after cathodic treatment. Like chalcopyrite, pyrrhotite decomposed cathodically when contacted with HCLA steel, but its cathodic decomposition behavior was more complex than that of chalcopyrite.
