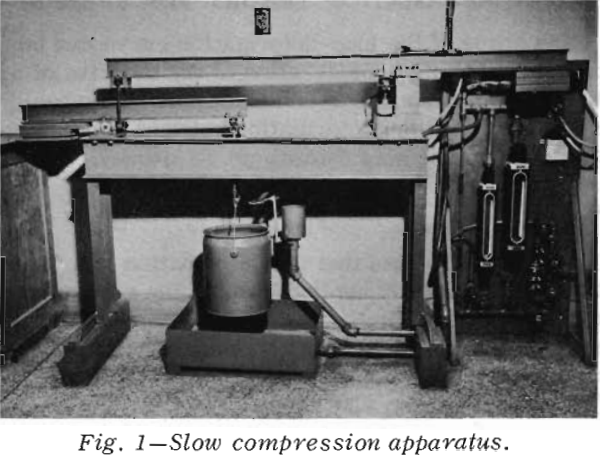
A unique compression testing machine was constructed to load individual 1/8 to 1-in. spheres of glass, etc., at rates from 100 to 100,000 lb per min. During loading the applied load was continuously plotted vs the deformation of the sphere-platen system. The load-deformation curve conforms to the theory of elasticity.
The data shows.- 1) Energy input per unit mass is inversely proportional to the product size modulus (or directly proportional to the surface area per unit mass). 2) Increased loading rates slightly increase the energy input per unit mass required for fracture without affecting the preceding relationship.
Apparatus
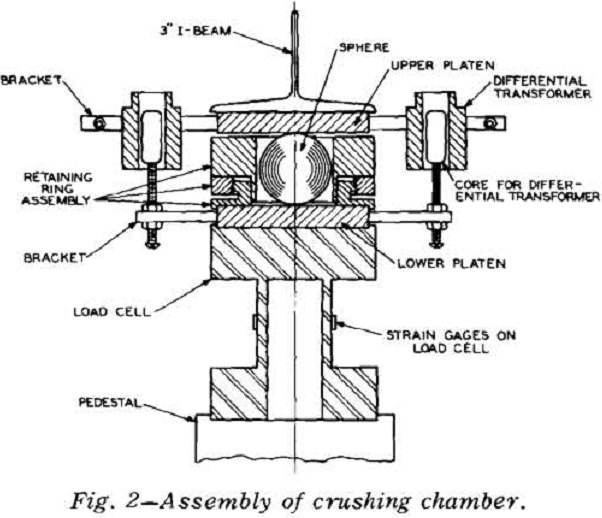
The experimental apparatus was designed to apply a compressive load on opposite sides of an “ideal particle.” Spherical shapes were chosen, because point contact loading is typical of the mechanics of conventional crushers. The bulk of the experimental data was obtained with glass spheres because glass is a fairly homogeneous, brittle material for which the properties follow definite statistical distributions. The spheres ranged from 1/8 to 1-in. diam.
Load-Deformation Theory for Spheres
The shape of the load-deformation curve can be predicted from a consideration of the theories of Hertz as summarized by Timoshenko. Timoshenko shows that the deformation between two curved surfaces

This equation states that the deformation is a function of the mutually applied load, P, the respective radii, R1 and R2 in the case of the sphere-platen system, the platen is a curved surface of infinite radius) and the respective physical properties of Poisson’s ratio, v, and Young’s modulus of elasticity, Y. The deformation is therefore proportional
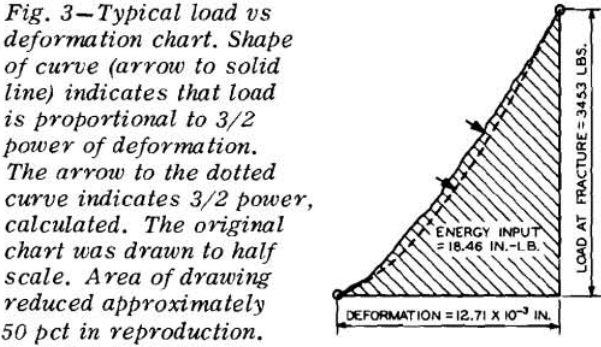
to the 2/3 power of the applied load, or conversely, the applied load is proportional to the 3/2 power of the deformation. The energy input, Ea, which exists when a load P causes a deformation Δ is given by the integral of the load acting through the appropriate distance
Ea = ∫PdΔ……………………………………………………………………..[2]
An expression for dΔ can be given in terms of P from Eq. 1. This allows the integral to be evaluated between the limits of O and P. The test sphere, however, is loaded at not one but at two points of contact, i.e., at both ends of a diameter, and hence the total energy input, E, is twice the energy input at each end or

where the radius of the sphere is given in terms of the mass, M, of the sphere and the density, ρ. The energy input to the system calculated from this equation corresponds to the energy measured from the area under the load-deformation curve. A transposition of terms in Eq. 3 yields

where H is a constant for a given set of physical constants, v, ρ, and Y.
Testing Procedure
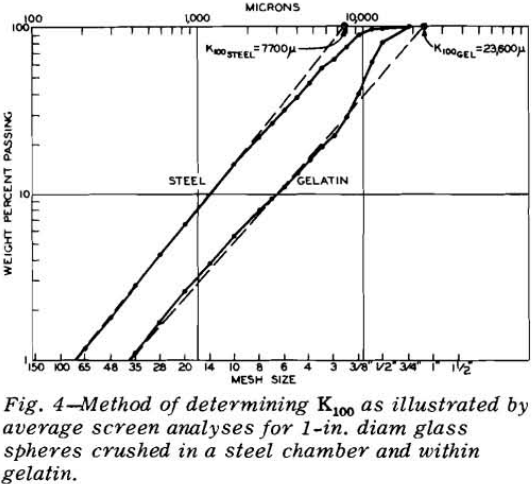
A series of ten or more spheres was broken by slow compression at each operating condition. Each sphere was either placed inside but not contacting a steel retaining ring assembly, or it was molded within a gelatin retaining ring. The sphere in its retaining ring was centered between the platens. Load was then applied until fracture occurred. After each sphere was broken, the fragments were carefully removed from the retaining ring assembly and the size distribution was determined.
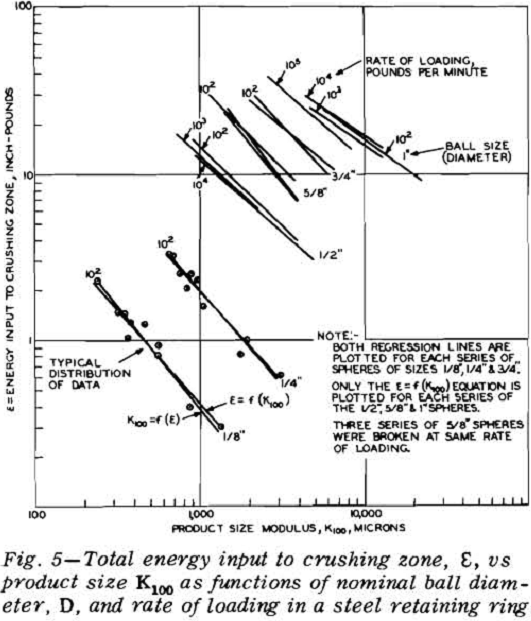
The energy input for each ball was determined by graphical integration of the load-deformation chart. The level of energy input was then plotted against the fragment size modulus on log-log paper.
Energy-Input Product Size Equations
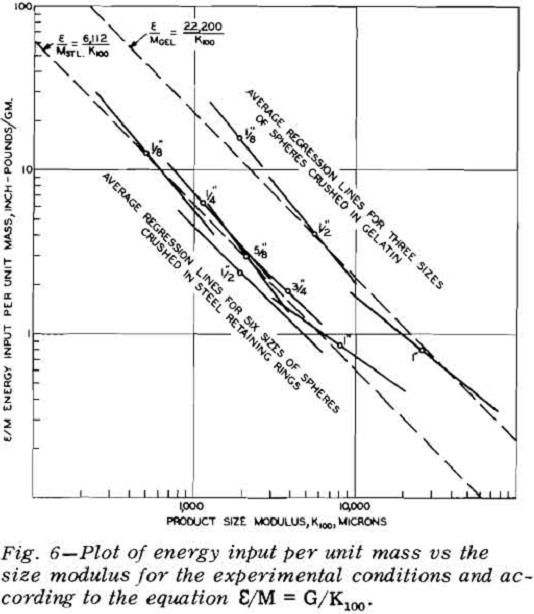
It was observed on the energy-product size charts that the slopes of all the plotted lines were very close to minus unity, and that a slope of minus unity would satisfactorily describe each relationship. The location of the plotted lines for spheres of different sizes crushed in steel retaining rings were displaced from each other by some function of the sphere size or mass. Similar displacements were noted for the spheres crushed in gelatin. Consequently the data were replotted as energy per unit mass against product size modulus.
A statistical test shows that there is no significant difference in the slopes of these lines and that neither is significantly different from a value of -1. Therefore, the assumption appears to be justified that the true slope of an infinite population would be minus unity. The equations, when written with a
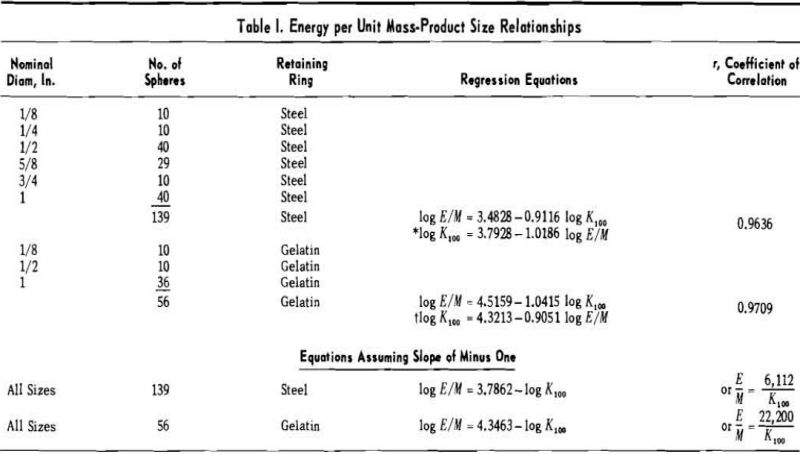
slope of minus unity and transformed to arithmetic coordinates, are E/Msteel = 6,112K100 and E/Mgel = 22,200/K100 for which 95 pct of the values on one axis should lie between 92 and 109 pct of the corresponding value on the other axis. These relationships, in the form E/M~ 1 /K100, state that the energy input per unit mass varies inversely as the product size modulus.
Comparisons With Published Data
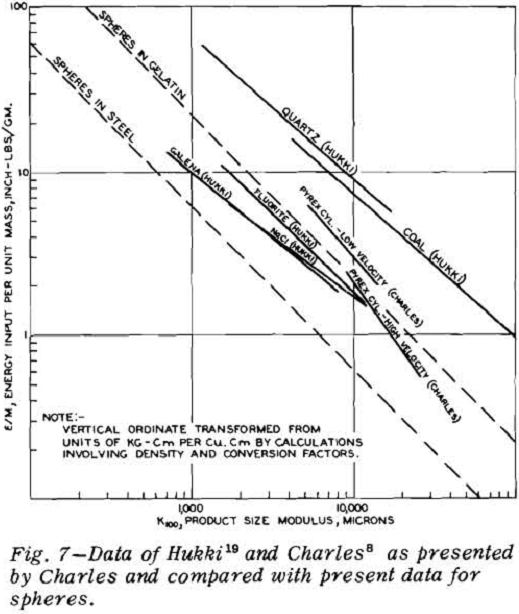
Much data in the literature can be plotted in a form which shows that it conforms to the relationship that energy input per unit mass is inversely proportional to product size modulus. For example, Charles presents some impact data of his own for pyrex and also presents some of the impact data of Hukki for a variety of minerals.
