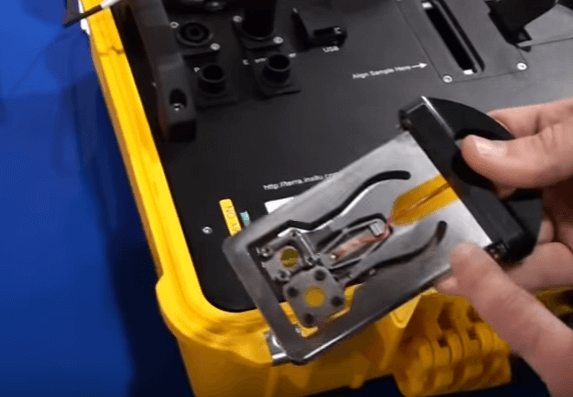
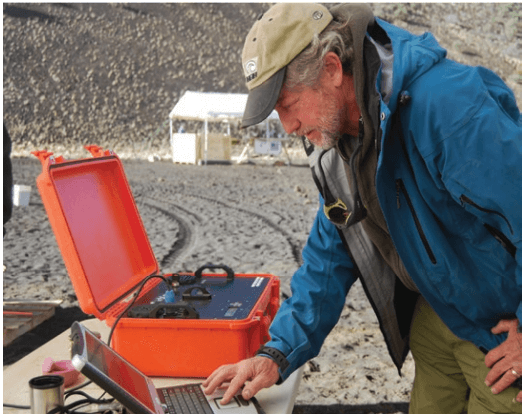
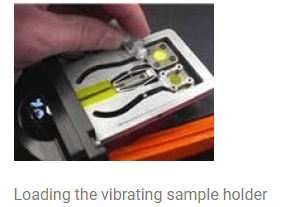
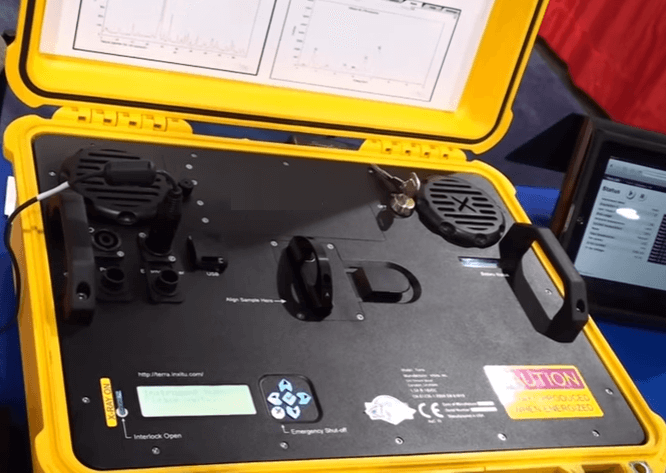
This XRD Analyzer is the world’s first truly portable X-ray diffractometer. Most X-ray diffractometers are very large instruments that take up most of the laboratory. This is the laboratory instrument that you can bring with you in the field. It runs on 4 lithium-ion batteries and it weighs about 15 kilograms. The instrument’s really easy to use. Everything is stationary, so you can actually move it around and it can go into rugged environments. It has an X-ray tube and a 3-dimensional detector, and that allows us to get very quick diffraction patterns that somebody can take in the field and then download to a PC and analyze. As far as sample preparation goes in the field, take a rock sample of any kind, crush it down and sieve it out to 100 mesh. Once you have that loose powder, you can take it and load it into the sample holding device. A little bit of powder into here, about 15 milligrams. It will fall down between some Mylar windows and it will move around inside. The external shaker, allows the sample holder to vibrate and for the sample to move around inside the instrument. So from the top panel here, you get to go ahead and load some sample in and you will see, the sample is loading down into that yellow window. And it moves around inside, giving us a random orientation of the crystal lattice. And that’s very key for XRD. XRD is based on seeing all aspects of the crystal lattice. And when you have that random orientation, you can get rid of any kind of preferential orientation and get a very clean, full XRD pattern. Once it’s loaded, you can stop it, insert it back into the instrument and start an acquisition just by hitting Go to start up the instrument. You’ll see that it’s all safely contained in here, there’s no need for a cooling system or anything else like that. It has X-ray lights that will show up right here and you see a bit of information about how the acquisition is taking place.
After about 15 seconds, we have our first diffraction patter and right now everything’s being saved on the on-board computer on the instrument. At any time you can wirelessly view the information and download it to their PC or iPad connected to the instrument. By clicking the Data tab and you can see the first diffraction pattern showing up. The machine constantly will take a picture of 5-55 degrees of data and every 15 seconds you saw now update, and every 15 seconds it will update, it will get better and better, peak the background ratios and less noise overall. So that allows it to get diffraction patters at a fraction of the time a large system would have to move around.
And how much on-board memory is there with the Terra? Like how many samples could it remember you having analyzed?
The samples are saved as simple text files and these text files are only a few kilobytes large, so you can save literally thousands of samples.
Product gallery
How long do the batteries last? How much work could you do with the Terra before you’d have to take it back to recharge?
You can actually run for 7-8 hours depending on how much actual use is going on.
Is it mainly designed for geological type samples that type of thing?
It’s designed basically for everything you can think of for XRD. Terra lends itself very well to geologic samples, however any kind of pharmaceutical samples to oil and gas explorations and mining, to nanoparticle engineer particle analysis. Just about anything you’d think of that would need XRD for.
What’s the resolution of this compared to a typical sort of large laboratory type instrument?
Completely comparable. One of the nice things about using our 2-dimensional detector is that we get the same kind of resolution that you get from a large instrument. And we get it that much faster because we can analyze every 15 seconds.
PORTABLE XRD/XRF FOR MATERIAL ANALYSIS
Self-Contained X-Ray Diffraction and X-Ray Fluorescence Instrument
Patented Technology
Initially conceived to perform chemical and mineralogical testing for NASA’s Mars Science Laboratory (MSL) mission, Olympus’ Terra is a rugged, fully portable field instrument which harnesses advanced dual XRD/XRF technology and renders it for earth-bound applications. Combining both Olympus and NASA innovation, Terra brings to life a new way of performing X-ray diffraction and X-ray fluorescence measurements.
Using a specifically developed direct excitation charge coupled device (CCD) “camera”, Terra is able to collect X-ray photon data for both X-ray diffraction and X-ray fluorescence simultaneously. This is the result of the integrated camera’s ability to detect both photon position and photon energy at the same time. With energy resolution of ~200 eV (5.9 keV), Terra makes XRF analysis as simple as viewing the software spectrum display.
Easy Sample Preparation
TERRA radically simplifies sample collection for your X-ray diffraction experiments. Typically, a sample must be finely ground and pressed into a pellet in order to ensure a sufficiently random orientation of the crystals.
TERRA’s patented sample vibration chamber eliminates this issue. Requiring a mere 15 mg sample, the vibration chamber’s convection process presents the instrument optics with multifarious orientations of the crystalline structure. This results in a superb X-ray diffraction pattern, virtually free of the problematic preferred-orientation effects encountered when using classic preparation methods.
Due to its unique powder-handling system, nonmechanical goniometers, and lack of complicated moving parts, TERRA is extremely well suited for those applications where field portability and/or ease of use is at issue.
XPowder Software
Terra is shipped with the necessary software (XPowder) for processing the resulting X-ray diffraction data. This includes the AMSCD mineral database. Should the user wish, XPowder provides the ability to use the ICDD Powder Diffraction Files (PDF).
For quantitative analysis, XPowder comes complete with reference intensity ratio (RIR) quantitative analysis methods as well as full-pattern analysis tools.
Furthermore, Terra provides XRD pattern data in a variety of file formats, making XRD pattern interpretation in third-party programs easily accessible.
Connectivity
Terra operates off software embedded in the unit itself. The user accesses the operating system through a wireless connection (802.11b/g). This remote operation method allows for a wide degree of flexibility in controlling the instrument and subsequent data handling.
PORTABLE XRF ANALYZER SPECIFICATIONS
How easy it is to get good quantitative mineralogy fast?
The first step is to powder your sample. This Portable XRD Analyzer only require powder to be as fine as less than 150 microns, which means preparing a sample is as easy as giving it a quick crush and a sieve or throwing it into a portable mill. As our instrument only requires 15 milligrams of sample, you have the flexibility of either bulk or selective sampling. Once you have the sample in place in the vibrating sample holder, press start acquisition.
While running your samples, you can view the diffractor grain and XRF spectra in real time by connecting to the TERRA with your computer, tablet, phone or any other device with Wi-Fi connectivity. Once finished, the pattern is downloaded and ready for analysis using the Siroquant software.
When doing routine analysis in Siroquant, it’s best to have a template task set up with all the expected minerals present. If you are dealing with unknown samples, you will need to check the phases present by analyzing the pattern in XPowder or another search and match software package. Here I am running an iron ore sample with four expected minerals preloaded. After opening the pattern, the first step is to remove the background like so. Then I click here and all the preselected minerals are loaded and combined into the red pattern you can see.
Looking at my screen, you can see there are no peaks in yellow which are unaccounted for. So it doesn’t appear at this stage that there are any minerals missing. To check it for the preselected minerals are present, I can look at the pink position bars by clicking here to turn them off and on. Next we check whether the pinks are aligned for each mineral phase, and when we find a mineral which could benefit from some repositioning, we simply select the position parameters all at once and press go. Now we can check the quantitative results in this window here and press copy and paste the results in Excel and that’s it. We’ve gone from a rock to quantitative XRD analysis in no time at all.
XRD minerology and XRF analysis for advanced mudlogging with XRF and XRD basics
The development of field-based XRD and XRF instrumentation has really, in the past few years, extended the use of these technologies in this industry as an on-site tool. In effect, it has had a huge effect and the time it take the analysis, the cost of sending samples back to the main lab and the ability to make decisions in real time. I want to start with a basic introduction to XRD and XRF technology, and how they are similar and how they differ.
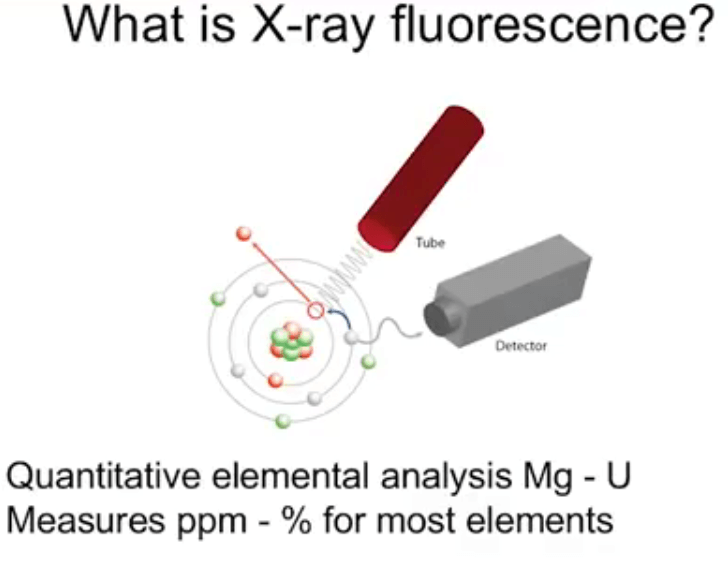
What is X-ray fluorescence?
Very simply put, X-ray fluorescence uses an excitation source to excite elements, electrons within an atom. This excitation will eject an electron from its orbital and there is a transition at that point from the next orbital and this transition releases an amount of energy. This energy is directly proportional to the amount of that element within your sample. Quantitative element analysis, typically magnesium-uranium. It can measure from the PPM level to percent level for most elements.
On this next slide, we’re showing the user interface. How the operator first sees the data output from the instrument. Consists of a graphic output, as you can see, and to the right-hand side of the slide, it also gives you elemental breakdown, concentration and statistical analysis. So that’s the output for X-ray fluorescence. Typically detection limits are shown on this slide here. Typically, detection limits will vary with simple matrix. But these are some general rules that you can apply. So now we move to X-ray diffraction.
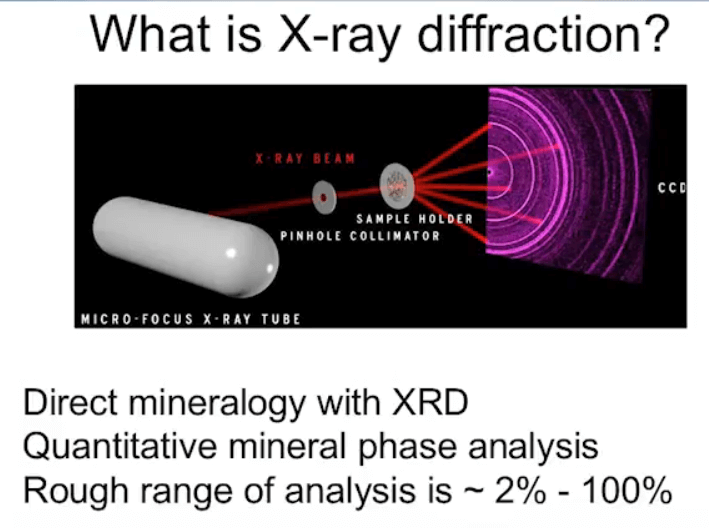
X-ray diffraction is a direct mineral…
PORTABLE XRD ANALYSERS
XRD is X-ray diffraction. And it’s a way of defining crystalline phases or minerals. So, where XRF may tell you you have 10% iron, for instance, XRD will be able to tell you what phase is the iron mineral in. For instance, magnetite, hematite. And the benefit of XRD compared to other methods of defining minerology is you can identify all mineral phases irrespective of reflectance. So, it can do sulfites, it can do feldspars, all silicates. And it can be used to not only identify minerals, but we can use XRD to quantify minerals also.
So, just basically, how does XRD work? Well, XRD works by firing an X-ray at the sample, and the angles at which the X-ray diffract are indicative of the mineral structure. It’s much like a fingerprint. Up the top, we can see quartz. There’s quartz, there’s the crystal structure for quartz, and there’s the diffraction pattern. Below, we can see cuprite. And there’s the crystal structure, and there’s the diffraction pattern. And the reason we showed both cuprite and quartz is cuprite is an example of a mineral which you would not be able to do with other reflective methods as it does not reflect a lot with infrared.
Moving on to conventional XRD instruments before we move on to portable XRD instruments, conventional instruments use a goniometer, which fires X-rays out of one arm, they hit the sample, and then diffract off, and hit a detector on the other arm, and the tube and detector will scan over to measure the angles of diffraction. They’re usually large, lab-based pieces of equipment. They’re energy intensive, so anywhere between two to four kilowatts. And they require an external water source. So they really are truly lab-based instruments.
In terms of sample preparation for lab-based instruments, typically we use pressed pellets. Your sample needs to be dry, less than ten micron, approximately 300 mg. And with lab-based XRD instruments, they make the assumption of both homogenous grainsize and random orientation. And down below, I’ve just got some examples where you can see we’ve got some grainsize heterogeneity, and it’s affecting the diffracting limit. And we’ve also got some examples of where we have some preferred orientation effects affecting subsequent quantitative analysis.
With conventional XRD system, your sample prep can take anywhere up to 15 minutes – longer if you need to micronize. Obviously, if you’ve been doing this for a while, your sample preparation will be a little bit quicker, but it’s still not something that you can do relatively fast.
That being the case, the guys from NASA needed to get XRD to Mars, but the issues were the conventional XRD instruments were too large, the sample preparation too onerous, and you weren’t going to get an astronaut up there to actually calibrate the machine. That being the case, they needed to develop an XRD which was light and rugged, without need for calibrations. And even though MSL Curiosity Rover was 900 kilos, the XRD that they’ve got on board, CheMin, is only 10 kilos. And this XRD works in quite a different way to the conventional refractive systems in that it uses a transmission-based geometry. And with this, the X-ray is fired at the sample, it transmits through, and keeps a CCD detector on the other side, which is measuring both X-ray diffraction and X-ray fluorescence. Now, I need to mention the XRF that is on board CheMin is only qualitative, so it will tell you you’ve got a fair bit of calcium present, for instance, but it won’t tell you how much in sort of BPM or weight percent, but it can be quite useful when you’re actually looking at a diffractogram and trying to rule out or identify what minerals may or may not be present. The benefit to having this fixed tube geometry is the fact that we don’t need to do calibrations on the instrument, because the geometry is fixed. That means if you take it out in the field, much in the same way that it’s sitting up on Mars, you don’t need to be thinking about when you’re sending it back for service et cetera.
That being the case, we move on now to the XRD instruments, the world’s only portable XRD. The sample prep is rapid and easy, as we’re going to go through it in a second. The instruments are energy efficient, so it uses as much energy as a desktop computer. And we don’t need to be getting regular realignment of parts, which means you can have it out in the field without needing to think of when you’re going to be sending it back.
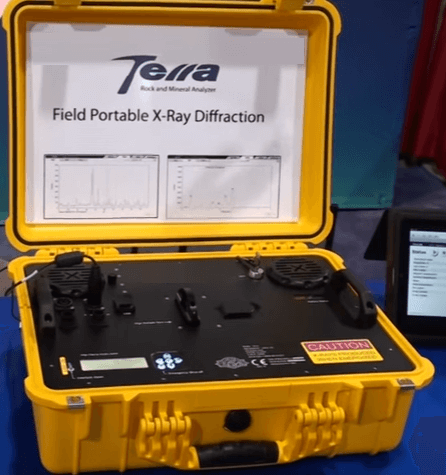
In terms of the instruments that we’ve got, we’ve got the BTX which is 12.5 kilos and the Terra Portable which is 14.5 kilos. Both instruments identical, which regards resolution, sample holder options. The only difference is the Terra is field portable,so you can take it outdoors into harsher environments. In terms of sample preparation, the XRD requires 15 mg of sample. So that gives you the flexibility of being able to bulk sample or do selective sampling, say, on an individual crystal or vein. You only need to give a quick crush in a sieve, and away you go. And we’re going to talk about more advanced sample preparation techniques in a second.
When we were talking earlier about conventional XRD instruments, we were saying how they recommend powdering quite fine, so preferably less than 10 microns, but ideally less than 80 microns. And the reason for that is we’re rotating the sample in one dimension with a lab-based instrument using reflectance geometry, so you want to get it as fine grain as possible to make sure you’ve got representative sample. You also want to alleviate grainsize and orientation effects that we were talking about earlier. So that’s why they recommend going down so fine. Whereas with our XRD instruments, because we’re vibrating the crystallites in front of the beam, we’re eliminating orientation effects. And we also have the equivalent of about a three micron grainsize out of 150 microns.
As I mentioned earlier, we’ve got more advanced field sample preparation methods using the hammermill you can see on the top right hand corner, to make sure you get good representative sample. And in terms of the instrument, the instrument has four hours portability. And if you hot swap the battery, you can obviously get longer than that. And they’re field ruggedized, which means you can take it out on the drill rig to be getting answers in real-time, or in the pit or at the mine that you’re working in. Our sample holder, as I mentioned earlier, with this way vibrating the sample, where we eliminate the need to rotate the tube and detector, which means we don’t need to do calibrations, but we also help to eliminate orientation effects by rotating the crystallites in ore orientations. With regards to power consumption and maintenance, the instrument uses as much energy as a desktop computer, so you don’t need to be worrying about where your energy is going to be coming from. And our tube life is very long. So assuming you use the instrument for 6,000 hours a year, the tube has a six year tube life, which is great for people out in the field.
With regards to what can be achieved with XRD, it can be used for both qualitative and quantitative mineralogical analysis. So, you can identify all minerals, like I said before, irrespective of reflectance at a detection limit of about one to two weight percent. And we’ll talk a bit more about the detection within a second. We can also quantify the amount of amorphous content within a sample. So, say for instance, you’ve got high chrysocolla bearing ores. We can quantify how mush amorphous content is present. And we can also look at crystallinity to have a look at fully dropped ratios with temperatures of depositions for the different minerals.
With regards to testing procedures, there’s no overall significant change with regards to the result of XRD with varying runtimes. What does vary with varying runtimes is the levels of detection. So, if you are looking for detection limits above five weight percent with simple minerology – say, two to three phases – this will only take you two minutes. Complex, sort of three to four, three minerals plus, you’re looking at about five minutes. And if you’re coming down to one to two weight percent, you want to go for about seven minutes for simple minerology, and about 15 minutes for something more complex. And I’ve just pulled this slide up here to give you an example. If you’re looking at the peak at 10 degrees 2-theta, that peak there is illite or muscovite. Now, for that mineral phase, it’s five minutes you can’t really tell whether that peak at 10 degrees is present or whether it’s noise, but once you start to get up to 10, 15 minutes, you can see that it is present compared to the lab-based instrument that’s down. So, the question of how long to run a sample really depends on what sort of question you’re asking in the field, and more importantly, what sort of detection limits you’re interested in.
In terms of data processing, there’s many different ways you can process X-rat diffraction data. Here, we’re just going to talk quickly about semi-quantitative analysis using RIR, RIR being reference intensity ratio. And RIR basically looks at the major peak for a given mineral phase compared to the most abundant mineral phase, and then how to look just at the peak high ratios to work out which is more abundant. And RIR is fine for semi-quantitative analysis, but when you start to get significant overlap, you really need to be running with Rietveld analysis, which is a method to do proper quantitative analysis. Rietveld analysis works in a similar way in that you’re sing database files, but it’s able to merge the different reference patterns together. And at the same time, you can refine for different crystallographic perimeters such as the orientation, the width, peak position et cetera. So, it’s a lot more powerful than RIR. There’s many software packages available that do great field analysis. We suggest Siroquant, because they’ve got a much better database for poorly crystalline material, which uses observed reference material so you get better quantification for that poorly crystalline material, which we often encounter in geologies such as the clays, iron oxide et cetera.
So, there is a little bit of a lag, but what’s going to be jumping up on your screen in a second is the comparison of RIR results to Rietveld results for porphyry copper deposit. On the image on the left, we’ve got RIR results for four to nine phases from a porphyry copper deposit. On the right, we have the exact same dataset process using Siroquant. And you can see that the results are much better on Siroquant using Rietveld analysis compared to the RIR method.
Now, I’ve pulled up this slide as well, just to show that if you process your data very quickly, just refining for your peak position in Siroquant, you would get pretty good results quickly, but you can massage the results, and get better results by doing a few other refinements, which take a little bit longer, but it really comes down to what sort of level of accuracy or precision you’re looking for with your dataset.
Moving now onto some applications and where minerology is important. Obviously, as geologists, the main way at the moment that we do mineralogical assessment on-site is by doing core-logging with a hand-lens. Alteration is typically fine-grained, so we often rely on color as a guide, but this can be quite difficult when you’ve got very fine-grained alteration phases, which we often do.
When it comes to petrography, another method which, obviously, is popular for identifying quantifying minerals. Petrography can become difficult, especially as I’m trying down the bottom of a rock that’s fine-grained, still too fine-grained under a microscope. And differentiating minerals within the same class, such as carbonates or different phyllosilicates can be quite difficult to impossible to do under the microscope, and even harder to quantify.
Here we’ve got an image saying with XRD you go from a powder, from a powder you get a good pattern, and you can work out what minerals are present. And then, from there you can get good quantitative mineralogical results.
For mineral exploration, alteration studies are, obviously, very important to guide or towards orebodies. And they can also help geologist to understand the geological environment in which the minerals have formed.
And here, we’re just showing an image to show how XRD can be integrated into your core-logging program. Aside from just having a subjective method such as core-logging based on texture, now we can integrate quantitative mineralogical data into the tasks, and solve core questions like, ‘If we turn the drill hole early, is there anything there to indicate we should’ve kept drilling?’ And, ‘If we’ve got a sulfur anomaly, what minerals does the sulfur actually.
Now I’m going to move on to a case study that was published in 2015, which was using XRD compared to a lab-based instrument for quantitative mineralogical assessment to sort of proxy towards gold. Now, on this deposit minerology was important because the gold was quite nuggety in its distribution. This deposit, as you can see on the right, the core trays, it was just muddy abrasions. And it was quite difficult for the geologist to differentiate a muddy abrasion associated with mineralization from just fault gouge optically. So, for instance, you can see in some drill holes that you move slightly away. So they wanted a wall-rock proxy to tell them whether that area is favorable or unfavorable for mineralization.
In terms of the alteration model that was built up for this, we found that we had high temperature minerals such as epidote deposit. We found high amount of adularia. And then, at the top of the deposit, away from mineralization, the wall-rock alteration was dominated by illite, without any adularia. And then, you have this zone of transition between adularia-dominated alteration and illite-dominated alteration. And it was at this zone of transition between the two that we found most of the gold popped out.
We had a really good alteration model, but we wanted to see if we could actually go out and replicate it in the field compared to a lab-based instrument. On the left, in that stratigraphic column, you can see we have the quantitative results of lab XRD on a full kilowatts system compared to the XRD, at 40 minutes and 20 minutes. And you can see that visually, the geologist’s interpretation is not really going to change based on the 40 minute or the 20 minute runtime. And if we have a look on the right, we can see on the x axis of the results it’s lab-based instrument, on the y axis is the 20 minute result, just to show that all the minerals will quantify on the XRD, on the portable, as well as they were on the lab-based instrument.
And as you can see in the bottom right hand corner, with this adularia versus clay ratio that we’ve put together, the mineralization was really popping out at a particular concentration of adularia to clay. So, why would you use this as an exploration proxy to gold? But the next question I always get after we show this data is, ‘How did you know the data was reliable? You’ve compared to a lab-based instrument, but how do you know the results from the lab-based instrument were correct?’ So, what we did is we did a mass balanceon the X axis is the result of laboratory XRF, on the Y axis is the result of the mass balance using the minerology converted back to chemistry, just to show that the technique matched up.
We’ve been doing a lot of work in the last year on looking on XRD for exploration for a range of different commodities. We’ve come out in the last year for bauxite and gold exploration, but we’ve also got datasets for graphite, lithium, copper, iron ore, potash, many different commodities. So, if you’re interested in anything in particular, feel free to send us a message or an email afterwards, and we can have a chat, or we can send you through some data to show you how the results look.
I’m just going to show one more example now for graphite. Graphite, obviously, being hot commodity at the moment, and carbon being something that is hard to quantify using any handheld device. With XRD we can quantify the amount of carbon, not just made in graphite, which can be quite important. So at the top we’ve got the results in the top end bottom graph, on the x axis, and on the y axis we have the results estimated from quantitative minerology. And what you can see is it’s doing an excellent job at quantifying total graphitic carbon. And for carbon in carbonates, it’s actually been able to verify whether there were false positives on carbon in carbonates, in the red box. This was because of high level of iron oxide in the samples, which were giving false positives. So the geo on site was really happy that he was able to verify his log results using quantitative XRD.
We’ve sent a lot of time in the last year looking at XRD for mineral processing. It’s a really exciting space for us. Obviously, we’ve got time constrains today, so I can’t into too much other than just to mention that XRD can help with comminution, floatation, leaching, a whole different range of mineral processing, application as well as blending. So, if you’d like to have a chat about that at all, please, feel free to ask, and we can talk further about this.
Now to quickly run through one of the cool things that you’re able to do. It’s actually start to combine portable XRD and portable XRF together. One of the great examples that we’ve published quite recently, and it’s what people have probably seen, it’s the ability to use them together for logging drill holes. And again, without going into too much detail, on the left, we can see we’re basically deriving quantitative minerology down the hole. In the middle of this plot, we’re seeing various elements, some are giving us ideas about rock types, some are giving us ideas about the top of mineralization. And then, on the right, we’ve got a bunch of derived data products where we’re using advanced algorithms to determine rock type, and determine the fertility of the orebody that we’re in, and even back out things like physics, which we haven’t been able to do before.
What is the minimum amount of sample that can be analyzed with XRD?
The maximum amount that can be done is 15 mg, but you can go as low as sort of 5 to 8 mg with our instrument. Which, like I said before, is great if you want to do selective sampling, as well as bulk sampling, because you can really narrow it down and get quite a small amount of sample. So, yeah, 5 to 8 mg is sort of the minimum.


 This XRD Analyzer is the world’s first truly portable X-ray diffractometer. Most X-ray diffractometers are very large instruments that take up most of the laboratory. This is the laboratory instrument that you can bring with you in the field. It runs on 4 lithium-ion batteries and it weighs about 15 kilograms. The instrument’s really easy to use. Everything is stationary, so you can actually move it around and it can go into rugged environments.